
|
|||||
|
 | |
| |
| |
| |
| |
| |
|
Gene: ZBTB7A |
Gene summary for ZBTB7A |
| Gene information | Species | Human | Gene symbol | ZBTB7A | Gene ID | 51341 |
| Gene name | zinc finger and BTB domain containing 7A | |
| Gene Alias | FBI-1 | |
| Cytomap | 19p13.3 | |
| Gene Type | protein-coding | GO ID | GO:0000122 | UniProtAcc | O95365 |
Top |
Malignant transformation analysis |
| Identification of the aberrant gene expression in precancerous and cancerous lesions by comparing the gene expression of stem-like cells in diseased tissues with normal stem cells |
| Entrez ID | Symbol | Replicates | Species | Organ | Tissue | Adj P-value | Log2FC | Malignancy |
| 51341 | ZBTB7A | HTA11_3410_2000001011 | Human | Colorectum | AD | 2.82e-06 | -4.15e-01 | 0.0155 |
| 51341 | ZBTB7A | HTA11_347_2000001011 | Human | Colorectum | AD | 2.03e-18 | 6.56e-01 | -0.1954 |
| 51341 | ZBTB7A | HTA11_411_2000001011 | Human | Colorectum | SER | 7.02e-03 | 7.51e-01 | -0.2602 |
| 51341 | ZBTB7A | HTA11_83_2000001011 | Human | Colorectum | SER | 6.42e-06 | 6.01e-01 | -0.1526 |
| 51341 | ZBTB7A | HTA11_696_2000001011 | Human | Colorectum | AD | 1.91e-06 | 4.91e-01 | -0.1464 |
| 51341 | ZBTB7A | HTA11_1391_2000001011 | Human | Colorectum | AD | 1.58e-04 | 5.56e-01 | -0.059 |
| 51341 | ZBTB7A | HTA11_99999970781_79442 | Human | Colorectum | MSS | 4.44e-05 | -3.69e-01 | 0.294 |
| 51341 | ZBTB7A | A002-C-010 | Human | Colorectum | FAP | 8.87e-06 | -3.40e-01 | 0.242 |
| 51341 | ZBTB7A | A015-C-203 | Human | Colorectum | FAP | 1.20e-24 | -2.58e-01 | -0.1294 |
| 51341 | ZBTB7A | A002-C-201 | Human | Colorectum | FAP | 1.52e-07 | -8.98e-02 | 0.0324 |
| 51341 | ZBTB7A | A002-C-203 | Human | Colorectum | FAP | 8.04e-06 | -1.54e-01 | 0.2786 |
| 51341 | ZBTB7A | A001-C-108 | Human | Colorectum | FAP | 1.79e-12 | -1.26e-01 | -0.0272 |
| 51341 | ZBTB7A | A002-C-205 | Human | Colorectum | FAP | 2.46e-15 | -2.90e-01 | -0.1236 |
| 51341 | ZBTB7A | A001-C-104 | Human | Colorectum | FAP | 6.73e-03 | -2.29e-01 | 0.0184 |
| 51341 | ZBTB7A | A015-C-005 | Human | Colorectum | FAP | 4.48e-02 | -1.76e-01 | -0.0336 |
| 51341 | ZBTB7A | A015-C-006 | Human | Colorectum | FAP | 1.27e-10 | -2.72e-02 | -0.0994 |
| 51341 | ZBTB7A | A015-C-106 | Human | Colorectum | FAP | 4.99e-08 | -2.24e-01 | -0.0511 |
| 51341 | ZBTB7A | A002-C-114 | Human | Colorectum | FAP | 3.92e-12 | -2.61e-02 | -0.1561 |
| 51341 | ZBTB7A | A015-C-104 | Human | Colorectum | FAP | 1.06e-25 | -2.57e-01 | -0.1899 |
| 51341 | ZBTB7A | A001-C-014 | Human | Colorectum | FAP | 1.95e-12 | -2.05e-01 | 0.0135 |
| Page: 1 2 3 4 5 6 7 8 9 |
| Tissue | Expression Dynamics | Abbreviation |
| Colorectum (GSE201348) |  | FAP: Familial adenomatous polyposis |
| CRC: Colorectal cancer | ||
| Colorectum (HTA11) |  | AD: Adenomas |
| SER: Sessile serrated lesions | ||
| MSI-H: Microsatellite-high colorectal cancer | ||
| MSS: Microsatellite stable colorectal cancer | ||
| Esophagus | 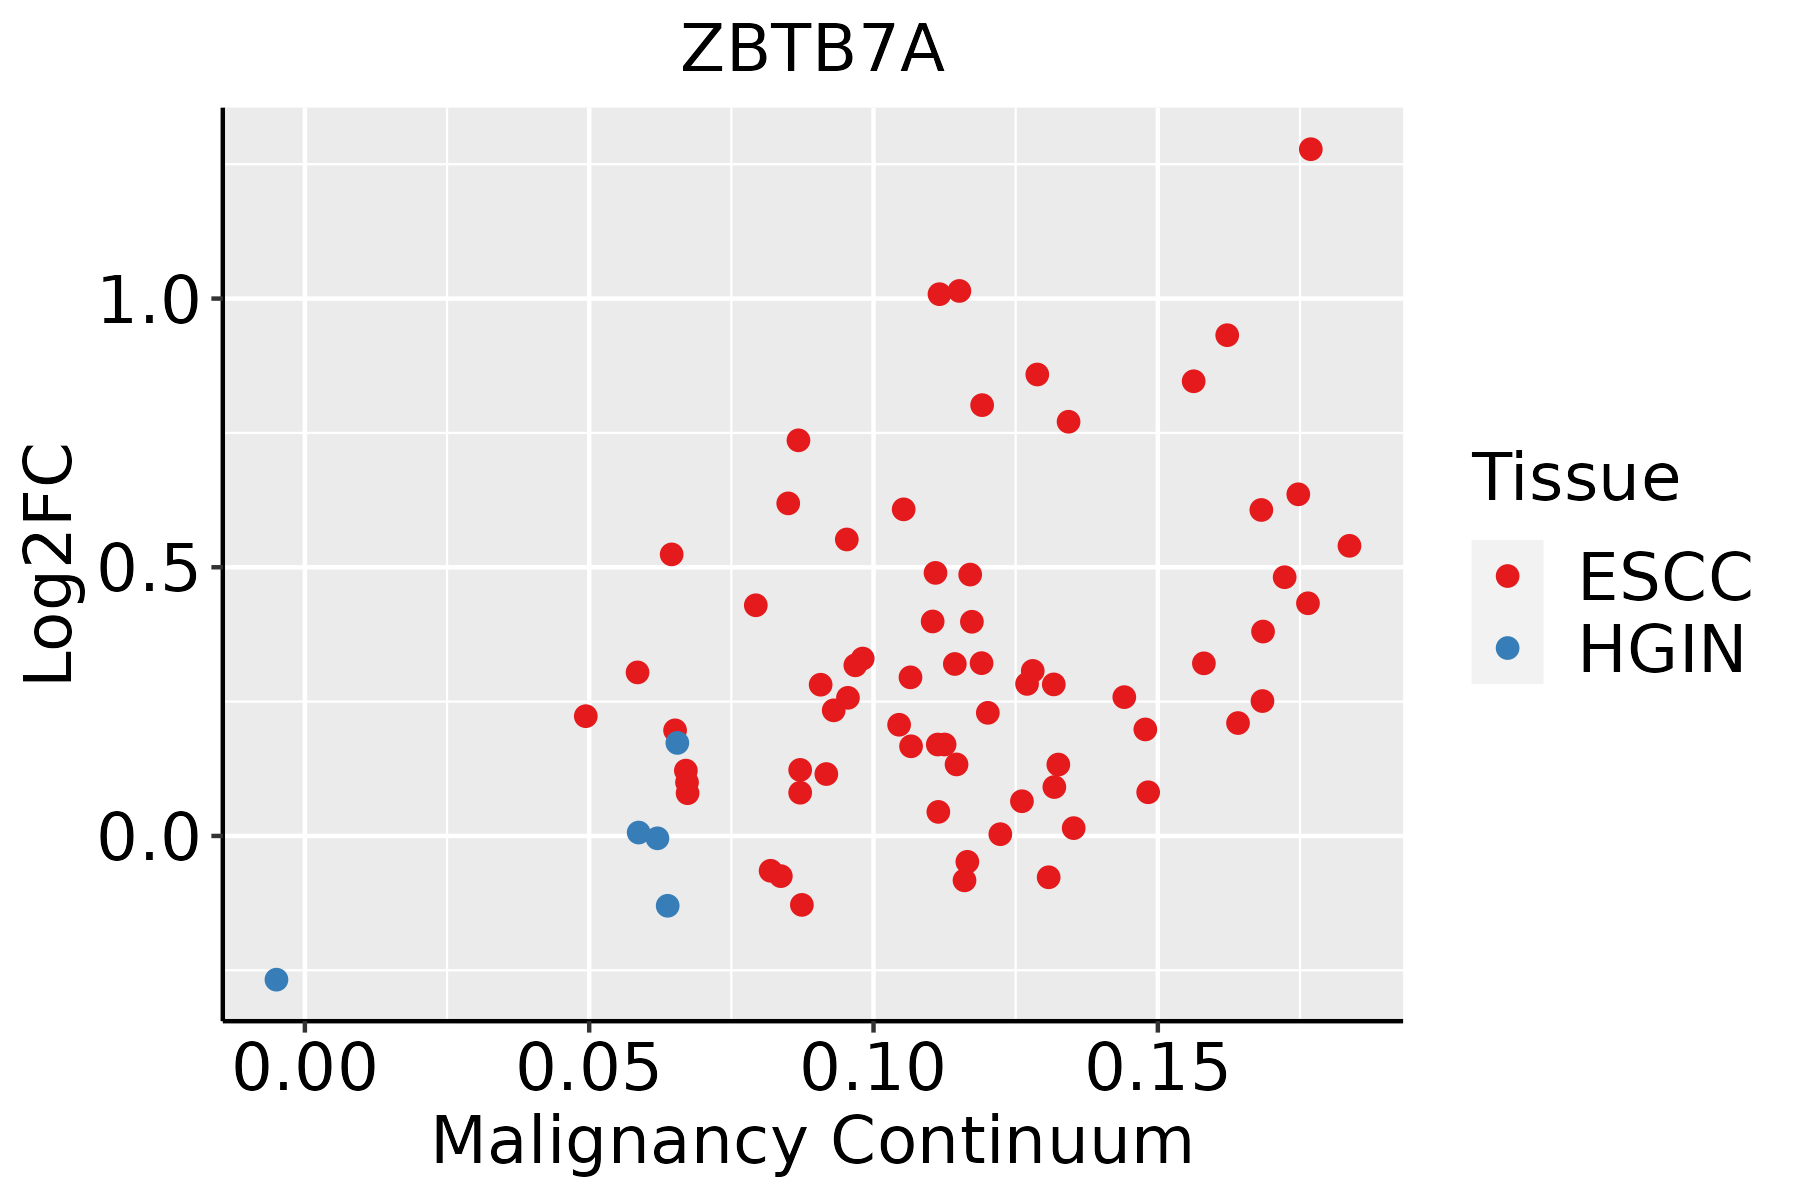 | ESCC: Esophageal squamous cell carcinoma |
| HGIN: High-grade intraepithelial neoplasias | ||
| LGIN: Low-grade intraepithelial neoplasias | ||
| Liver | 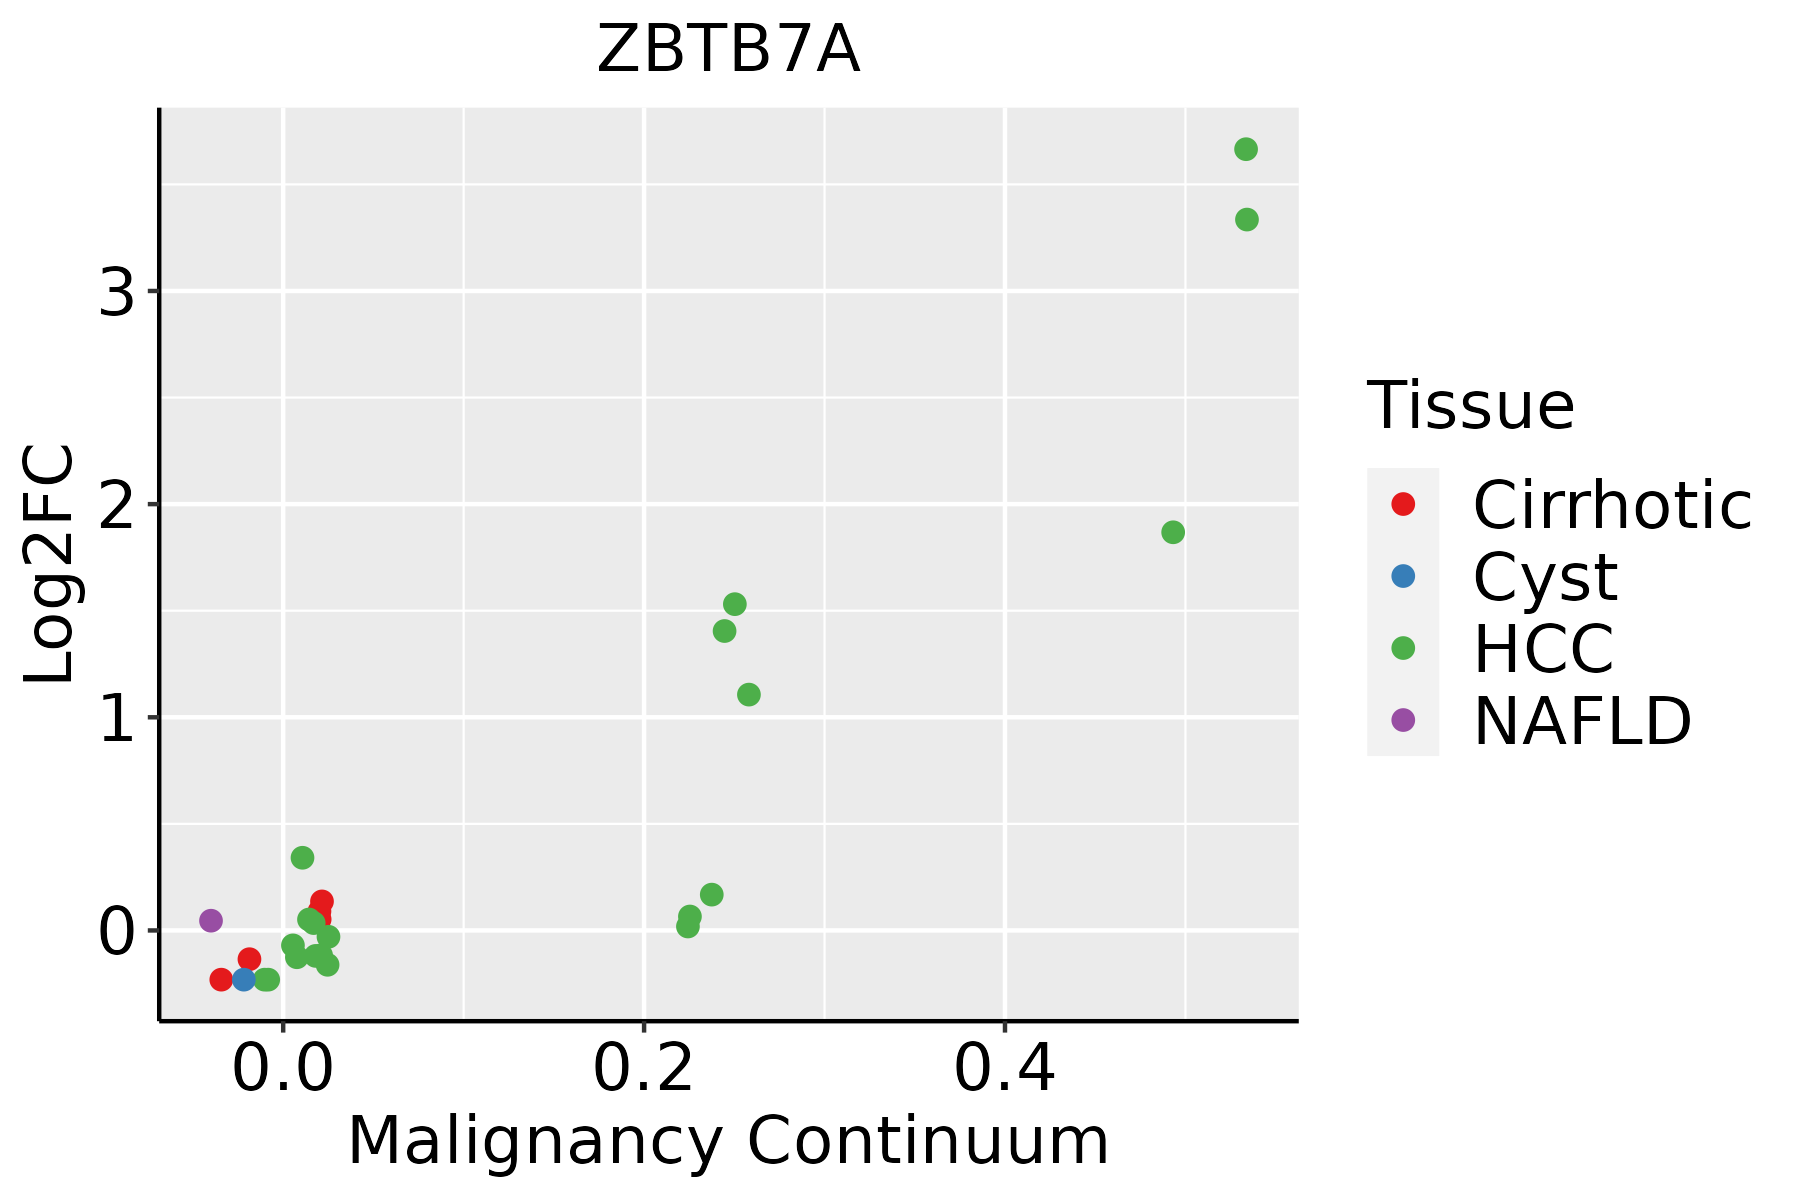 | HCC: Hepatocellular carcinoma |
| NAFLD: Non-alcoholic fatty liver disease | ||
| Oral Cavity | 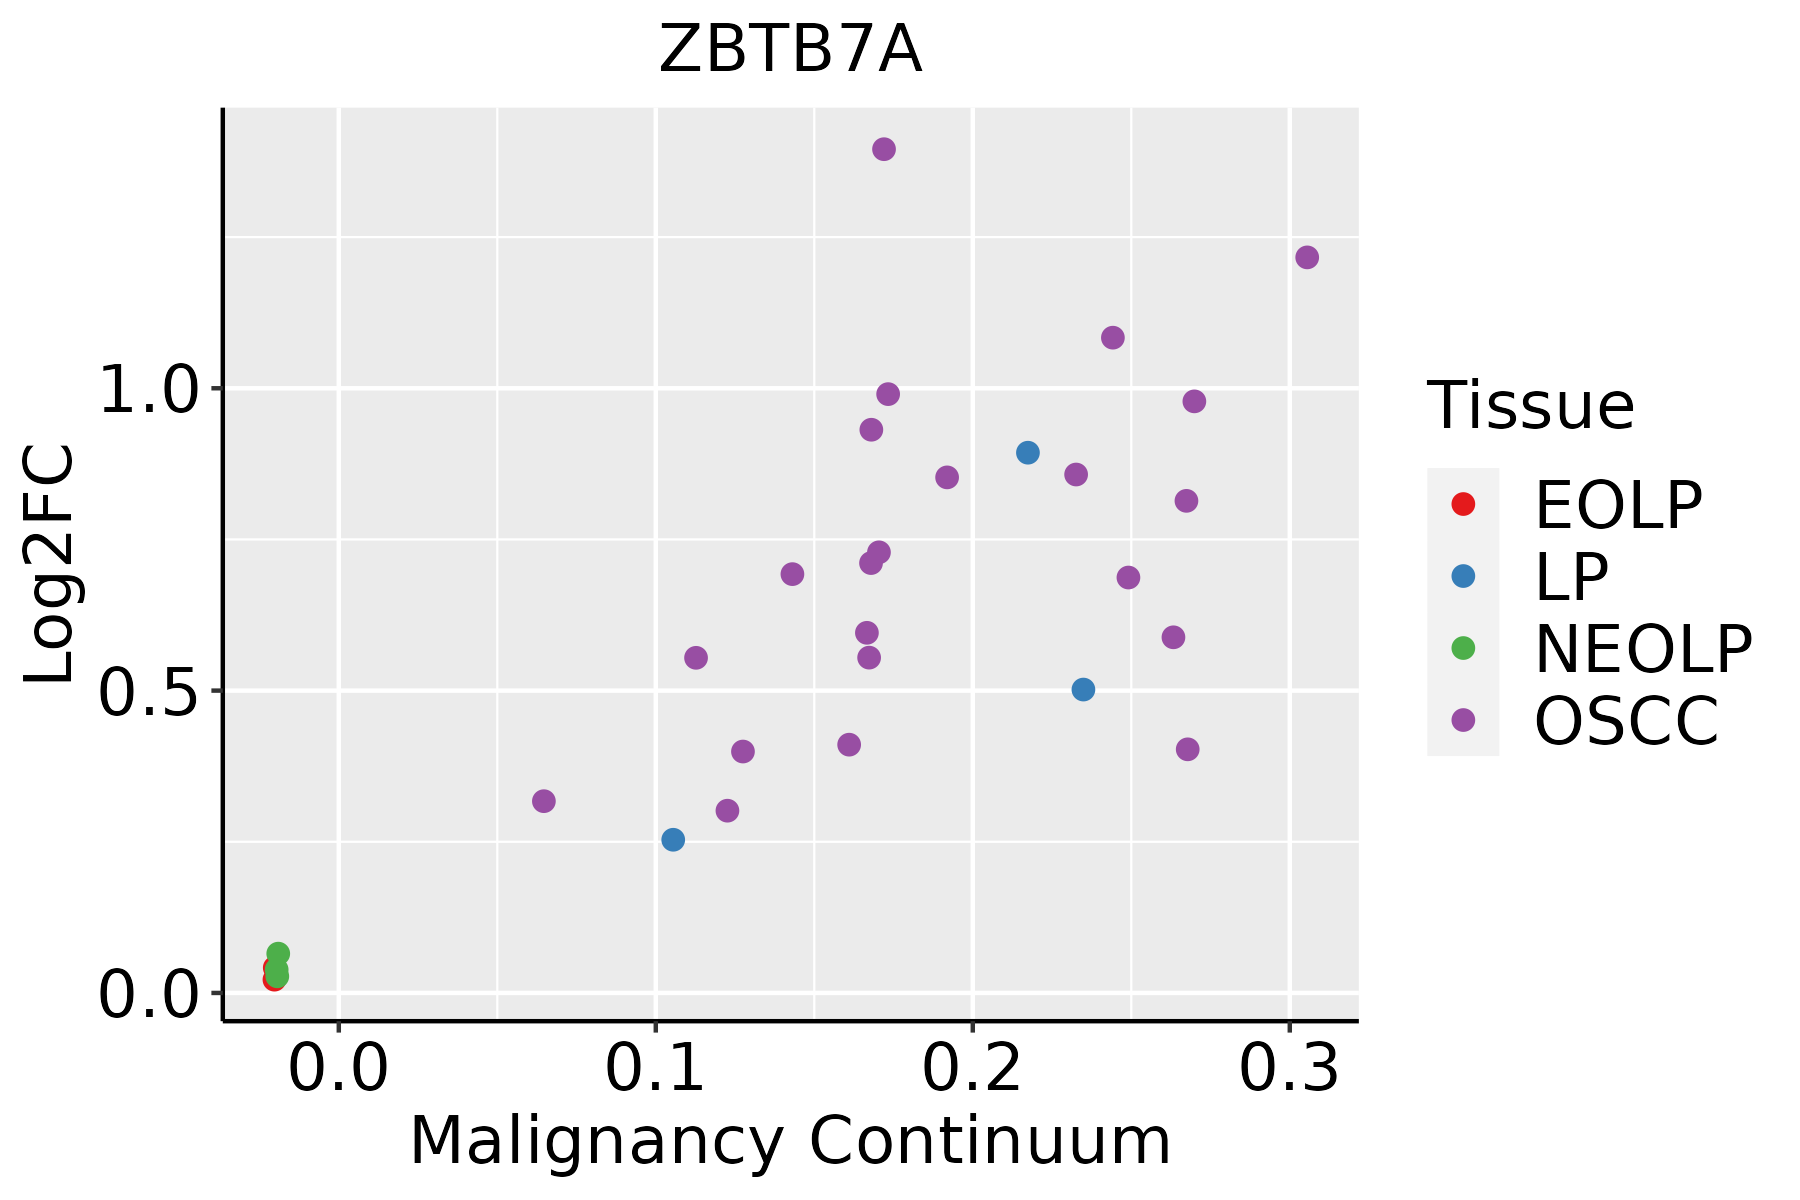 | EOLP: Erosive Oral lichen planus |
| LP: leukoplakia | ||
| NEOLP: Non-erosive oral lichen planus | ||
| OSCC: Oral squamous cell carcinoma | ||
| Prostate |  | BPH: Benign Prostatic Hyperplasia |
| Skin | 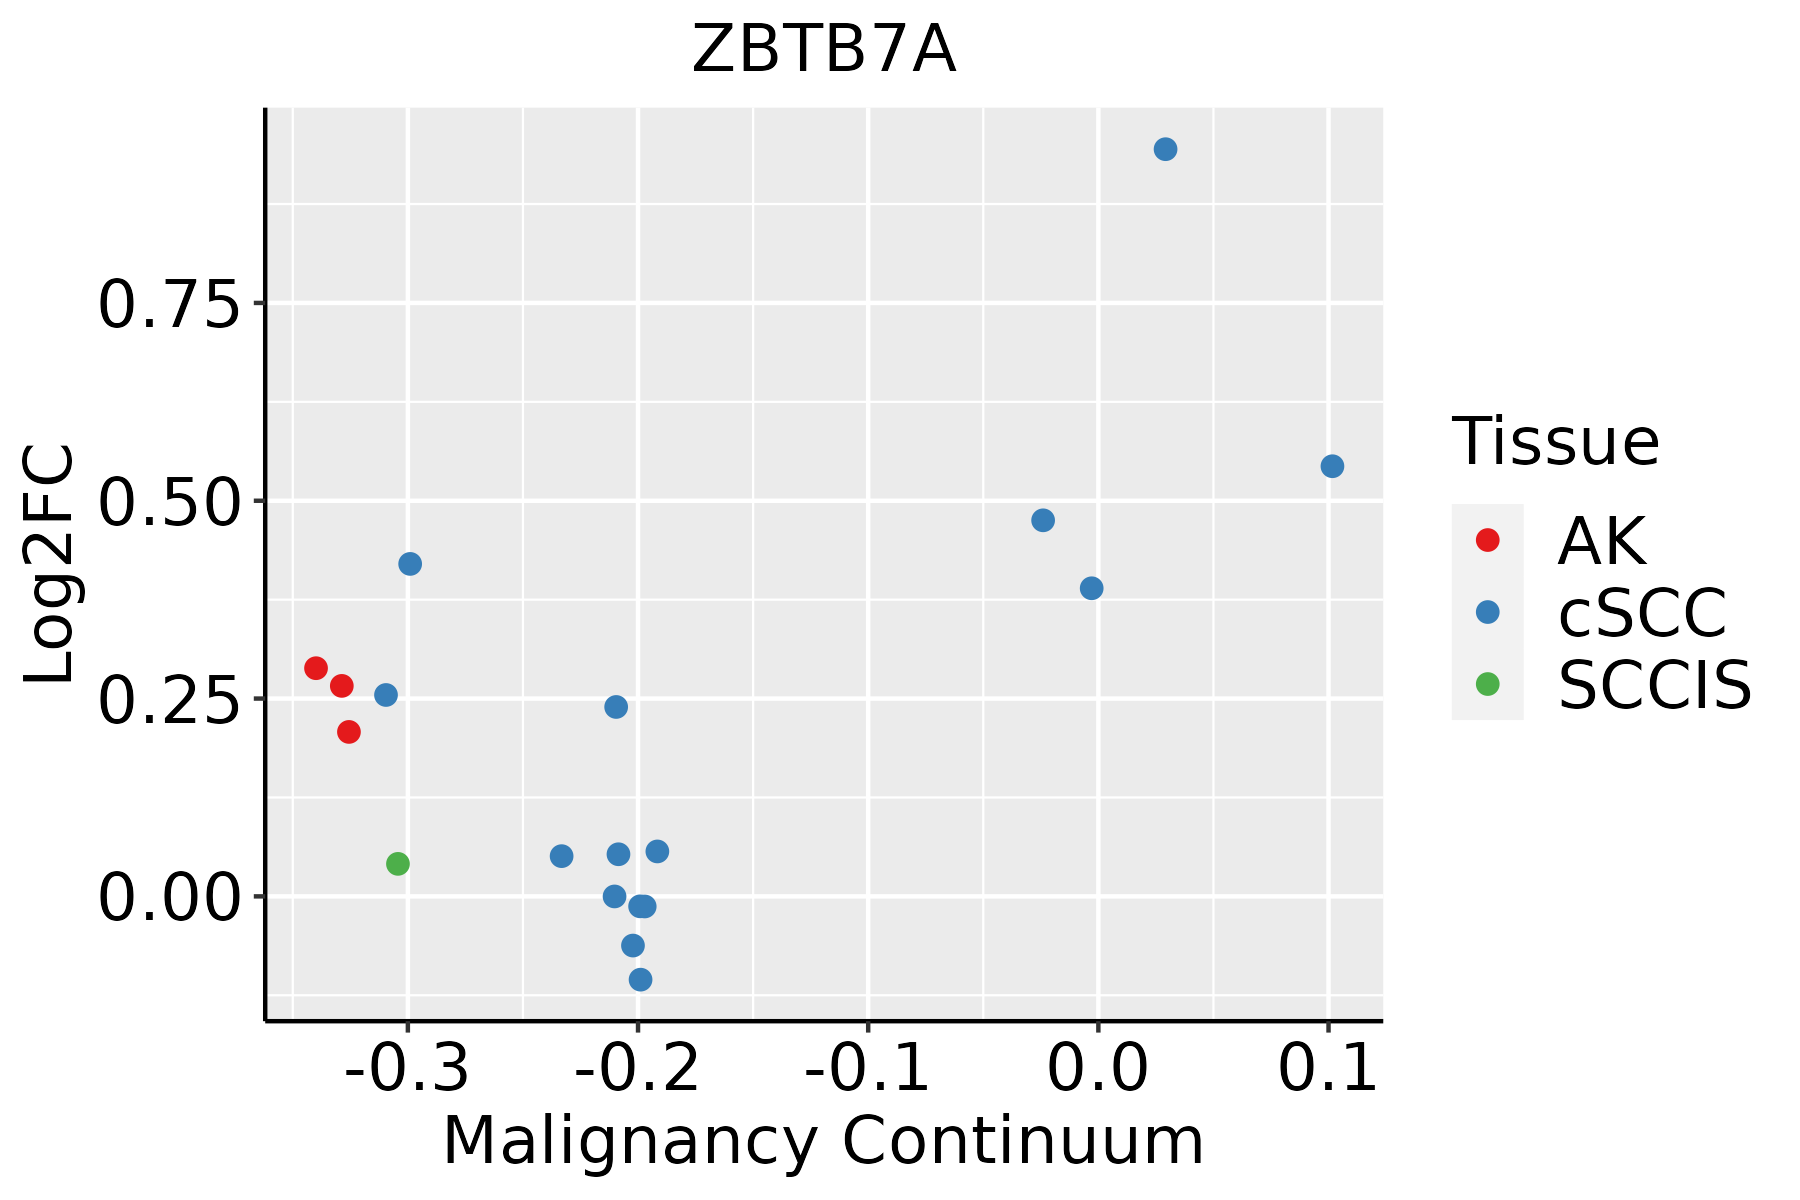 | AK: Actinic keratosis |
| cSCC: Cutaneous squamous cell carcinoma | ||
| SCCIS:squamous cell carcinoma in situ | ||
| Thyroid | 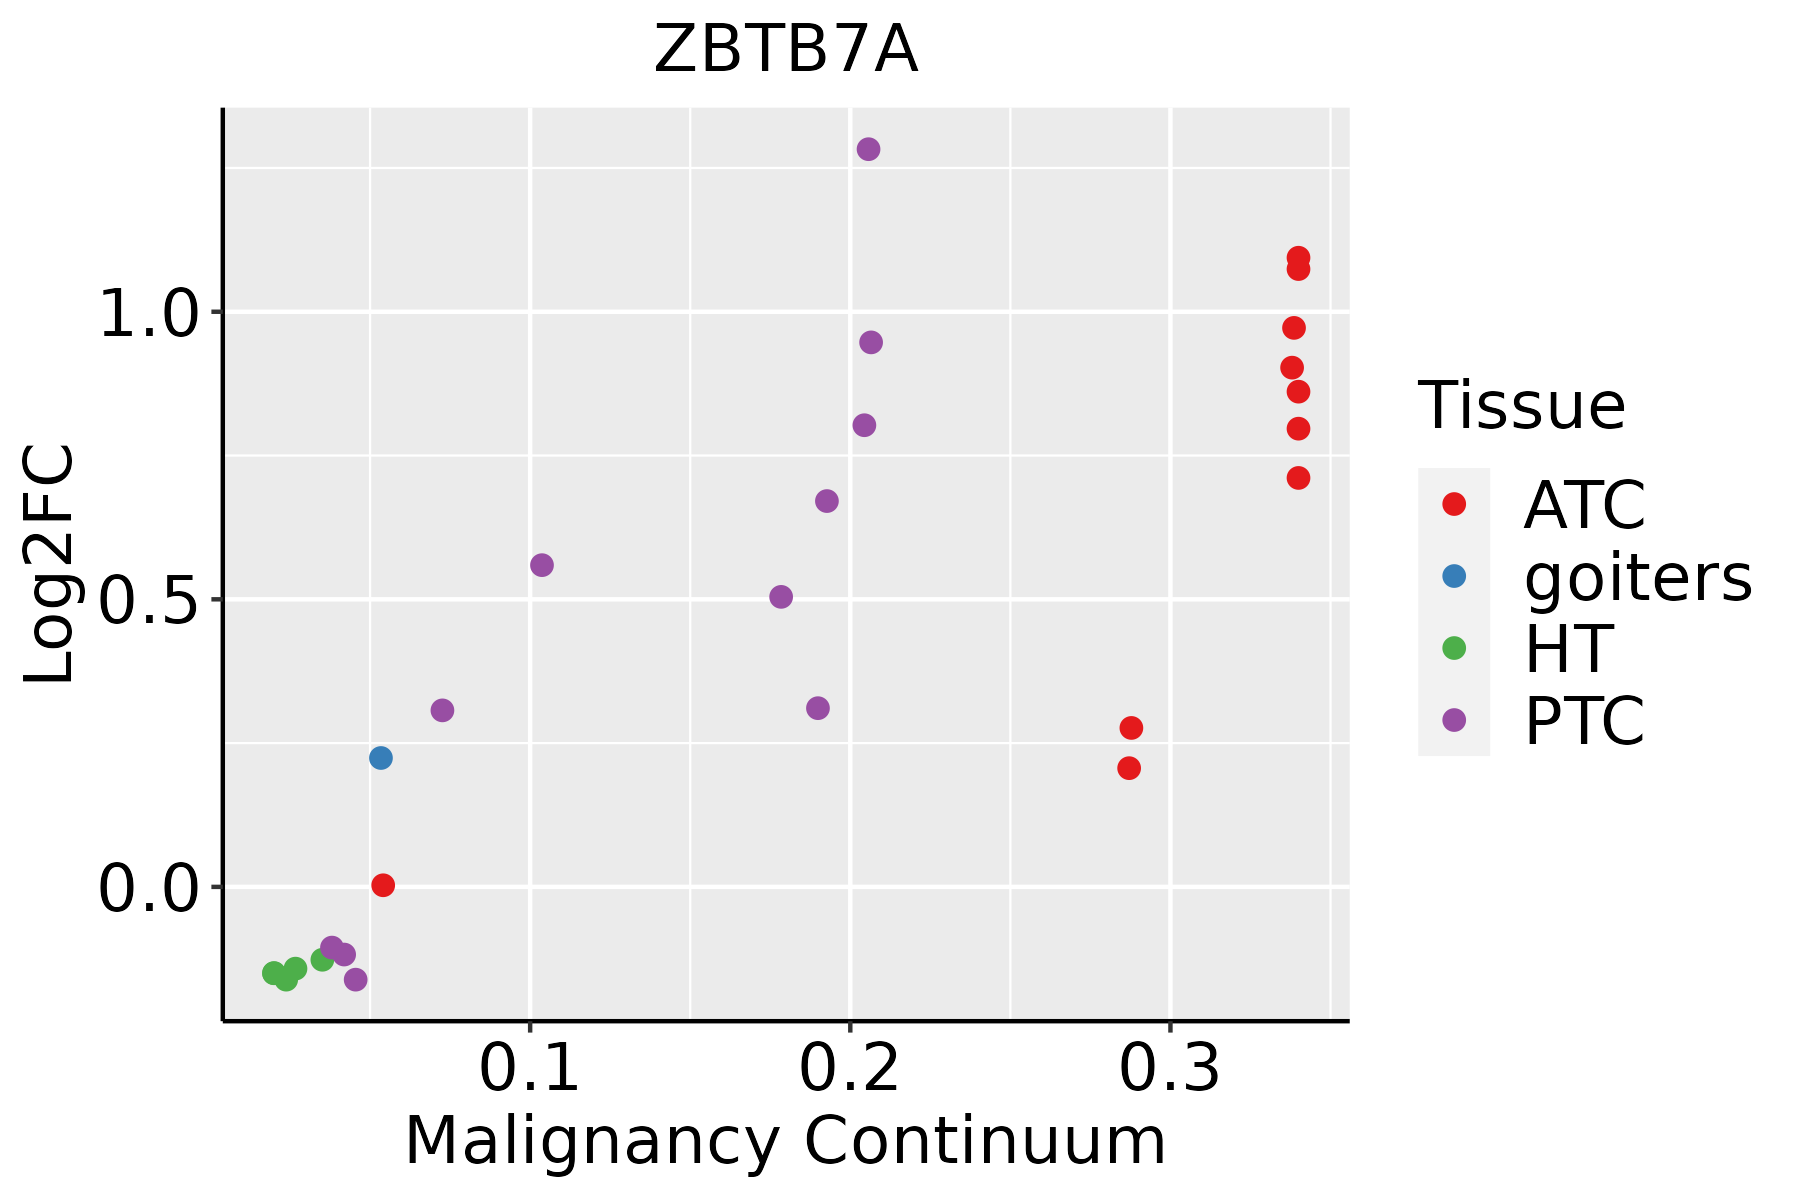 | ATC: Anaplastic thyroid cancer |
| HT: Hashimoto's thyroiditis | ||
| PTC: Papillary thyroid cancer |
| ∗log2FC in expression of this searched gene in stem-like cells from each diseased tissue sample relative to stem-like cells in normal samples in each tissue plotted against the malignancy continuum. Samples are colored based on if they are from different disease stage. |
Top |
Malignant transformation related pathway analysis |
| Find out the enriched GO biological processes and KEGG pathways involved in transition from healthy to precancer to cancer |
| Tissue | Disease Stage | Enriched GO biological Processes |
| Colorectum | AD |  |
| Colorectum | SER |  |
| Colorectum | MSS |  |
| Colorectum | MSI-H |  |
| Colorectum | FAP |  |
| ∗Top 15 enriched GO BP terms are showed in the bar plot of each disease state in each tissue. Each row represents a significant GO biological process which is colored according to the -log10(p.adjust). |
| Page: 1 2 3 4 5 6 7 8 9 |
| GO ID | Tissue | Disease Stage | Description | Gene Ratio | Bg Ratio | pvalue | p.adjust | Count |
| GO:0046034 | Colorectum | AD | ATP metabolic process | 142/3918 | 277/18723 | 2.64e-29 | 8.26e-26 | 142 |
| GO:0006091 | Colorectum | AD | generation of precursor metabolites and energy | 209/3918 | 490/18723 | 3.17e-28 | 6.61e-25 | 209 |
| GO:0008380 | Colorectum | AD | RNA splicing | 169/3918 | 434/18723 | 3.59e-18 | 2.04e-15 | 169 |
| GO:0000377 | Colorectum | AD | RNA splicing, via transesterification reactions with bulged adenosine as nucleophile | 130/3918 | 320/18723 | 5.88e-16 | 2.16e-13 | 130 |
| GO:0000398 | Colorectum | AD | mRNA splicing, via spliceosome | 130/3918 | 320/18723 | 5.88e-16 | 2.16e-13 | 130 |
| GO:0000375 | Colorectum | AD | RNA splicing, via transesterification reactions | 131/3918 | 324/18723 | 7.11e-16 | 2.22e-13 | 131 |
| GO:0009150 | Colorectum | AD | purine ribonucleotide metabolic process | 142/3918 | 368/18723 | 4.29e-15 | 1.17e-12 | 142 |
| GO:0006163 | Colorectum | AD | purine nucleotide metabolic process | 149/3918 | 396/18723 | 1.08e-14 | 2.80e-12 | 149 |
| GO:1903311 | Colorectum | AD | regulation of mRNA metabolic process | 117/3918 | 288/18723 | 1.69e-14 | 4.23e-12 | 117 |
| GO:0072521 | Colorectum | AD | purine-containing compound metabolic process | 153/3918 | 416/18723 | 4.34e-14 | 1.01e-11 | 153 |
| GO:0009259 | Colorectum | AD | ribonucleotide metabolic process | 144/3918 | 385/18723 | 5.25e-14 | 1.13e-11 | 144 |
| GO:0019693 | Colorectum | AD | ribose phosphate metabolic process | 145/3918 | 396/18723 | 3.01e-13 | 5.71e-11 | 145 |
| GO:0043484 | Colorectum | AD | regulation of RNA splicing | 70/3918 | 148/18723 | 6.47e-13 | 1.16e-10 | 70 |
| GO:0009117 | Colorectum | AD | nucleotide metabolic process | 168/3918 | 489/18723 | 2.20e-12 | 3.36e-10 | 168 |
| GO:0006753 | Colorectum | AD | nucleoside phosphate metabolic process | 169/3918 | 497/18723 | 4.99e-12 | 6.98e-10 | 169 |
| GO:0048024 | Colorectum | AD | regulation of mRNA splicing, via spliceosome | 50/3918 | 101/18723 | 1.62e-10 | 1.56e-08 | 50 |
| GO:0050684 | Colorectum | AD | regulation of mRNA processing | 61/3918 | 137/18723 | 4.23e-10 | 3.58e-08 | 61 |
| GO:0051098 | Colorectum | AD | regulation of binding | 126/3918 | 363/18723 | 6.01e-10 | 4.88e-08 | 126 |
| GO:0009135 | Colorectum | AD | purine nucleoside diphosphate metabolic process | 47/3918 | 103/18723 | 1.61e-08 | 9.22e-07 | 47 |
| GO:0009179 | Colorectum | AD | purine ribonucleoside diphosphate metabolic process | 47/3918 | 103/18723 | 1.61e-08 | 9.22e-07 | 47 |
| Page: 1 2 3 4 5 6 7 8 9 10 11 12 13 14 15 16 17 18 19 20 21 22 23 24 25 26 27 28 29 30 31 32 33 34 35 36 37 38 39 40 41 42 43 44 45 46 47 48 49 50 51 |
| Pathway ID | Tissue | Disease Stage | Description | Gene Ratio | Bg Ratio | pvalue | p.adjust | qvalue | Count |
| Page: 1 |
Top |
Cell-cell communication analysis |
| Identification of potential cell-cell interactions between two cell types and their ligand-receptor pairs for different disease states |
| Ligand | Receptor | LRpair | Pathway | Tissue | Disease Stage |
| Page: 1 |
Top |
Single-cell gene regulatory network inference analysis |
| Find out the significant the regulons (TFs) and the target genes of each regulon across cell types for different disease states |
| TF | Cell Type | Tissue | Disease Stage | Target Gene | RSS | Regulon Activity |
| ZBTB7A | MLUM | Breast | DCIS | MALAT1,DDX5,PPDPF, etc. | 6.46e-01 |  |
| ZBTB7A | BN | Liver | HCC | RNF166,PPP3R1,XPC, etc. | 4.84e-02 |  |
| ∗The dot plots of a searched regulon are shown for all cell subpopulations in each disease state of each tissue based on the regulon specific score inferred using pySCENIC and by calculating the average expression. |
| Page: 1 |
Top |
Somatic mutation of malignant transformation related genes |
| Annotation of somatic variants for genes involved in malignant transformation |
| Hugo Symbol | Variant Class | Variant Classification | dbSNP RS | HGVSc | HGVSp | HGVSp Short | SWISSPROT | BIOTYPE | SIFT | PolyPhen | Tumor Sample Barcode | Tissue | Histology | Sex | Age | Stage | Therapy Types | Drugs | Outcome |
| ZBTB7A | SNV | Missense_Mutation | c.1271N>C | p.Lys424Thr | p.K424T | O95365 | protein_coding | deleterious(0) | probably_damaging(0.999) | TCGA-BR-4371-01 | Stomach | stomach adenocarcinoma | Female | >=65 | I/II | Unknown | Unknown | SD | |
| ZBTB7A | SNV | Missense_Mutation | c.1271N>C | p.Lys424Thr | p.K424T | O95365 | protein_coding | deleterious(0) | probably_damaging(0.999) | TCGA-BR-8372-01 | Stomach | stomach adenocarcinoma | Male | <65 | III/IV | Chemotherapy | etoposide | CR | |
| ZBTB7A | SNV | Missense_Mutation | c.1726N>A | p.Asp576Asn | p.D576N | O95365 | protein_coding | deleterious_low_confidence(0.01) | benign(0.005) | TCGA-D7-A4YU-01 | Stomach | stomach adenocarcinoma | Male | >=65 | III/IV | Chemotherapy | capecitabine | SD | |
| ZBTB7A | SNV | Missense_Mutation | novel | c.166N>G | p.Ser56Gly | p.S56G | O95365 | protein_coding | deleterious(0.01) | probably_damaging(0.999) | TCGA-D7-A6F0-01 | Stomach | stomach adenocarcinoma | Female | >=65 | I/II | Unknown | Unknown | SD |
| ZBTB7A | SNV | Missense_Mutation | c.334N>T | p.Arg112Cys | p.R112C | O95365 | protein_coding | deleterious(0.05) | probably_damaging(0.934) | TCGA-HU-A4GQ-01 | Stomach | stomach adenocarcinoma | Male | >=65 | III/IV | Unknown | Unknown | SD | |
| ZBTB7A | SNV | Missense_Mutation | novel | c.1702G>A | p.Gly568Arg | p.G568R | O95365 | protein_coding | tolerated_low_confidence(0.06) | benign(0.16) | TCGA-VQ-A8P2-01 | Stomach | stomach adenocarcinoma | Male | >=65 | III/IV | Unspecific | Complete Response | |
| ZBTB7A | SNV | Missense_Mutation | rs773321856 | c.1711N>T | p.Pro571Ser | p.P571S | O95365 | protein_coding | deleterious_low_confidence(0.04) | benign(0) | TCGA-VQ-A91U-01 | Stomach | stomach adenocarcinoma | Male | >=65 | III/IV | Unknown | Unknown | SD |
| ZBTB7A | deletion | In_Frame_Del | novel | c.1165_1167delAAG | p.Lys389del | p.K389del | O95365 | protein_coding | TCGA-RD-A8NB-01 | Stomach | stomach adenocarcinoma | Female | >=65 | III/IV | Unknown | Unknown | PD | ||
| ZBTB7A | SNV | Missense_Mutation | novel | c.1097C>A | p.Pro366Gln | p.P366Q | O95365 | protein_coding | deleterious(0) | possibly_damaging(0.831) | TCGA-EM-A2CL-01 | Thyroid | thyroid carcinoma | Male | <65 | I/II | Unknown | Unknown | SD |
| Page: 1 2 3 4 5 |
Top |
Related drugs of malignant transformation related genes |
| Identification of chemicals and drugs interact with genes involved in malignant transfromation |
| (DGIdb 4.0) |
| Entrez ID | Symbol | Category | Interaction Types | Drug Claim Name | Drug Name | PMIDs |
| Page: 1 |

Copyright 2023-Present -The University of Texas Health Science Center at Houston |