
|
|||||
|
 | |
| |
| |
| |
| |
| |
|
Gene: STAC2 |
Gene summary for STAC2 |
| Gene information | Species | Human | Gene symbol | STAC2 | Gene ID | 342667 |
| Gene name | SH3 and cysteine rich domain 2 | |
| Gene Alias | 24b2 | |
| Cytomap | 17q12 | |
| Gene Type | protein-coding | GO ID | GO:0003008 | UniProtAcc | D0IN09 |
Top |
Malignant transformation analysis |
| Identification of the aberrant gene expression in precancerous and cancerous lesions by comparing the gene expression of stem-like cells in diseased tissues with normal stem cells |
| Entrez ID | Symbol | Replicates | Species | Organ | Tissue | Adj P-value | Log2FC | Malignancy |
| 342667 | STAC2 | GSM4909281 | Human | Breast | IDC | 1.31e-02 | 1.93e-01 | 0.21 |
| 342667 | STAC2 | GSM4909295 | Human | Breast | IDC | 4.67e-07 | 4.75e-01 | 0.0898 |
| 342667 | STAC2 | GSM4909299 | Human | Breast | IDC | 1.47e-23 | 7.09e-01 | 0.035 |
| 342667 | STAC2 | GSM4909300 | Human | Breast | IDC | 2.37e-02 | 3.46e-01 | 0.0334 |
| 342667 | STAC2 | GSM4909305 | Human | Breast | IDC | 5.90e-04 | 2.76e-01 | 0.0436 |
| 342667 | STAC2 | GSM4909309 | Human | Breast | IDC | 2.58e-12 | 5.55e-01 | 0.0483 |
| 342667 | STAC2 | GSM4909313 | Human | Breast | IDC | 5.08e-13 | 5.73e-01 | 0.0391 |
| 342667 | STAC2 | DCIS2 | Human | Breast | DCIS | 1.94e-105 | 1.17e+00 | 0.0085 |
| 342667 | STAC2 | HCC1 | Human | Liver | HCC | 1.05e-13 | 1.49e+00 | 0.5336 |
| 342667 | STAC2 | HCC2 | Human | Liver | HCC | 2.94e-23 | 1.65e+00 | 0.5341 |
| 342667 | STAC2 | HCC5 | Human | Liver | HCC | 4.55e-17 | 9.66e-01 | 0.4932 |
| Page: 1 |
| Tissue | Expression Dynamics | Abbreviation |
| Breast |  | IDC: Invasive ductal carcinoma |
| DCIS: Ductal carcinoma in situ | ||
| Precancer(BRCA1-mut): Precancerous lesion from BRCA1 mutation carriers | ||
| Liver | 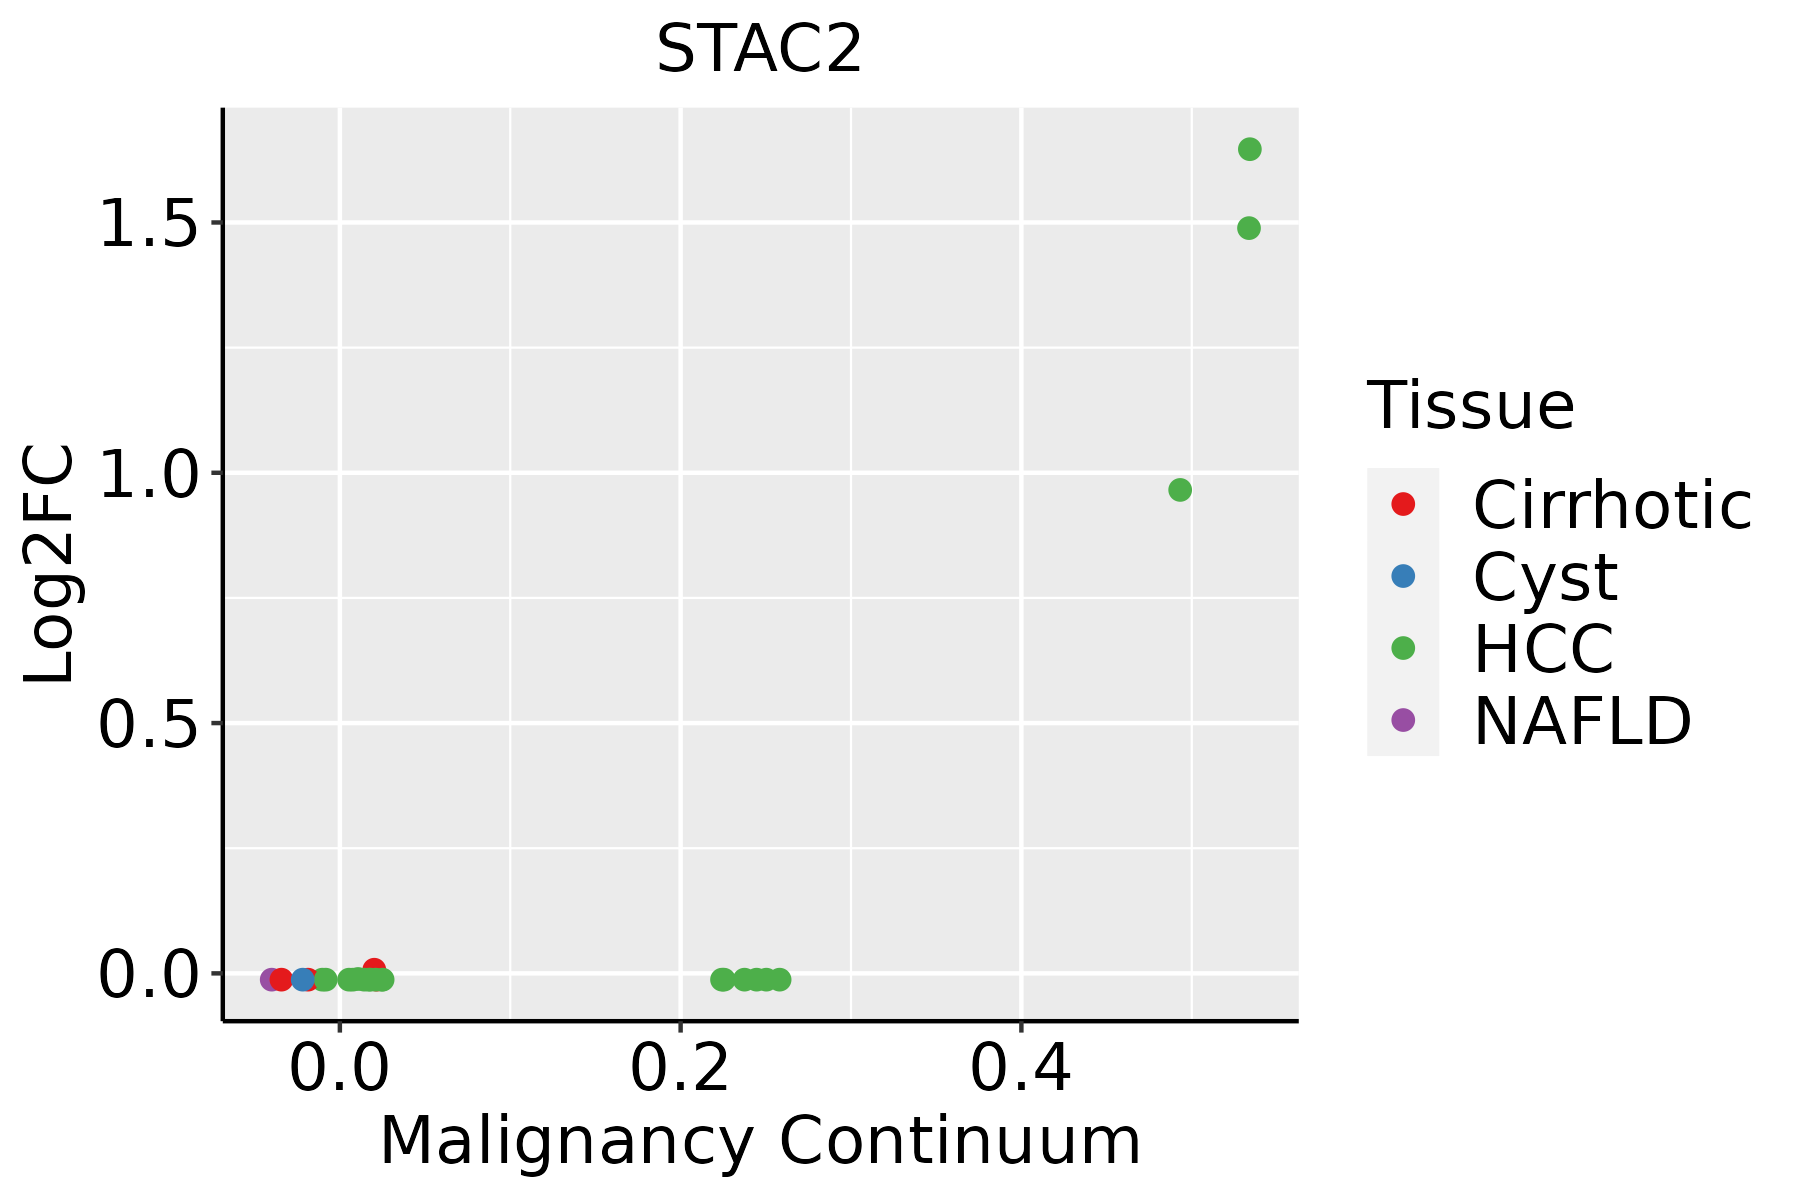 | HCC: Hepatocellular carcinoma |
| NAFLD: Non-alcoholic fatty liver disease |
| ∗log2FC in expression of this searched gene in stem-like cells from each diseased tissue sample relative to stem-like cells in normal samples in each tissue plotted against the malignancy continuum. Samples are colored based on if they are from different disease stage. |
Top |
Malignant transformation related pathway analysis |
| Find out the enriched GO biological processes and KEGG pathways involved in transition from healthy to precancer to cancer |
| Tissue | Disease Stage | Enriched GO biological Processes |
| Colorectum | AD |  |
| Colorectum | SER |  |
| Colorectum | MSS |  |
| Colorectum | MSI-H |  |
| Colorectum | FAP |  |
| ∗Top 15 enriched GO BP terms are showed in the bar plot of each disease state in each tissue. Each row represents a significant GO biological process which is colored according to the -log10(p.adjust). |
| Page: 1 2 3 4 5 6 7 8 9 |
| GO ID | Tissue | Disease Stage | Description | Gene Ratio | Bg Ratio | pvalue | p.adjust | Count |
| GO:190547513 | Breast | IDC | regulation of protein localization to membrane | 28/1434 | 175/18723 | 1.56e-04 | 2.71e-03 | 28 |
| GO:001095913 | Breast | IDC | regulation of metal ion transport | 52/1434 | 406/18723 | 1.76e-04 | 2.97e-03 | 52 |
| GO:003241111 | Breast | IDC | positive regulation of transporter activity | 20/1434 | 120/18723 | 7.64e-04 | 9.27e-03 | 20 |
| GO:190547713 | Breast | IDC | positive regulation of protein localization to membrane | 18/1434 | 106/18723 | 1.10e-03 | 1.21e-02 | 18 |
| GO:00432703 | Breast | IDC | positive regulation of ion transport | 36/1434 | 275/18723 | 1.11e-03 | 1.22e-02 | 36 |
| GO:190382914 | Breast | IDC | positive regulation of cellular protein localization | 36/1434 | 276/18723 | 1.19e-03 | 1.28e-02 | 36 |
| GO:002289812 | Breast | IDC | regulation of transmembrane transporter activity | 36/1434 | 278/18723 | 1.35e-03 | 1.40e-02 | 36 |
| GO:003241411 | Breast | IDC | positive regulation of ion transmembrane transporter activity | 18/1434 | 109/18723 | 1.53e-03 | 1.53e-02 | 18 |
| GO:003476711 | Breast | IDC | positive regulation of ion transmembrane transport | 24/1434 | 167/18723 | 2.07e-03 | 1.95e-02 | 24 |
| GO:190307613 | Breast | IDC | regulation of protein localization to plasma membrane | 17/1434 | 104/18723 | 2.28e-03 | 2.09e-02 | 17 |
| GO:190437513 | Breast | IDC | regulation of protein localization to cell periphery | 19/1434 | 125/18723 | 3.06e-03 | 2.60e-02 | 19 |
| GO:0051924 | Breast | IDC | regulation of calcium ion transport | 32/1434 | 255/18723 | 3.94e-03 | 3.22e-02 | 32 |
| GO:00324125 | Breast | IDC | regulation of ion transmembrane transporter activity | 33/1434 | 267/18723 | 4.38e-03 | 3.40e-02 | 33 |
| GO:00324096 | Breast | IDC | regulation of transporter activity | 37/1434 | 310/18723 | 4.77e-03 | 3.66e-02 | 37 |
| GO:00347644 | Breast | IDC | positive regulation of transmembrane transport | 28/1434 | 219/18723 | 5.19e-03 | 3.86e-02 | 28 |
| GO:0051928 | Breast | IDC | positive regulation of calcium ion transport | 18/1434 | 122/18723 | 5.35e-03 | 3.95e-02 | 18 |
| GO:00030125 | Breast | IDC | muscle system process | 50/1434 | 452/18723 | 5.52e-03 | 4.05e-02 | 50 |
| GO:00726599 | Breast | IDC | protein localization to plasma membrane | 34/1434 | 284/18723 | 6.33e-03 | 4.47e-02 | 34 |
| GO:001095921 | Breast | DCIS | regulation of metal ion transport | 50/1390 | 406/18723 | 2.86e-04 | 4.22e-03 | 50 |
| GO:190382924 | Breast | DCIS | positive regulation of cellular protein localization | 37/1390 | 276/18723 | 3.40e-04 | 4.87e-03 | 37 |
| Page: 1 2 3 |
| Pathway ID | Tissue | Disease Stage | Description | Gene Ratio | Bg Ratio | pvalue | p.adjust | qvalue | Count |
| Page: 1 |
Top |
Cell-cell communication analysis |
| Identification of potential cell-cell interactions between two cell types and their ligand-receptor pairs for different disease states |
| Ligand | Receptor | LRpair | Pathway | Tissue | Disease Stage |
| Page: 1 |
Top |
Single-cell gene regulatory network inference analysis |
| Find out the significant the regulons (TFs) and the target genes of each regulon across cell types for different disease states |
| TF | Cell Type | Tissue | Disease Stage | Target Gene | RSS | Regulon Activity |
| ∗The dot plots of a searched regulon are shown for all cell subpopulations in each disease state of each tissue based on the regulon specific score inferred using pySCENIC and by calculating the average expression. |
| Page: 1 |
Top |
Somatic mutation of malignant transformation related genes |
| Annotation of somatic variants for genes involved in malignant transformation |
| Hugo Symbol | Variant Class | Variant Classification | dbSNP RS | HGVSc | HGVSp | HGVSp Short | SWISSPROT | BIOTYPE | SIFT | PolyPhen | Tumor Sample Barcode | Tissue | Histology | Sex | Age | Stage | Therapy Types | Drugs | Outcome |
| STAC2 | SNV | Missense_Mutation | rs370925083 | c.721N>A | p.Glu241Lys | p.E241K | Q6ZMT1 | protein_coding | deleterious(0.02) | benign(0.005) | TCGA-EL-A3GO-01 | Thyroid | thyroid carcinoma | Female | <65 | I/II | Unknown | Unknown | PD |
| Page: 1 2 3 4 5 |
Top |
Related drugs of malignant transformation related genes |
| Identification of chemicals and drugs interact with genes involved in malignant transfromation |
| (DGIdb 4.0) |
| Entrez ID | Symbol | Category | Interaction Types | Drug Claim Name | Drug Name | PMIDs |
| Page: 1 |

Copyright 2023-Present -The University of Texas Health Science Center at Houston |