
|
|||||
|
 | |
| |
| |
| |
| |
| |
|
Gene: PPP3CC |
Gene summary for PPP3CC |
| Gene information | Species | Human | Gene symbol | PPP3CC | Gene ID | 5533 |
| Gene name | protein phosphatase 3 catalytic subunit gamma | |
| Gene Alias | CALNA3 | |
| Cytomap | 8p21.3 | |
| Gene Type | protein-coding | GO ID | GO:0006464 | UniProtAcc | P48454 |
Top |
Malignant transformation analysis |
| Identification of the aberrant gene expression in precancerous and cancerous lesions by comparing the gene expression of stem-like cells in diseased tissues with normal stem cells |
| Entrez ID | Symbol | Replicates | Species | Organ | Tissue | Adj P-value | Log2FC | Malignancy |
| 5533 | PPP3CC | LZE4T | Human | Esophagus | ESCC | 3.80e-08 | 2.54e-01 | 0.0811 |
| 5533 | PPP3CC | LZE24T | Human | Esophagus | ESCC | 4.71e-08 | 2.70e-01 | 0.0596 |
| 5533 | PPP3CC | P1T-E | Human | Esophagus | ESCC | 2.02e-07 | 3.11e-01 | 0.0875 |
| 5533 | PPP3CC | P2T-E | Human | Esophagus | ESCC | 5.66e-23 | 3.70e-01 | 0.1177 |
| 5533 | PPP3CC | P4T-E | Human | Esophagus | ESCC | 9.30e-18 | 3.89e-01 | 0.1323 |
| 5533 | PPP3CC | P5T-E | Human | Esophagus | ESCC | 4.42e-09 | 1.25e-01 | 0.1327 |
| 5533 | PPP3CC | P8T-E | Human | Esophagus | ESCC | 2.42e-20 | 3.60e-01 | 0.0889 |
| 5533 | PPP3CC | P9T-E | Human | Esophagus | ESCC | 6.24e-09 | 2.24e-01 | 0.1131 |
| 5533 | PPP3CC | P10T-E | Human | Esophagus | ESCC | 1.25e-18 | 2.24e-01 | 0.116 |
| 5533 | PPP3CC | P11T-E | Human | Esophagus | ESCC | 4.03e-12 | 4.24e-01 | 0.1426 |
| 5533 | PPP3CC | P12T-E | Human | Esophagus | ESCC | 6.53e-13 | 2.37e-01 | 0.1122 |
| 5533 | PPP3CC | P15T-E | Human | Esophagus | ESCC | 3.40e-02 | 8.68e-02 | 0.1149 |
| 5533 | PPP3CC | P16T-E | Human | Esophagus | ESCC | 6.44e-08 | 1.20e-01 | 0.1153 |
| 5533 | PPP3CC | P19T-E | Human | Esophagus | ESCC | 2.55e-08 | 5.44e-01 | 0.1662 |
| 5533 | PPP3CC | P20T-E | Human | Esophagus | ESCC | 1.63e-19 | 4.05e-01 | 0.1124 |
| 5533 | PPP3CC | P21T-E | Human | Esophagus | ESCC | 8.13e-07 | 1.58e-01 | 0.1617 |
| 5533 | PPP3CC | P22T-E | Human | Esophagus | ESCC | 5.45e-07 | 1.72e-01 | 0.1236 |
| 5533 | PPP3CC | P23T-E | Human | Esophagus | ESCC | 1.13e-09 | 2.90e-01 | 0.108 |
| 5533 | PPP3CC | P24T-E | Human | Esophagus | ESCC | 1.50e-18 | 3.77e-01 | 0.1287 |
| 5533 | PPP3CC | P26T-E | Human | Esophagus | ESCC | 2.35e-31 | 5.39e-01 | 0.1276 |
| Page: 1 2 3 4 |
| Tissue | Expression Dynamics | Abbreviation |
| Esophagus | 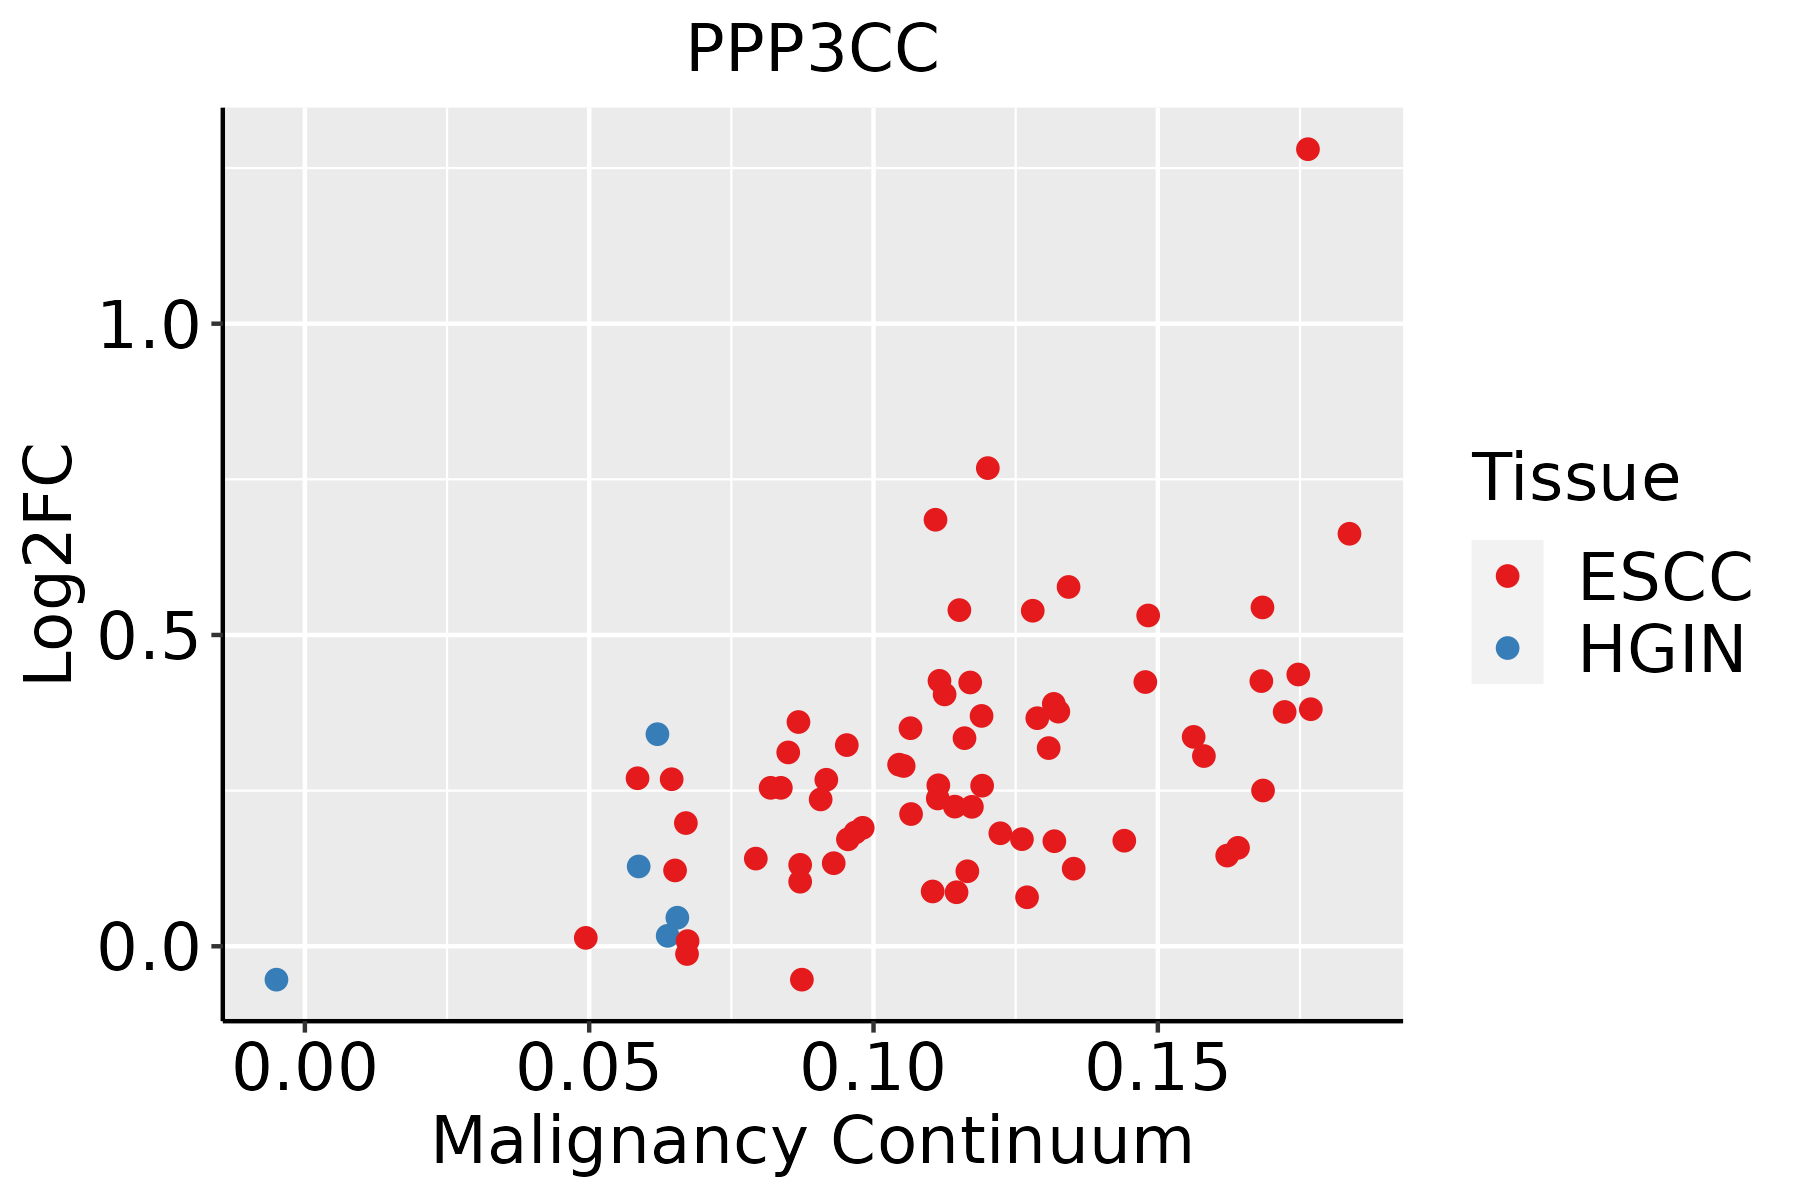 | ESCC: Esophageal squamous cell carcinoma |
| HGIN: High-grade intraepithelial neoplasias | ||
| LGIN: Low-grade intraepithelial neoplasias | ||
| Oral Cavity | 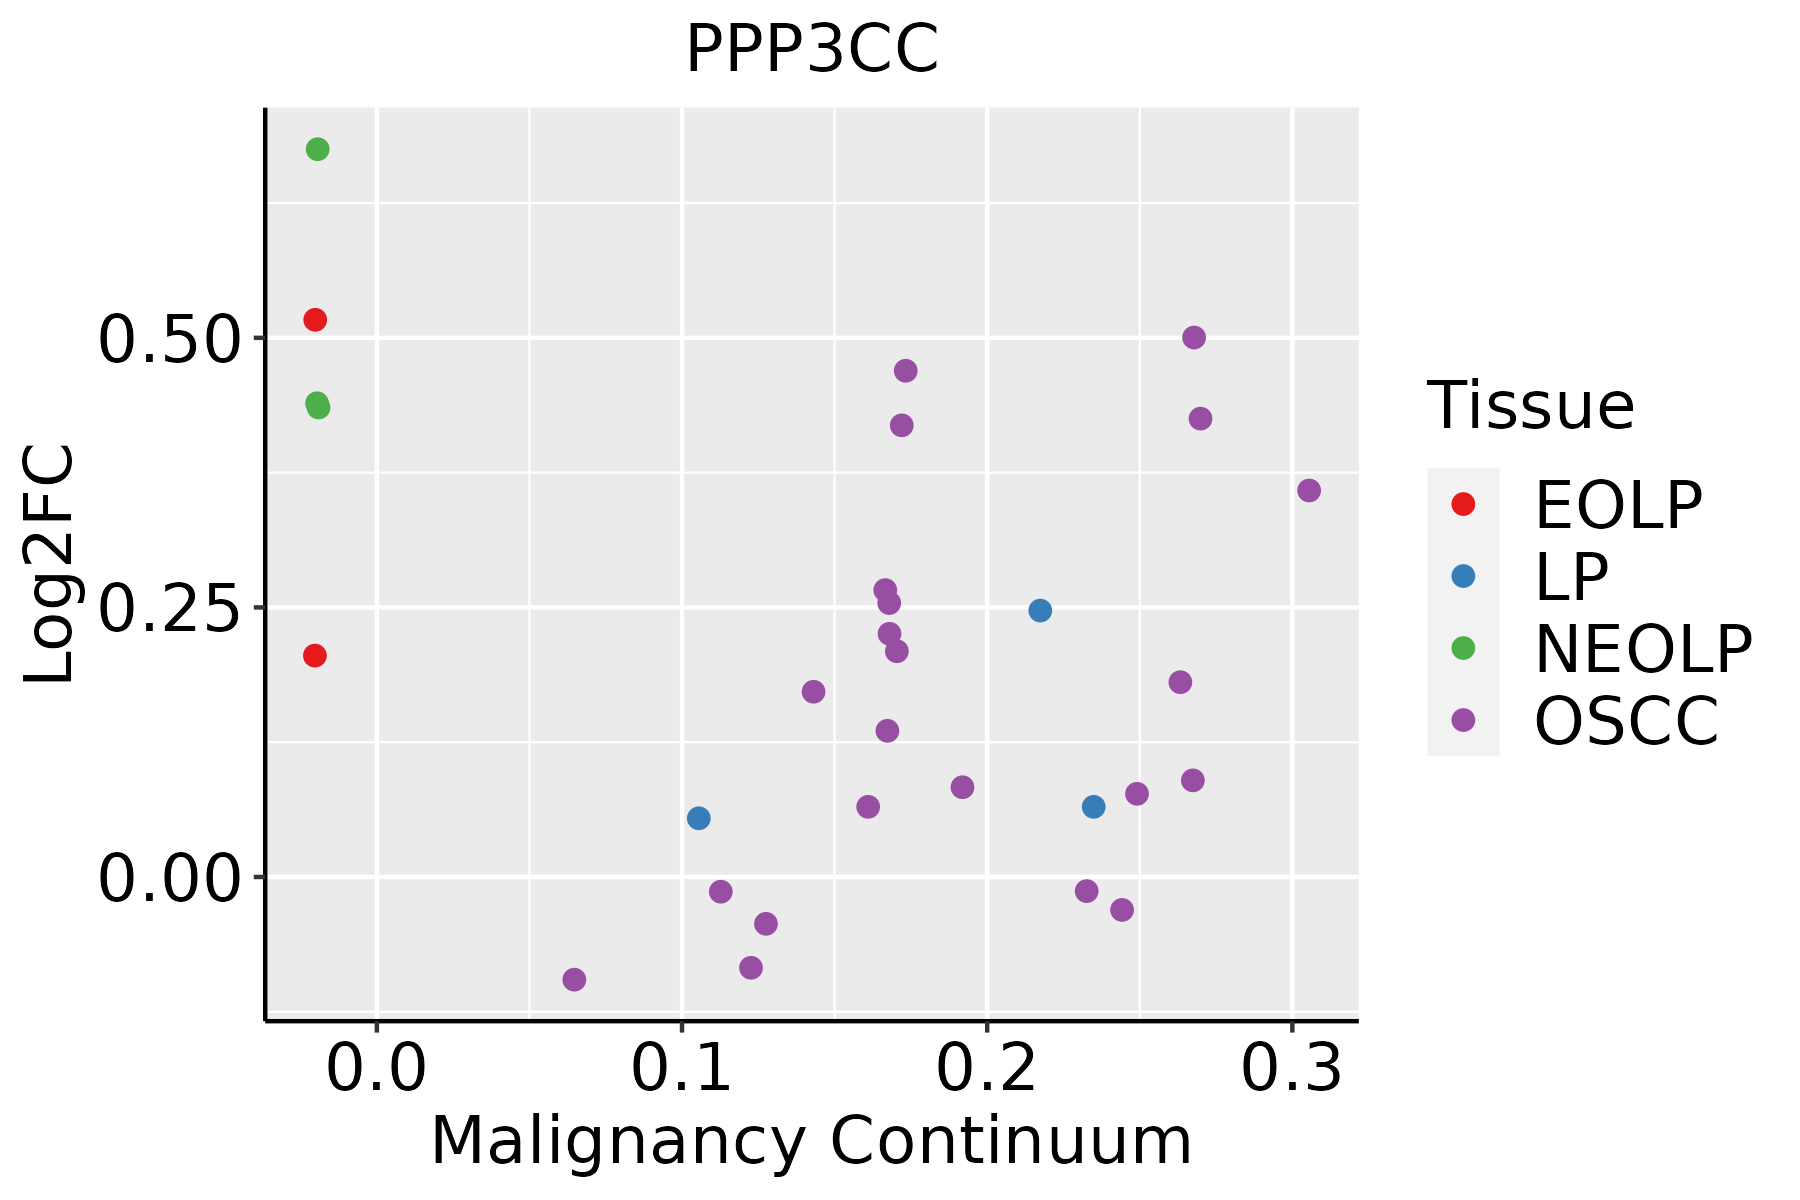 | EOLP: Erosive Oral lichen planus |
| LP: leukoplakia | ||
| NEOLP: Non-erosive oral lichen planus | ||
| OSCC: Oral squamous cell carcinoma |
| ∗log2FC in expression of this searched gene in stem-like cells from each diseased tissue sample relative to stem-like cells in normal samples in each tissue plotted against the malignancy continuum. Samples are colored based on if they are from different disease stage. |
Top |
Malignant transformation related pathway analysis |
| Find out the enriched GO biological processes and KEGG pathways involved in transition from healthy to precancer to cancer |
| Tissue | Disease Stage | Enriched GO biological Processes |
| Colorectum | AD |  |
| Colorectum | SER |  |
| Colorectum | MSS |  |
| Colorectum | MSI-H |  |
| Colorectum | FAP |  |
| ∗Top 15 enriched GO BP terms are showed in the bar plot of each disease state in each tissue. Each row represents a significant GO biological process which is colored according to the -log10(p.adjust). |
| Page: 1 2 3 4 5 6 7 8 9 |
| GO ID | Tissue | Disease Stage | Description | Gene Ratio | Bg Ratio | pvalue | p.adjust | Count |
| GO:001631110 | Esophagus | ESCC | dephosphorylation | 251/8552 | 417/18723 | 1.26e-09 | 2.99e-08 | 251 |
| GO:000647018 | Esophagus | ESCC | protein dephosphorylation | 177/8552 | 281/18723 | 3.13e-09 | 6.72e-08 | 177 |
| GO:003010018 | Esophagus | ESCC | regulation of endocytosis | 135/8552 | 211/18723 | 5.75e-08 | 1.02e-06 | 135 |
| GO:004580718 | Esophagus | ESCC | positive regulation of endocytosis | 69/8552 | 100/18723 | 1.97e-06 | 2.29e-05 | 69 |
| GO:000647015 | Oral cavity | OSCC | protein dephosphorylation | 162/7305 | 281/18723 | 1.56e-10 | 4.56e-09 | 162 |
| GO:00163119 | Oral cavity | OSCC | dephosphorylation | 220/7305 | 417/18723 | 6.33e-09 | 1.34e-07 | 220 |
| GO:003010016 | Oral cavity | OSCC | regulation of endocytosis | 121/7305 | 211/18723 | 4.74e-08 | 8.80e-07 | 121 |
| GO:004580710 | Oral cavity | OSCC | positive regulation of endocytosis | 59/7305 | 100/18723 | 3.99e-05 | 3.48e-04 | 59 |
| GO:1903421 | Oral cavity | OSCC | regulation of synaptic vesicle recycling | 18/7305 | 27/18723 | 3.34e-03 | 1.42e-02 | 18 |
| GO:00331733 | Oral cavity | OSCC | calcineurin-NFAT signaling cascade | 26/7305 | 43/18723 | 3.55e-03 | 1.49e-02 | 26 |
| GO:00480164 | Oral cavity | OSCC | inositol phosphate-mediated signaling | 30/7305 | 55/18723 | 1.39e-02 | 4.59e-02 | 30 |
| GO:000647023 | Oral cavity | EOLP | protein dephosphorylation | 72/2218 | 281/18723 | 1.19e-10 | 1.35e-08 | 72 |
| GO:001631114 | Oral cavity | EOLP | dephosphorylation | 85/2218 | 417/18723 | 3.19e-07 | 9.47e-06 | 85 |
| GO:003010023 | Oral cavity | EOLP | regulation of endocytosis | 51/2218 | 211/18723 | 4.24e-07 | 1.19e-05 | 51 |
| GO:004580724 | Oral cavity | EOLP | positive regulation of endocytosis | 27/2218 | 100/18723 | 2.69e-05 | 3.94e-04 | 27 |
| GO:00990035 | Oral cavity | EOLP | vesicle-mediated transport in synapse | 39/2218 | 200/18723 | 1.14e-03 | 8.29e-03 | 39 |
| GO:00995044 | Oral cavity | EOLP | synaptic vesicle cycle | 34/2218 | 181/18723 | 4.25e-03 | 2.33e-02 | 34 |
| GO:00484885 | Oral cavity | EOLP | synaptic vesicle endocytosis | 15/2218 | 62/18723 | 5.00e-03 | 2.64e-02 | 15 |
| GO:01402385 | Oral cavity | EOLP | presynaptic endocytosis | 15/2218 | 62/18723 | 5.00e-03 | 2.64e-02 | 15 |
| GO:003010031 | Oral cavity | NEOLP | regulation of endocytosis | 47/2005 | 211/18723 | 7.96e-07 | 2.20e-05 | 47 |
| Page: 1 2 |
| Pathway ID | Tissue | Disease Stage | Description | Gene Ratio | Bg Ratio | pvalue | p.adjust | qvalue | Count |
| hsa05014210 | Esophagus | ESCC | Amyotrophic lateral sclerosis | 266/4205 | 364/8465 | 1.31e-20 | 2.20e-18 | 1.13e-18 | 266 |
| hsa05022210 | Esophagus | ESCC | Pathways of neurodegeneration - multiple diseases | 318/4205 | 476/8465 | 6.10e-15 | 2.04e-13 | 1.05e-13 | 318 |
| hsa05010210 | Esophagus | ESCC | Alzheimer disease | 263/4205 | 384/8465 | 1.80e-14 | 5.47e-13 | 2.80e-13 | 263 |
| hsa05166211 | Esophagus | ESCC | Human T-cell leukemia virus 1 infection | 164/4205 | 222/8465 | 8.13e-14 | 2.09e-12 | 1.07e-12 | 164 |
| hsa05020210 | Esophagus | ESCC | Prion disease | 193/4205 | 273/8465 | 6.42e-13 | 1.34e-11 | 6.89e-12 | 193 |
| hsa0421829 | Esophagus | ESCC | Cellular senescence | 119/4205 | 156/8465 | 5.89e-12 | 9.40e-11 | 4.81e-11 | 119 |
| hsa05170210 | Esophagus | ESCC | Human immunodeficiency virus 1 infection | 147/4205 | 212/8465 | 3.37e-09 | 3.53e-08 | 1.81e-08 | 147 |
| hsa05167211 | Esophagus | ESCC | Kaposi sarcoma-associated herpesvirus infection | 136/4205 | 194/8465 | 4.28e-09 | 4.22e-08 | 2.16e-08 | 136 |
| hsa05417211 | Esophagus | ESCC | Lipid and atherosclerosis | 143/4205 | 215/8465 | 3.30e-07 | 2.45e-06 | 1.26e-06 | 143 |
| hsa05163210 | Esophagus | ESCC | Human cytomegalovirus infection | 148/4205 | 225/8465 | 5.73e-07 | 4.00e-06 | 2.05e-06 | 148 |
| hsa046259 | Esophagus | ESCC | C-type lectin receptor signaling pathway | 73/4205 | 104/8465 | 1.57e-05 | 7.98e-05 | 4.09e-05 | 73 |
| hsa051527 | Esophagus | ESCC | Tuberculosis | 111/4205 | 180/8465 | 7.14e-04 | 2.32e-03 | 1.19e-03 | 111 |
| hsa052356 | Esophagus | ESCC | PD-L1 expression and PD-1 checkpoint pathway in cancer | 58/4205 | 89/8465 | 2.19e-03 | 6.16e-03 | 3.16e-03 | 58 |
| hsa046599 | Esophagus | ESCC | Th17 cell differentiation | 68/4205 | 108/8465 | 3.53e-03 | 9.30e-03 | 4.76e-03 | 68 |
| hsa0436016 | Esophagus | ESCC | Axon guidance | 108/4205 | 182/8465 | 5.13e-03 | 1.30e-02 | 6.67e-03 | 108 |
| hsa046585 | Esophagus | ESCC | Th1 and Th2 cell differentiation | 58/4205 | 92/8465 | 6.49e-03 | 1.60e-02 | 8.19e-03 | 58 |
| hsa046607 | Esophagus | ESCC | T cell receptor signaling pathway | 63/4205 | 104/8465 | 1.60e-02 | 3.60e-02 | 1.84e-02 | 63 |
| hsa0492214 | Esophagus | ESCC | Glucagon signaling pathway | 64/4205 | 107/8465 | 2.18e-02 | 4.80e-02 | 2.46e-02 | 64 |
| hsa041146 | Esophagus | ESCC | Oocyte meiosis | 77/4205 | 131/8465 | 2.19e-02 | 4.80e-02 | 2.46e-02 | 77 |
| hsa0501438 | Esophagus | ESCC | Amyotrophic lateral sclerosis | 266/4205 | 364/8465 | 1.31e-20 | 2.20e-18 | 1.13e-18 | 266 |
| Page: 1 2 3 4 5 6 7 8 9 10 |
Top |
Cell-cell communication analysis |
| Identification of potential cell-cell interactions between two cell types and their ligand-receptor pairs for different disease states |
| Ligand | Receptor | LRpair | Pathway | Tissue | Disease Stage |
| Page: 1 |
Top |
Single-cell gene regulatory network inference analysis |
| Find out the significant the regulons (TFs) and the target genes of each regulon across cell types for different disease states |
| TF | Cell Type | Tissue | Disease Stage | Target Gene | RSS | Regulon Activity |
| ∗The dot plots of a searched regulon are shown for all cell subpopulations in each disease state of each tissue based on the regulon specific score inferred using pySCENIC and by calculating the average expression. |
| Page: 1 |
Top |
Somatic mutation of malignant transformation related genes |
| Annotation of somatic variants for genes involved in malignant transformation |
| Hugo Symbol | Variant Class | Variant Classification | dbSNP RS | HGVSc | HGVSp | HGVSp Short | SWISSPROT | BIOTYPE | SIFT | PolyPhen | Tumor Sample Barcode | Tissue | Histology | Sex | Age | Stage | Therapy Types | Drugs | Outcome |
| PPP3CC | insertion | Nonsense_Mutation | novel | c.184_185insTAATAATTTAAAAT | p.Asn62IlefsTer4 | p.N62Ifs*4 | P48454 | protein_coding | TCGA-FY-A40L-01 | Thyroid | thyroid carcinoma | Female | <65 | I/II | Hormone Therapy | levothyroxine | SD |
| Page: 1 2 3 4 5 |
Top |
Related drugs of malignant transformation related genes |
| Identification of chemicals and drugs interact with genes involved in malignant transfromation |
| (DGIdb 4.0) |
| Entrez ID | Symbol | Category | Interaction Types | Drug Claim Name | Drug Name | PMIDs |
| 5533 | PPP3CC | TRANSCRIPTION FACTOR | VOCLOSPORIN | VOCLOSPORIN |
| Page: 1 |

Copyright 2023-Present -The University of Texas Health Science Center at Houston |