
|
|||||
|
 | |
| |
| |
| |
| |
| |
|
Gene: PIGW |
Gene summary for PIGW |
| Gene information | Species | Human | Gene symbol | PIGW | Gene ID | 284098 |
| Gene name | phosphatidylinositol glycan anchor biosynthesis class W | |
| Gene Alias | Gwt1 | |
| Cytomap | 17q12 | |
| Gene Type | protein-coding | GO ID | GO:0006464 | UniProtAcc | Q7Z7B1 |
Top |
Malignant transformation analysis |
| Identification of the aberrant gene expression in precancerous and cancerous lesions by comparing the gene expression of stem-like cells in diseased tissues with normal stem cells |
| Entrez ID | Symbol | Replicates | Species | Organ | Tissue | Adj P-value | Log2FC | Malignancy |
| 284098 | PIGW | LZE24T | Human | Esophagus | ESCC | 2.39e-05 | 1.73e-01 | 0.0596 |
| 284098 | PIGW | P2T-E | Human | Esophagus | ESCC | 4.54e-03 | 6.07e-02 | 0.1177 |
| 284098 | PIGW | P4T-E | Human | Esophagus | ESCC | 4.07e-07 | 2.15e-01 | 0.1323 |
| 284098 | PIGW | P5T-E | Human | Esophagus | ESCC | 3.84e-04 | 9.09e-02 | 0.1327 |
| 284098 | PIGW | P8T-E | Human | Esophagus | ESCC | 1.19e-03 | 1.38e-01 | 0.0889 |
| 284098 | PIGW | P9T-E | Human | Esophagus | ESCC | 5.49e-04 | 6.20e-02 | 0.1131 |
| 284098 | PIGW | P10T-E | Human | Esophagus | ESCC | 5.83e-06 | 9.07e-02 | 0.116 |
| 284098 | PIGW | P12T-E | Human | Esophagus | ESCC | 2.43e-11 | 2.36e-01 | 0.1122 |
| 284098 | PIGW | P16T-E | Human | Esophagus | ESCC | 1.64e-14 | 1.15e-01 | 0.1153 |
| 284098 | PIGW | P20T-E | Human | Esophagus | ESCC | 2.02e-06 | 8.18e-02 | 0.1124 |
| 284098 | PIGW | P21T-E | Human | Esophagus | ESCC | 1.71e-09 | 2.19e-01 | 0.1617 |
| 284098 | PIGW | P23T-E | Human | Esophagus | ESCC | 8.32e-13 | 2.85e-01 | 0.108 |
| 284098 | PIGW | P24T-E | Human | Esophagus | ESCC | 4.76e-04 | 9.38e-02 | 0.1287 |
| 284098 | PIGW | P26T-E | Human | Esophagus | ESCC | 7.09e-06 | 9.75e-02 | 0.1276 |
| 284098 | PIGW | P27T-E | Human | Esophagus | ESCC | 1.42e-14 | 1.69e-01 | 0.1055 |
| 284098 | PIGW | P28T-E | Human | Esophagus | ESCC | 1.73e-04 | 6.91e-02 | 0.1149 |
| 284098 | PIGW | P30T-E | Human | Esophagus | ESCC | 1.32e-05 | 1.50e-01 | 0.137 |
| 284098 | PIGW | P31T-E | Human | Esophagus | ESCC | 1.32e-10 | 1.72e-01 | 0.1251 |
| 284098 | PIGW | P32T-E | Human | Esophagus | ESCC | 2.42e-13 | 3.09e-01 | 0.1666 |
| 284098 | PIGW | P36T-E | Human | Esophagus | ESCC | 5.78e-03 | 1.10e-01 | 0.1187 |
| Page: 1 2 3 |
| Tissue | Expression Dynamics | Abbreviation |
| Esophagus | 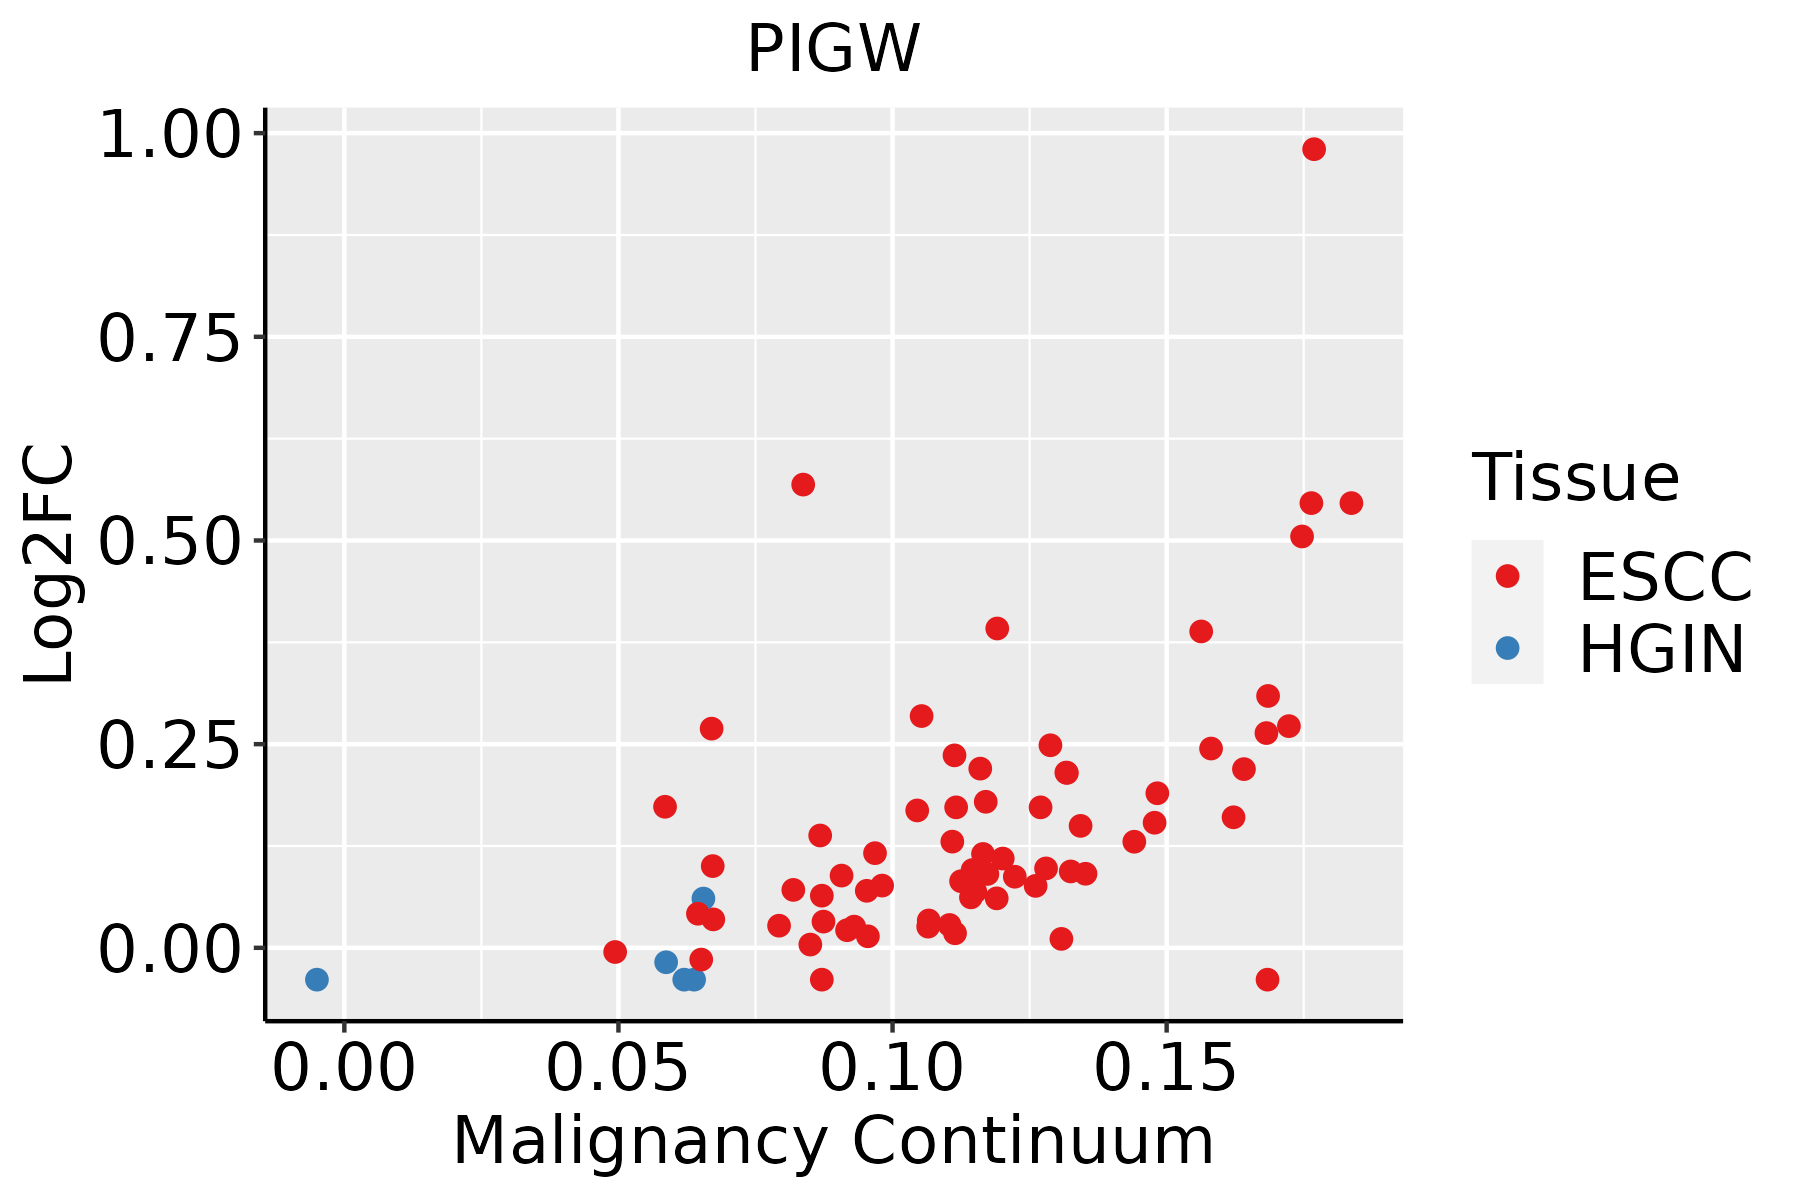 | ESCC: Esophageal squamous cell carcinoma |
| HGIN: High-grade intraepithelial neoplasias | ||
| LGIN: Low-grade intraepithelial neoplasias |
| ∗log2FC in expression of this searched gene in stem-like cells from each diseased tissue sample relative to stem-like cells in normal samples in each tissue plotted against the malignancy continuum. Samples are colored based on if they are from different disease stage. |
Top |
Malignant transformation related pathway analysis |
| Find out the enriched GO biological processes and KEGG pathways involved in transition from healthy to precancer to cancer |
| Tissue | Disease Stage | Enriched GO biological Processes |
| Colorectum | AD |  |
| Colorectum | SER |  |
| Colorectum | MSS |  |
| Colorectum | MSI-H |  |
| Colorectum | FAP |  |
| ∗Top 15 enriched GO BP terms are showed in the bar plot of each disease state in each tissue. Each row represents a significant GO biological process which is colored according to the -log10(p.adjust). |
| Page: 1 2 3 4 5 6 7 8 9 |
| GO ID | Tissue | Disease Stage | Description | Gene Ratio | Bg Ratio | pvalue | p.adjust | Count |
| GO:0072659110 | Esophagus | ESCC | protein localization to plasma membrane | 193/8552 | 284/18723 | 1.95e-14 | 1.03e-12 | 193 |
| GO:199077819 | Esophagus | ESCC | protein localization to cell periphery | 217/8552 | 333/18723 | 4.08e-13 | 1.88e-11 | 217 |
| GO:00086544 | Esophagus | ESCC | phospholipid biosynthetic process | 162/8552 | 253/18723 | 2.59e-09 | 5.73e-08 | 162 |
| GO:00464744 | Esophagus | ESCC | glycerophospholipid biosynthetic process | 135/8552 | 211/18723 | 5.75e-08 | 1.02e-06 | 135 |
| GO:00066433 | Esophagus | ESCC | membrane lipid metabolic process | 130/8552 | 203/18723 | 9.29e-08 | 1.54e-06 | 130 |
| GO:00450175 | Esophagus | ESCC | glycerolipid biosynthetic process | 154/8552 | 252/18723 | 5.20e-07 | 6.96e-06 | 154 |
| GO:00066446 | Esophagus | ESCC | phospholipid metabolic process | 218/8552 | 383/18723 | 5.37e-06 | 5.59e-05 | 218 |
| GO:00464673 | Esophagus | ESCC | membrane lipid biosynthetic process | 91/8552 | 142/18723 | 7.19e-06 | 7.19e-05 | 91 |
| GO:00421573 | Esophagus | ESCC | lipoprotein metabolic process | 86/8552 | 135/18723 | 1.78e-05 | 1.57e-04 | 86 |
| GO:00064973 | Esophagus | ESCC | protein lipidation | 62/8552 | 92/18723 | 2.08e-05 | 1.80e-04 | 62 |
| GO:00421583 | Esophagus | ESCC | lipoprotein biosynthetic process | 64/8552 | 96/18723 | 2.61e-05 | 2.20e-04 | 64 |
| GO:00065063 | Esophagus | ESCC | GPI anchor biosynthetic process | 26/8552 | 32/18723 | 3.97e-05 | 3.21e-04 | 26 |
| GO:00066505 | Esophagus | ESCC | glycerophospholipid metabolic process | 174/8552 | 306/18723 | 4.92e-05 | 3.85e-04 | 174 |
| GO:00065053 | Esophagus | ESCC | GPI anchor metabolic process | 26/8552 | 33/18723 | 1.06e-04 | 7.43e-04 | 26 |
| GO:00066642 | Esophagus | ESCC | glycolipid metabolic process | 63/8552 | 100/18723 | 3.55e-04 | 2.06e-03 | 63 |
| GO:19035092 | Esophagus | ESCC | liposaccharide metabolic process | 63/8552 | 101/18723 | 5.25e-04 | 2.90e-03 | 63 |
| GO:00464864 | Esophagus | ESCC | glycerolipid metabolic process | 211/8552 | 392/18723 | 6.51e-04 | 3.46e-03 | 211 |
| GO:0009247 | Esophagus | ESCC | glycolipid biosynthetic process | 42/8552 | 68/18723 | 5.48e-03 | 2.05e-02 | 42 |
| GO:00066611 | Esophagus | ESCC | phosphatidylinositol biosynthetic process | 73/8552 | 131/18723 | 1.31e-02 | 4.28e-02 | 73 |
| Page: 1 |
| Pathway ID | Tissue | Disease Stage | Description | Gene Ratio | Bg Ratio | pvalue | p.adjust | qvalue | Count |
| Page: 1 |
Top |
Cell-cell communication analysis |
| Identification of potential cell-cell interactions between two cell types and their ligand-receptor pairs for different disease states |
| Ligand | Receptor | LRpair | Pathway | Tissue | Disease Stage |
| Page: 1 |
Top |
Single-cell gene regulatory network inference analysis |
| Find out the significant the regulons (TFs) and the target genes of each regulon across cell types for different disease states |
| TF | Cell Type | Tissue | Disease Stage | Target Gene | RSS | Regulon Activity |
| ∗The dot plots of a searched regulon are shown for all cell subpopulations in each disease state of each tissue based on the regulon specific score inferred using pySCENIC and by calculating the average expression. |
| Page: 1 |
Top |
Somatic mutation of malignant transformation related genes |
| Annotation of somatic variants for genes involved in malignant transformation |
| Hugo Symbol | Variant Class | Variant Classification | dbSNP RS | HGVSc | HGVSp | HGVSp Short | SWISSPROT | BIOTYPE | SIFT | PolyPhen | Tumor Sample Barcode | Tissue | Histology | Sex | Age | Stage | Therapy Types | Drugs | Outcome |
| PIGW | SNV | Missense_Mutation | novel | c.908N>T | p.Arg303Leu | p.R303L | Q7Z7B1 | protein_coding | deleterious(0) | probably_damaging(0.994) | TCGA-HU-8610-01 | Stomach | stomach adenocarcinoma | Male | >=65 | I/II | Unknown | Unknown | SD |
| PIGW | SNV | Missense_Mutation | novel | c.835N>G | p.Thr279Ala | p.T279A | Q7Z7B1 | protein_coding | tolerated(0.06) | benign(0.007) | TCGA-VQ-A8P2-01 | Stomach | stomach adenocarcinoma | Male | >=65 | III/IV | Unspecific | Complete Response |
| Page: 1 2 3 4 5 |
Top |
Related drugs of malignant transformation related genes |
| Identification of chemicals and drugs interact with genes involved in malignant transfromation |
| (DGIdb 4.0) |
| Entrez ID | Symbol | Category | Interaction Types | Drug Claim Name | Drug Name | PMIDs |
| Page: 1 |

Copyright 2023-Present -The University of Texas Health Science Center at Houston |