| Tissue | Expression Dynamics | Abbreviation |
| Colorectum (GSE201348) | 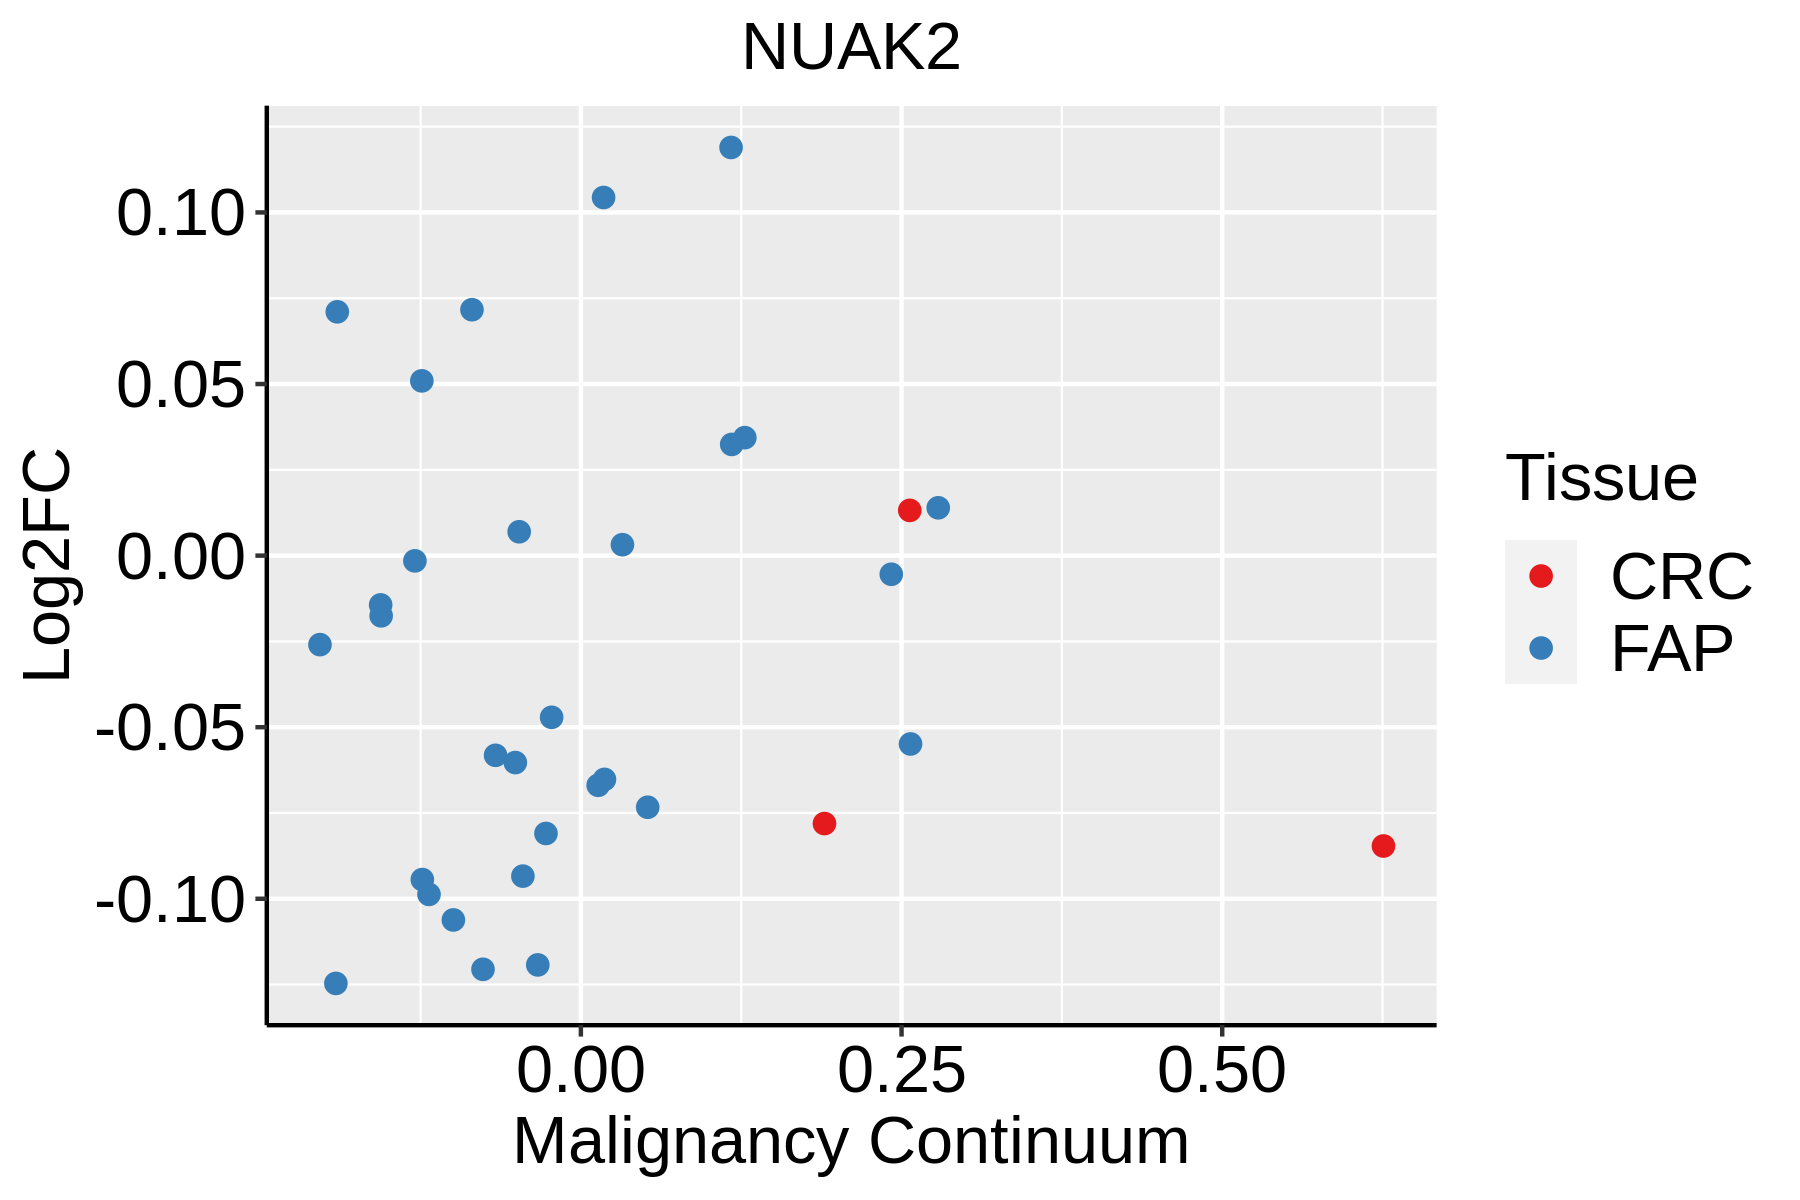 | FAP: Familial adenomatous polyposis |
| CRC: Colorectal cancer |
| Colorectum (HTA11) |  | AD: Adenomas |
| SER: Sessile serrated lesions |
| MSI-H: Microsatellite-high colorectal cancer |
| MSS: Microsatellite stable colorectal cancer |
| Esophagus | 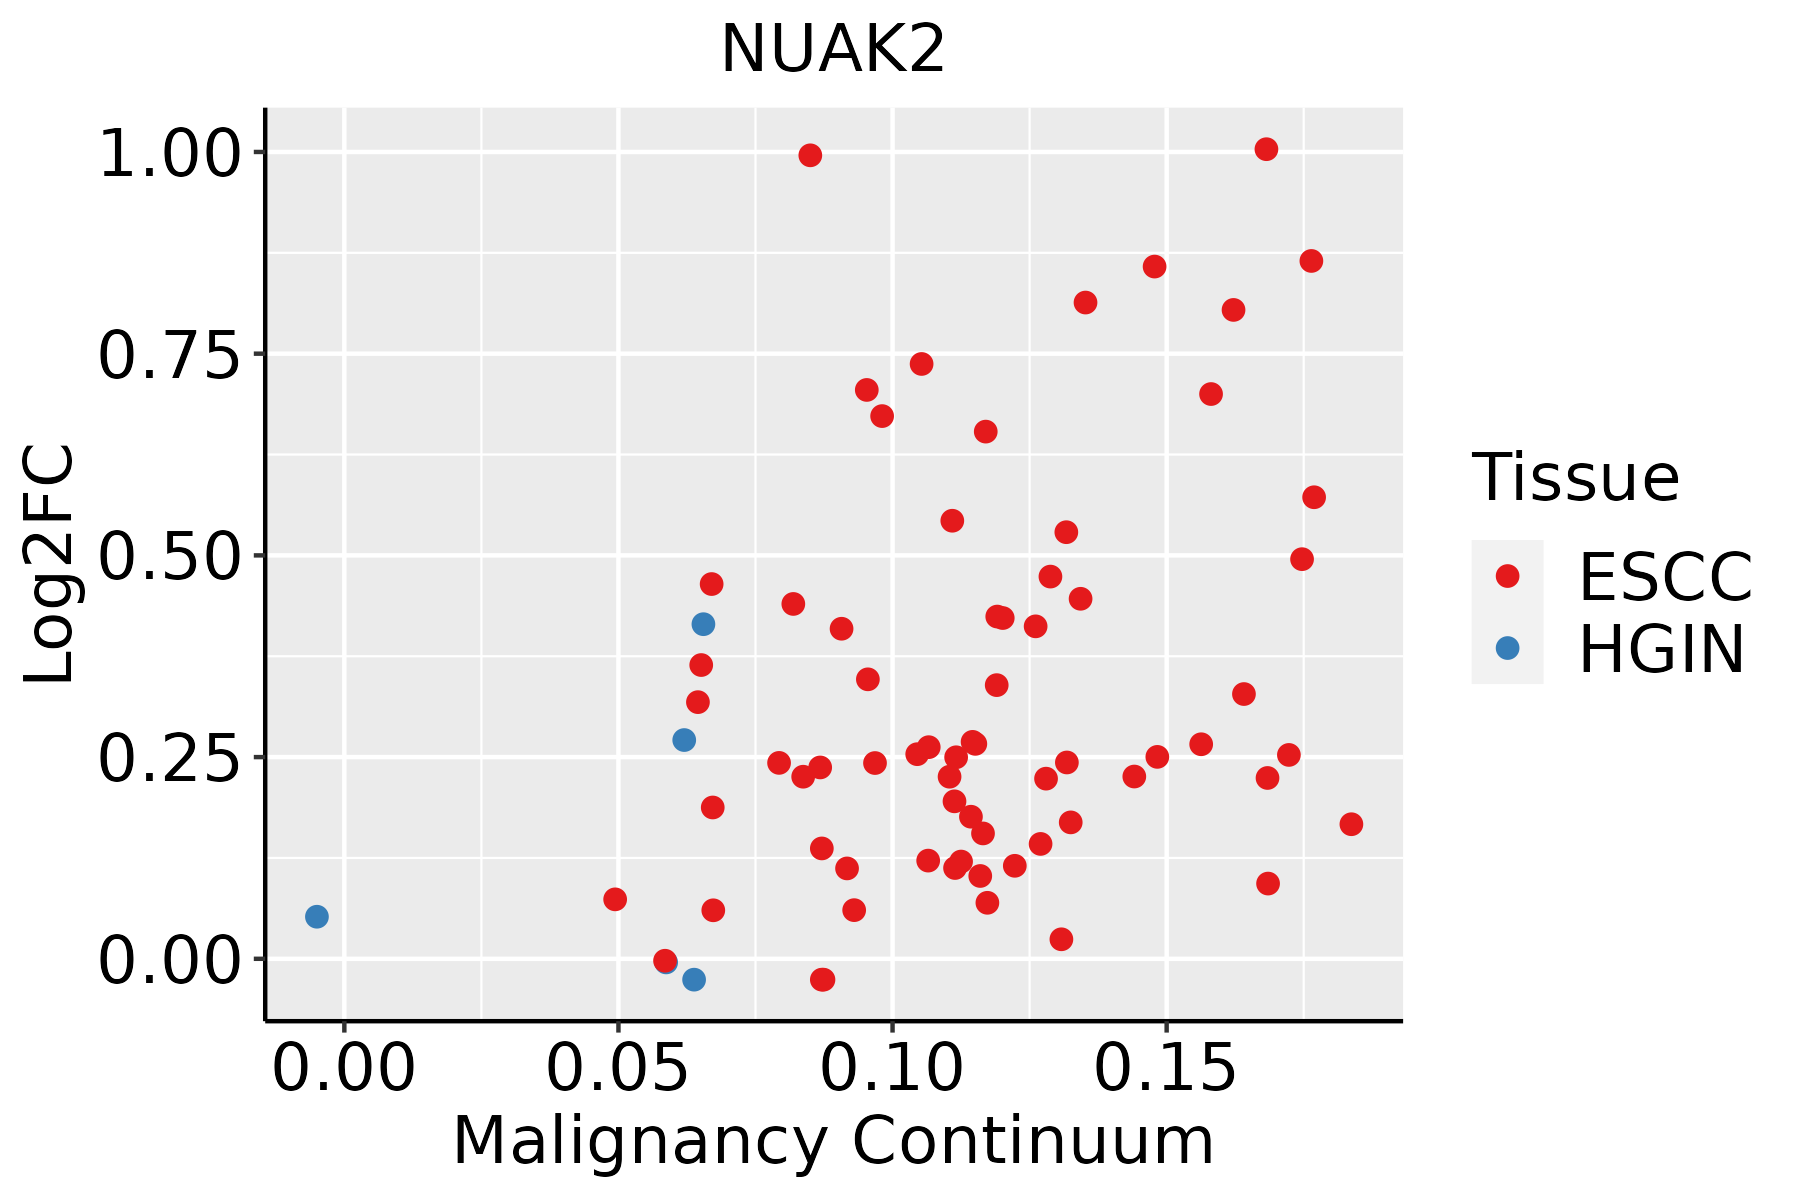 | ESCC: Esophageal squamous cell carcinoma |
| HGIN: High-grade intraepithelial neoplasias |
| LGIN: Low-grade intraepithelial neoplasias |
| Oral Cavity | 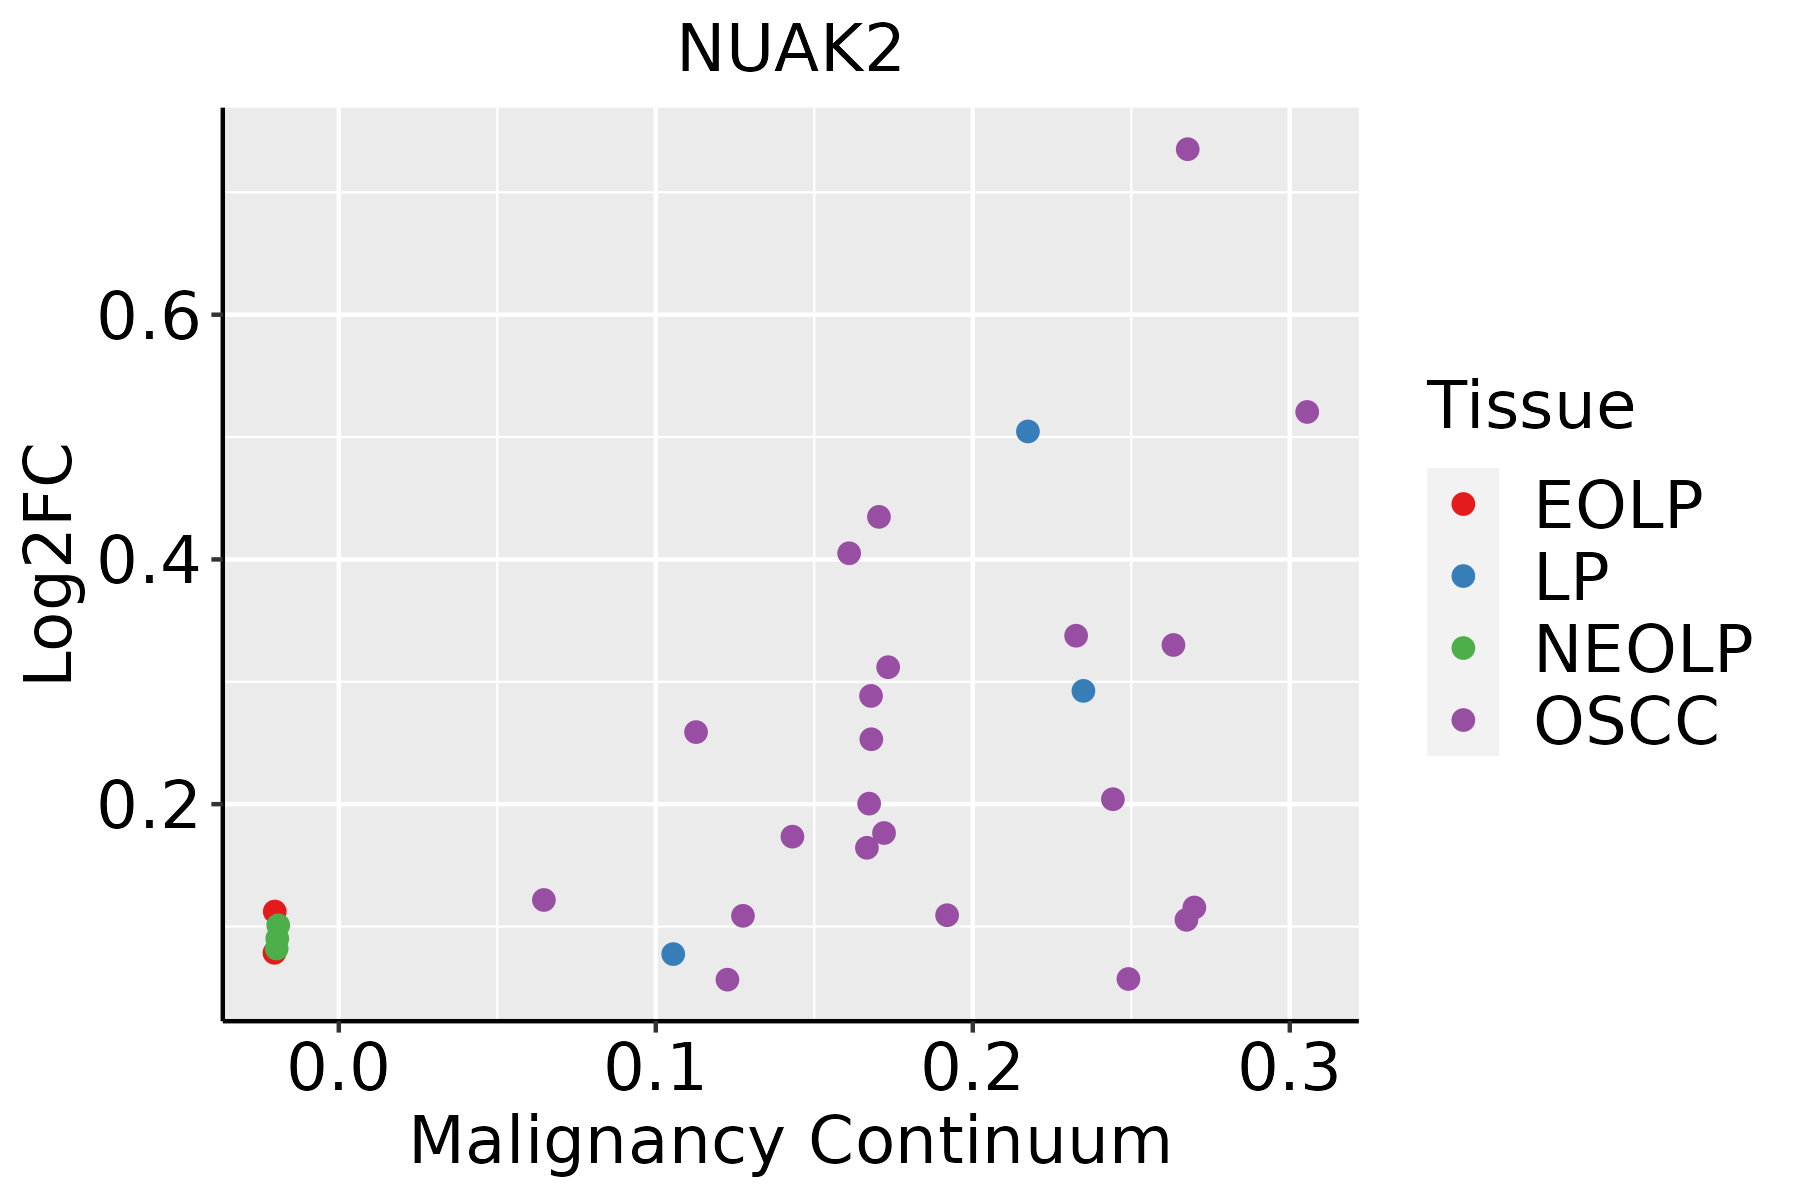 | EOLP: Erosive Oral lichen planus |
| LP: leukoplakia |
| NEOLP: Non-erosive oral lichen planus |
| OSCC: Oral squamous cell carcinoma |
| GO ID | Tissue | Disease Stage | Description | Gene Ratio | Bg Ratio | pvalue | p.adjust | Count |
| GO:0031667 | Colorectum | AD | response to nutrient levels | 138/3918 | 474/18723 | 1.22e-05 | 2.68e-04 | 138 |
| GO:0042594 | Colorectum | AD | response to starvation | 63/3918 | 197/18723 | 1.77e-04 | 2.38e-03 | 63 |
| GO:0071496 | Colorectum | AD | cellular response to external stimulus | 94/3918 | 320/18723 | 1.98e-04 | 2.64e-03 | 94 |
| GO:0009267 | Colorectum | AD | cellular response to starvation | 51/3918 | 156/18723 | 3.90e-04 | 4.44e-03 | 51 |
| GO:0031668 | Colorectum | AD | cellular response to extracellular stimulus | 71/3918 | 246/18723 | 1.86e-03 | 1.52e-02 | 71 |
| GO:0031669 | Colorectum | AD | cellular response to nutrient levels | 63/3918 | 215/18723 | 2.19e-03 | 1.73e-02 | 63 |
| GO:0071496111 | Esophagus | ESCC | cellular response to external stimulus | 215/8552 | 320/18723 | 4.29e-15 | 2.43e-13 | 215 |
| GO:0031668111 | Esophagus | ESCC | cellular response to extracellular stimulus | 168/8552 | 246/18723 | 4.93e-13 | 2.23e-11 | 168 |
| GO:0031669110 | Esophagus | ESCC | cellular response to nutrient levels | 148/8552 | 215/18723 | 4.58e-12 | 1.76e-10 | 148 |
| GO:0031667111 | Esophagus | ESCC | response to nutrient levels | 289/8552 | 474/18723 | 9.25e-12 | 3.47e-10 | 289 |
| GO:0009267110 | Esophagus | ESCC | cellular response to starvation | 110/8552 | 156/18723 | 2.63e-10 | 7.37e-09 | 110 |
| GO:004259419 | Esophagus | ESCC | response to starvation | 133/8552 | 197/18723 | 4.31e-10 | 1.14e-08 | 133 |
| GO:00421492 | Esophagus | ESCC | cellular response to glucose starvation | 36/8552 | 48/18723 | 3.43e-05 | 2.80e-04 | 36 |
| GO:007149620 | Oral cavity | OSCC | cellular response to external stimulus | 186/7305 | 320/18723 | 2.56e-12 | 1.05e-10 | 186 |
| GO:003166819 | Oral cavity | OSCC | cellular response to extracellular stimulus | 141/7305 | 246/18723 | 3.99e-09 | 8.95e-08 | 141 |
| GO:003166720 | Oral cavity | OSCC | response to nutrient levels | 245/7305 | 474/18723 | 1.02e-08 | 2.10e-07 | 245 |
| GO:003166918 | Oral cavity | OSCC | cellular response to nutrient levels | 121/7305 | 215/18723 | 1.96e-07 | 3.17e-06 | 121 |
| GO:004259416 | Oral cavity | OSCC | response to starvation | 111/7305 | 197/18723 | 5.68e-07 | 8.19e-06 | 111 |
| GO:000926717 | Oral cavity | OSCC | cellular response to starvation | 91/7305 | 156/18723 | 7.55e-07 | 1.06e-05 | 91 |
| TF | Cell Type | Tissue | Disease Stage | Target Gene | RSS | Regulon Activity |
| NUAK2 | GRA | Oral cavity | ADJ | TGM1,EVPL,ANXA1, etc. | 2.46e-01 |  |
| NUAK2 | COR | Oral cavity | LP | TGM1,EVPL,ANXA1, etc. | 2.21e-01 |  |
| NUAK2 | GRA | Oral cavity | LP | TGM1,EVPL,ANXA1, etc. | 2.46e-01 | |
| NUAK2 | COR | Oral cavity | OSCC | TGM1,EVPL,ANXA1, etc. | 3.81e-01 |  |
| NUAK2 | ECC | Skin | AK | LGALSL,CALML5,SLURP1, etc. | 4.91e-02 |  |
| NUAK2 | PIL | Skin | SCCIS | LGALSL,CALML5,SLURP1, etc. | 1.34e-02 |  |
| NUAK2 | cDC | Skin | ADJ | BIRC3,CCR7,MARCKSL1, etc. | 1.51e-01 |  |
| NUAK2 | PLA | Skin | ADJ | BIRC3,CCR7,MARCKSL1, etc. | 1.36e-02 | |
| NUAK2 | cDC | Skin | AK | BIRC3,CCR7,MARCKSL1, etc. | 1.44e-01 | |
| NUAK2 | PLA | Skin | AK | BIRC3,CCR7,MARCKSL1, etc. | 2.49e-02 | |
| Hugo Symbol | Variant Class | Variant Classification | dbSNP RS | HGVSc | HGVSp | HGVSp Short | SWISSPROT | BIOTYPE | SIFT | PolyPhen | Tumor Sample Barcode | Tissue | Histology | Sex | Age | Stage | Therapy Types | Drugs | Outcome |
| NUAK2 | SNV | Missense_Mutation | novel | c.109G>T | p.Ala37Ser | p.A37S | Q9H093 | protein_coding | tolerated_low_confidence(0.29) | benign(0.003) | TCGA-22-A5C4-01 | Lung | lung squamous cell carcinoma | Male | >=65 | I/II | Unknown | Unknown | SD |
| NUAK2 | SNV | Missense_Mutation | novel | c.161C>T | p.Ser54Phe | p.S54F | Q9H093 | protein_coding | deleterious_low_confidence(0.03) | benign(0.021) | TCGA-63-A5MH-01 | Lung | lung squamous cell carcinoma | Male | >=65 | I/II | Unknown | Unknown | SD |
| NUAK2 | SNV | Missense_Mutation | | c.1736G>C | p.Arg579Pro | p.R579P | Q9H093 | protein_coding | tolerated(0.15) | benign(0.001) | TCGA-66-2783-01 | Lung | lung squamous cell carcinoma | Male | >=65 | III/IV | Chemotherapy | cisplatin | CR |
| NUAK2 | SNV | Missense_Mutation | novel | c.1787A>T | p.Glu596Val | p.E596V | Q9H093 | protein_coding | deleterious(0) | probably_damaging(0.997) | TCGA-BA-6872-01 | Oral cavity | head & neck squamous cell carcinoma | Male | <65 | I/II | Unspecific | | PD |
| NUAK2 | SNV | Missense_Mutation | novel | c.1786G>A | p.Glu596Lys | p.E596K | Q9H093 | protein_coding | deleterious(0.01) | probably_damaging(0.994) | TCGA-BA-6872-01 | Oral cavity | head & neck squamous cell carcinoma | Male | <65 | I/II | Unspecific | | PD |
| NUAK2 | SNV | Missense_Mutation | | c.320N>T | p.Thr107Ile | p.T107I | Q9H093 | protein_coding | deleterious(0) | probably_damaging(0.999) | TCGA-CQ-6229-01 | Oral cavity | head & neck squamous cell carcinoma | Male | <65 | I/II | Unknown | Unknown | SD |
| NUAK2 | SNV | Missense_Mutation | novel | c.978G>T | p.Trp326Cys | p.W326C | Q9H093 | protein_coding | deleterious(0) | probably_damaging(1) | TCGA-CV-6956-01 | Oral cavity | head & neck squamous cell carcinoma | Male | >=65 | III/IV | Unknown | Unknown | PD |
| NUAK2 | SNV | Missense_Mutation | novel | c.348N>C | p.Glu116Asp | p.E116D | Q9H093 | protein_coding | tolerated(0.08) | benign(0.084) | TCGA-CV-7099-01 | Oral cavity | head & neck squamous cell carcinoma | Female | >=65 | I/II | Unknown | Unknown | SD |
| NUAK2 | SNV | Missense_Mutation | rs376539362 | c.1770C>A | p.Asp590Glu | p.D590E | Q9H093 | protein_coding | tolerated(0.08) | benign(0.232) | TCGA-IQ-A61G-01 | Oral cavity | head & neck squamous cell carcinoma | Male | <65 | I/II | Chemotherapy | cisplatin | PD |
| NUAK2 | SNV | Missense_Mutation | novel | c.722N>G | p.Ser241Cys | p.S241C | Q9H093 | protein_coding | deleterious(0.01) | probably_damaging(0.997) | TCGA-T2-A6X2-01 | Oral cavity | head & neck squamous cell carcinoma | Male | >=65 | III/IV | Unknown | Unknown | SD |


