
|
|||||
|
 | |
| |
| |
| |
| |
| |
|
Gene: NFIL3 |
Gene summary for NFIL3 |
| Gene information | Species | Human | Gene symbol | NFIL3 | Gene ID | 4783 |
| Gene name | nuclear factor, interleukin 3 regulated | |
| Gene Alias | E4BP4 | |
| Cytomap | 9q22.31 | |
| Gene Type | protein-coding | GO ID | GO:0000122 | UniProtAcc | A0A024R241 |
Top |
Malignant transformation analysis |
| Identification of the aberrant gene expression in precancerous and cancerous lesions by comparing the gene expression of stem-like cells in diseased tissues with normal stem cells |
| Entrez ID | Symbol | Replicates | Species | Organ | Tissue | Adj P-value | Log2FC | Malignancy |
| 4783 | NFIL3 | S43 | Human | Liver | Cirrhotic | 9.65e-05 | -1.20e-01 | -0.0187 |
| 4783 | NFIL3 | HCC1_Meng | Human | Liver | HCC | 4.40e-34 | -4.30e-02 | 0.0246 |
| 4783 | NFIL3 | HCC2_Meng | Human | Liver | HCC | 5.25e-03 | -1.30e-01 | 0.0107 |
| 4783 | NFIL3 | HCC2 | Human | Liver | HCC | 2.16e-09 | 3.31e+00 | 0.5341 |
| 4783 | NFIL3 | S028 | Human | Liver | HCC | 2.16e-02 | 3.31e-01 | 0.2503 |
| 4783 | NFIL3 | S029 | Human | Liver | HCC | 8.93e-08 | 5.75e-01 | 0.2581 |
| 4783 | NFIL3 | GSM5252132_BPH389PrGF | Human | Prostate | BPH | 1.75e-10 | 6.30e-01 | -0.2247 |
| 4783 | NFIL3 | GSM5252133_BPH389PrSF | Human | Prostate | BPH | 1.89e-03 | 6.80e-01 | -0.2027 |
| 4783 | NFIL3 | GSM5252134_BPH511PrG_Fcol_3GEX | Human | Prostate | BPH | 2.73e-11 | 5.38e-01 | -0.1433 |
| 4783 | NFIL3 | GSM5252135_BPH511PrPUr_Fcol_3GEX | Human | Prostate | BPH | 1.60e-21 | 6.31e-01 | -0.1833 |
| 4783 | NFIL3 | GSM5252136_BPH556PrGA1_Fcol | Human | Prostate | BPH | 6.09e-27 | 6.42e-01 | -0.23 |
| 4783 | NFIL3 | GSM5252137_BPH556PrGA2_Fcol | Human | Prostate | BPH | 8.34e-32 | 9.06e-01 | -0.23 |
| 4783 | NFIL3 | 047563_1562-all-cells | Human | Prostate | BPH | 9.11e-09 | 4.77e-01 | 0.0791 |
| 4783 | NFIL3 | 048752_1579-all-cells | Human | Prostate | BPH | 1.47e-15 | 3.79e-01 | 0.1008 |
| 4783 | NFIL3 | 052095_1628-all-cells | Human | Prostate | BPH | 1.05e-11 | 3.38e-01 | 0.1032 |
| 4783 | NFIL3 | 052097_1595-all-cells | Human | Prostate | BPH | 4.24e-09 | 2.98e-01 | 0.0972 |
| 4783 | NFIL3 | 052099_1652-all-cells | Human | Prostate | BPH | 4.97e-06 | 1.85e-01 | 0.1038 |
| 4783 | NFIL3 | Dong_P1 | Human | Prostate | Tumor | 3.73e-17 | 1.71e-01 | 0.035 |
| 4783 | NFIL3 | Dong_P3 | Human | Prostate | Tumor | 4.50e-10 | 1.09e-01 | 0.0278 |
| 4783 | NFIL3 | Dong_P4 | Human | Prostate | Tumor | 4.35e-03 | 9.35e-02 | 0.0292 |
| Page: 1 2 |
| Tissue | Expression Dynamics | Abbreviation |
| Liver | 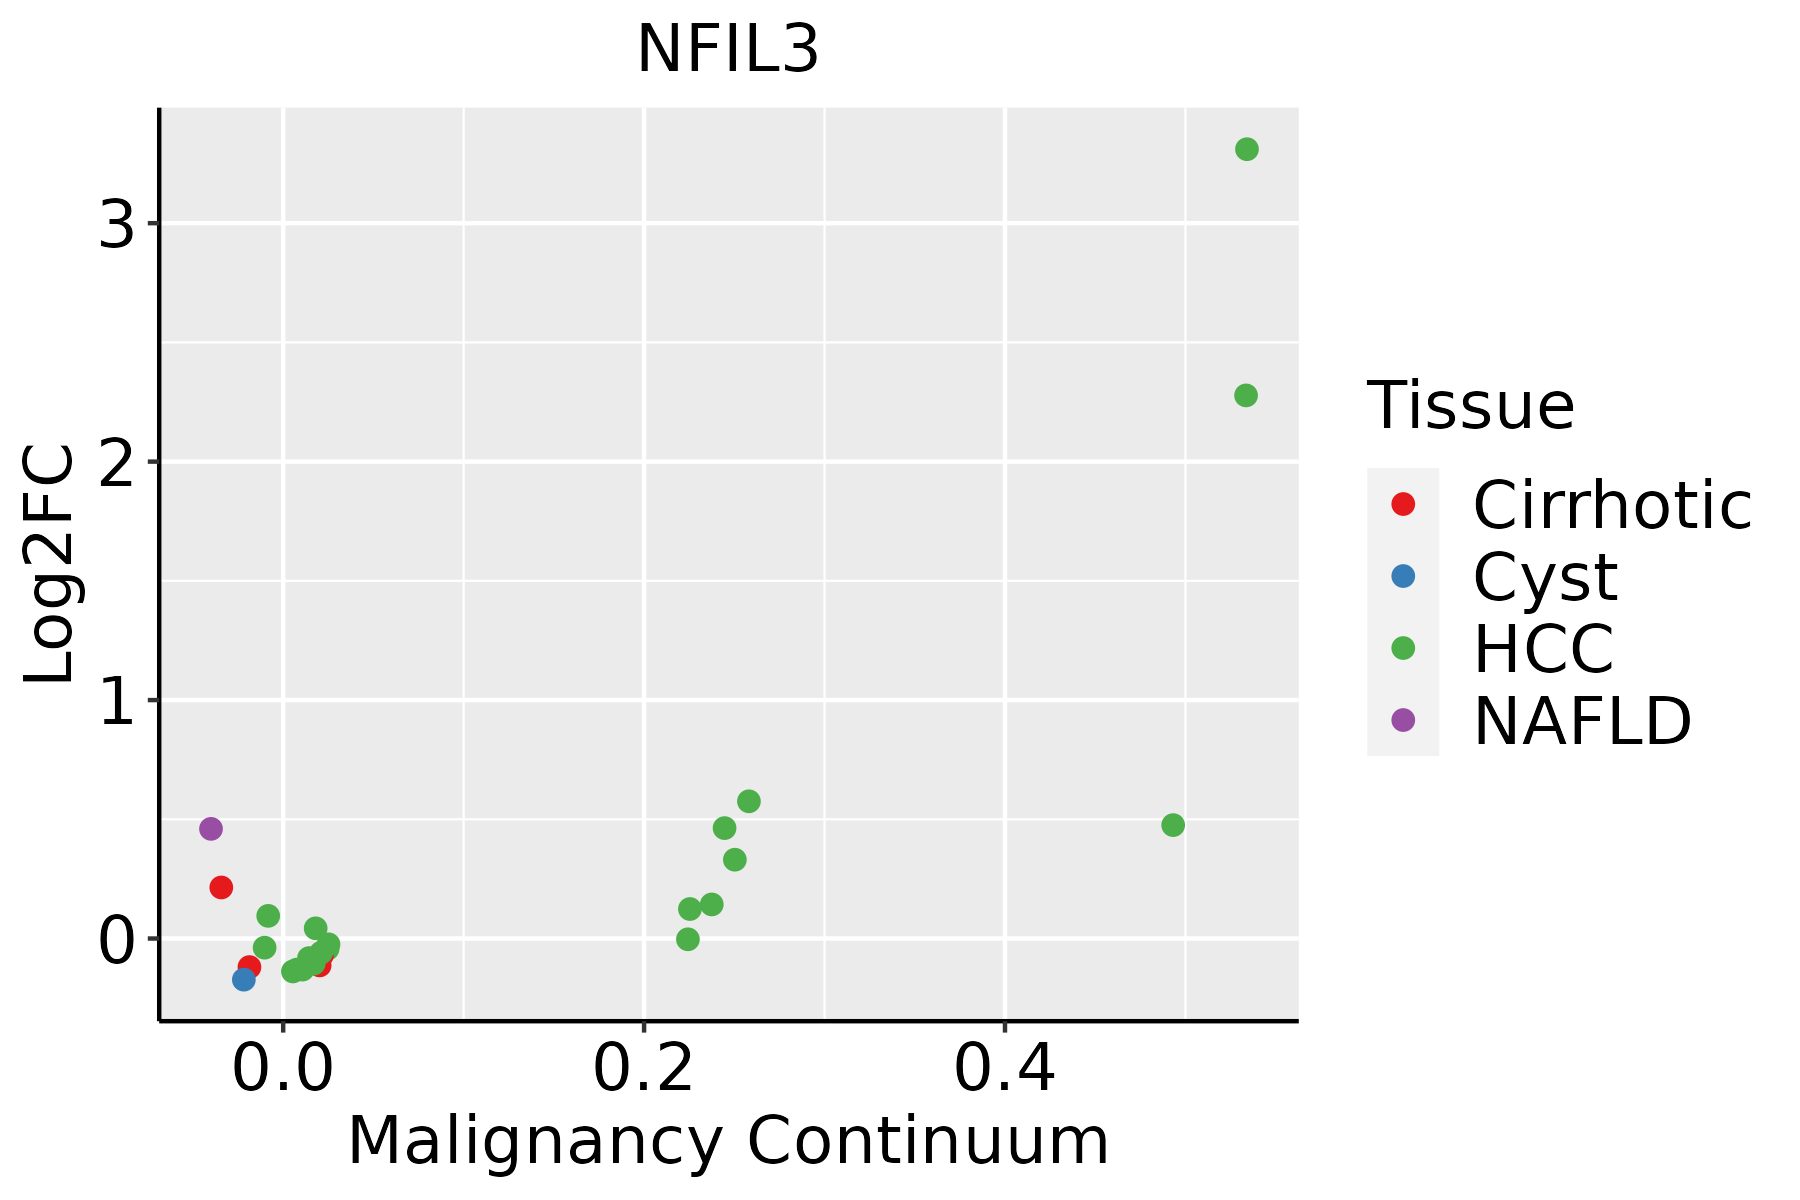 | HCC: Hepatocellular carcinoma |
| NAFLD: Non-alcoholic fatty liver disease | ||
| Prostate | 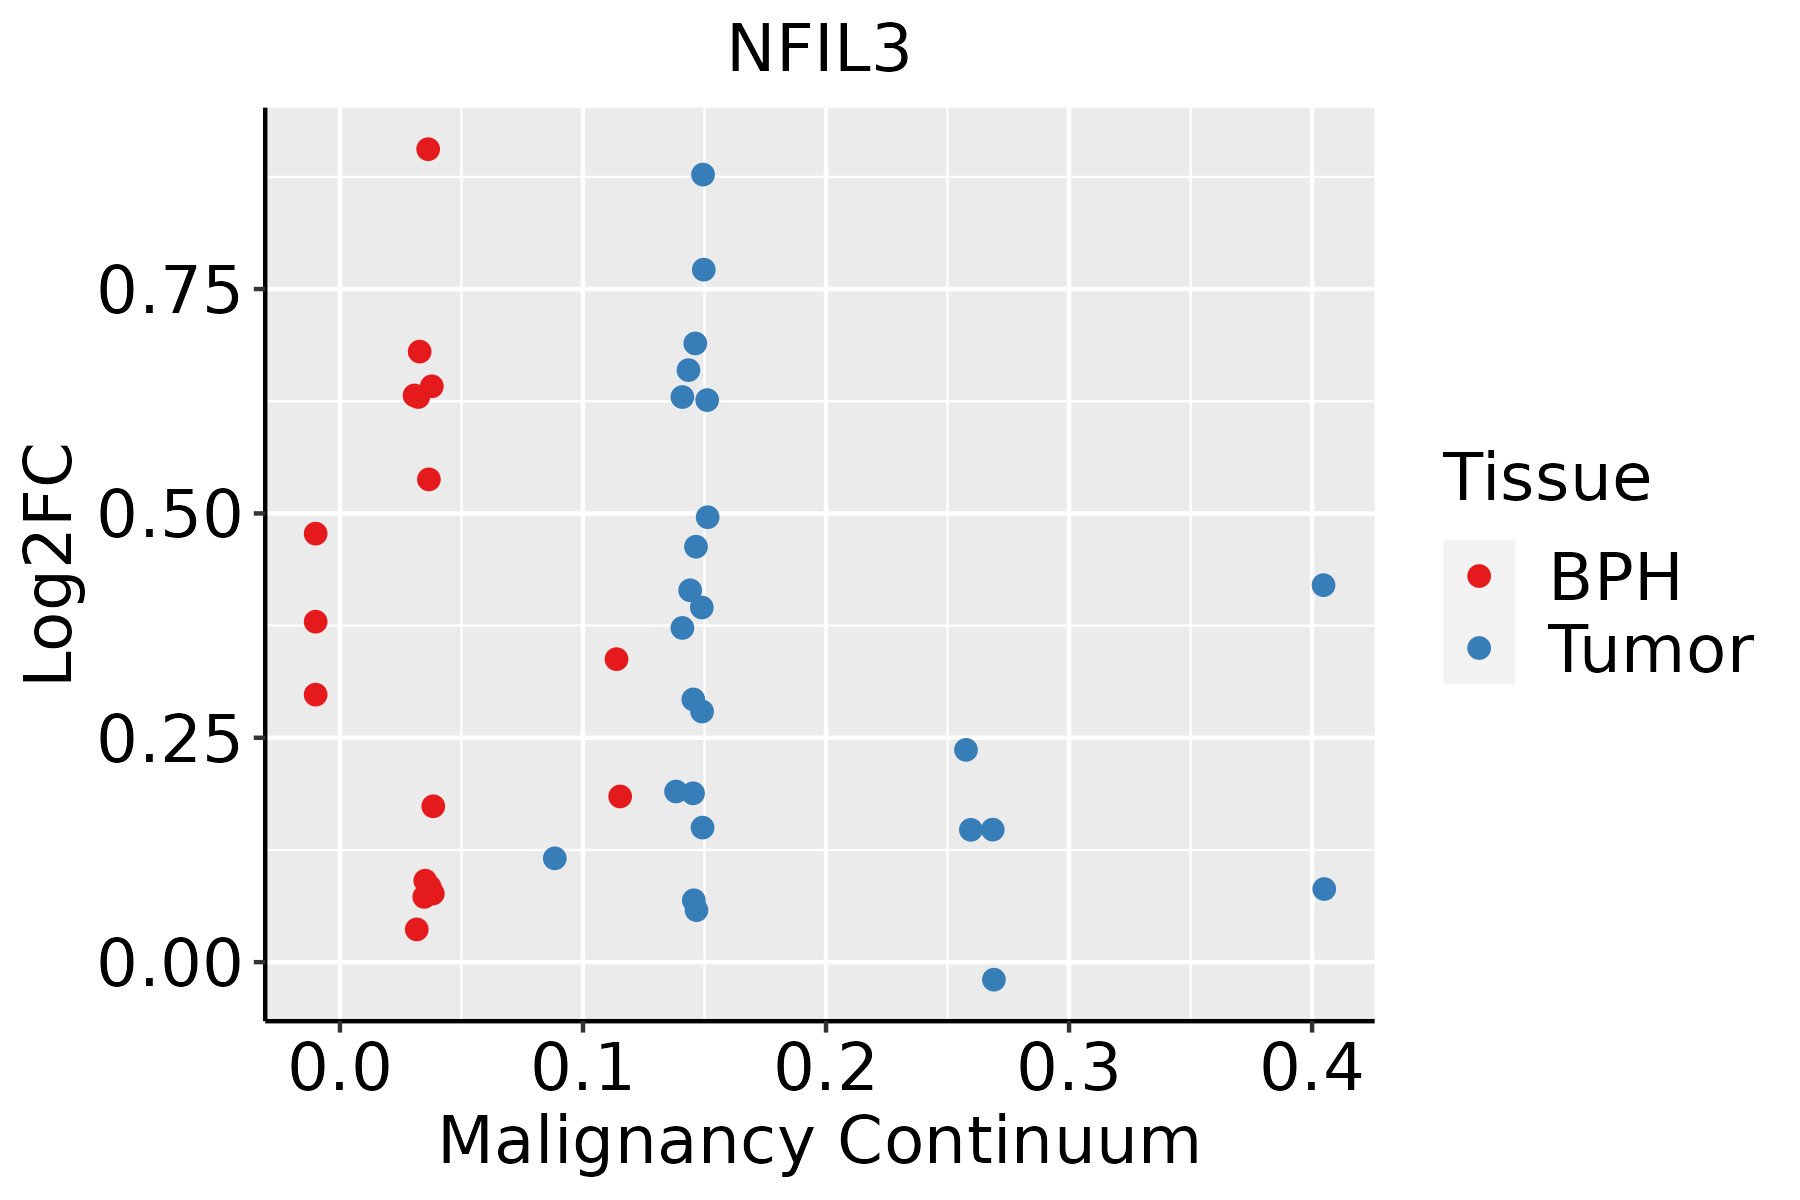 | BPH: Benign Prostatic Hyperplasia |
| ∗log2FC in expression of this searched gene in stem-like cells from each diseased tissue sample relative to stem-like cells in normal samples in each tissue plotted against the malignancy continuum. Samples are colored based on if they are from different disease stage. |
Top |
Malignant transformation related pathway analysis |
| Find out the enriched GO biological processes and KEGG pathways involved in transition from healthy to precancer to cancer |
| Tissue | Disease Stage | Enriched GO biological Processes |
| Colorectum | AD |  |
| Colorectum | SER |  |
| Colorectum | MSS |  |
| Colorectum | MSI-H |  |
| Colorectum | FAP |  |
| ∗Top 15 enriched GO BP terms are showed in the bar plot of each disease state in each tissue. Each row represents a significant GO biological process which is colored according to the -log10(p.adjust). |
| Page: 1 2 3 4 5 6 7 8 9 |
| GO ID | Tissue | Disease Stage | Description | Gene Ratio | Bg Ratio | pvalue | p.adjust | Count |
| GO:000762312 | Liver | Cirrhotic | circadian rhythm | 84/4634 | 210/18723 | 7.04e-07 | 1.50e-05 | 84 |
| GO:004851111 | Liver | Cirrhotic | rhythmic process | 103/4634 | 298/18723 | 8.47e-05 | 9.19e-04 | 103 |
| GO:00713532 | Liver | Cirrhotic | cellular response to interleukin-4 | 17/4634 | 33/18723 | 8.32e-04 | 6.06e-03 | 17 |
| GO:00706702 | Liver | Cirrhotic | response to interleukin-4 | 17/4634 | 36/18723 | 2.82e-03 | 1.63e-02 | 17 |
| GO:000762321 | Liver | HCC | circadian rhythm | 117/7958 | 210/18723 | 7.29e-05 | 6.54e-04 | 117 |
| GO:004851121 | Liver | HCC | rhythmic process | 156/7958 | 298/18723 | 3.54e-04 | 2.46e-03 | 156 |
| GO:007135311 | Liver | HCC | cellular response to interleukin-4 | 21/7958 | 33/18723 | 1.16e-02 | 4.28e-02 | 21 |
| GO:004851110 | Prostate | BPH | rhythmic process | 96/3107 | 298/18723 | 1.88e-11 | 1.31e-09 | 96 |
| GO:000762310 | Prostate | BPH | circadian rhythm | 73/3107 | 210/18723 | 1.02e-10 | 6.02e-09 | 73 |
| GO:19031315 | Prostate | BPH | mononuclear cell differentiation | 98/3107 | 426/18723 | 3.43e-04 | 2.55e-03 | 98 |
| GO:00300982 | Prostate | BPH | lymphocyte differentiation | 83/3107 | 374/18723 | 2.76e-03 | 1.46e-02 | 83 |
| GO:00713534 | Prostate | BPH | cellular response to interleukin-4 | 12/3107 | 33/18723 | 4.90e-03 | 2.32e-02 | 12 |
| GO:00706704 | Prostate | BPH | response to interleukin-4 | 12/3107 | 36/18723 | 1.07e-02 | 4.45e-02 | 12 |
| GO:004851115 | Prostate | Tumor | rhythmic process | 99/3246 | 298/18723 | 1.65e-11 | 1.21e-09 | 99 |
| GO:000762315 | Prostate | Tumor | circadian rhythm | 75/3246 | 210/18723 | 1.09e-10 | 6.79e-09 | 75 |
| GO:190313113 | Prostate | Tumor | mononuclear cell differentiation | 102/3246 | 426/18723 | 2.87e-04 | 2.32e-03 | 102 |
| GO:003009811 | Prostate | Tumor | lymphocyte differentiation | 87/3246 | 374/18723 | 1.93e-03 | 1.12e-02 | 87 |
| GO:007135312 | Prostate | Tumor | cellular response to interleukin-4 | 13/3246 | 33/18723 | 2.26e-03 | 1.28e-02 | 13 |
| GO:007067011 | Prostate | Tumor | response to interleukin-4 | 13/3246 | 36/18723 | 5.47e-03 | 2.60e-02 | 13 |
| Page: 1 |
| Pathway ID | Tissue | Disease Stage | Description | Gene Ratio | Bg Ratio | pvalue | p.adjust | qvalue | Count |
| hsa047104 | Prostate | BPH | Circadian rhythm | 15/1718 | 34/8465 | 1.40e-03 | 5.85e-03 | 3.62e-03 | 15 |
| hsa0471011 | Prostate | BPH | Circadian rhythm | 15/1718 | 34/8465 | 1.40e-03 | 5.85e-03 | 3.62e-03 | 15 |
| hsa0471021 | Prostate | Tumor | Circadian rhythm | 14/1791 | 34/8465 | 6.44e-03 | 2.16e-02 | 1.34e-02 | 14 |
| hsa0471031 | Prostate | Tumor | Circadian rhythm | 14/1791 | 34/8465 | 6.44e-03 | 2.16e-02 | 1.34e-02 | 14 |
| Page: 1 |
Top |
Cell-cell communication analysis |
| Identification of potential cell-cell interactions between two cell types and their ligand-receptor pairs for different disease states |
| Ligand | Receptor | LRpair | Pathway | Tissue | Disease Stage |
| Page: 1 |
Top |
Single-cell gene regulatory network inference analysis |
| Find out the significant the regulons (TFs) and the target genes of each regulon across cell types for different disease states |
| TF | Cell Type | Tissue | Disease Stage | Target Gene | RSS | Regulon Activity |
| NFIL3 | MON | Colorectum | MSS | EXT1,ZNF322,DHX34, etc. | 5.09e-01 |  |
| NFIL3 | INMON | Lung | AAH | CYCS,CFP,FCN1, etc. | 8.95e-02 |  |
| NFIL3 | INMON | Lung | ADJ | VCAN,S100A8,S100A12, etc. | 2.37e-01 |  |
| NFIL3 | LC | Lung | ADJ | VCAN,S100A8,S100A12, etc. | 2.09e-01 | |
| NFIL3 | LC | Lung | IAC | S100A9,S100A8,AQP9, etc. | 2.90e-01 |  |
| NFIL3 | INMON | Lung | IAC | S100A9,S100A8,AQP9, etc. | 5.40e-02 | |
| NFIL3 | NEUT | Lung | IAC | S100A9,S100A8,AQP9, etc. | 4.74e-02 | |
| NFIL3 | M1MAC | Lung | IAC | S100A9,S100A8,AQP9, etc. | 1.63e-01 | |
| NFIL3 | MVA | Lung | Healthy | EAF1,ETV5,EREG, etc. | 7.49e-02 |  |
| NFIL3 | ACINAR | Pancreas | PDAC | VCAN,RRP12,NAMPT, etc. | 2.25e-01 |  |
| ∗The dot plots of a searched regulon are shown for all cell subpopulations in each disease state of each tissue based on the regulon specific score inferred using pySCENIC and by calculating the average expression. |
| Page: 1 2 |
Top |
Somatic mutation of malignant transformation related genes |
| Annotation of somatic variants for genes involved in malignant transformation |
| Hugo Symbol | Variant Class | Variant Classification | dbSNP RS | HGVSc | HGVSp | HGVSp Short | SWISSPROT | BIOTYPE | SIFT | PolyPhen | Tumor Sample Barcode | Tissue | Histology | Sex | Age | Stage | Therapy Types | Drugs | Outcome |
| NFIL3 | SNV | Missense_Mutation | c.89N>A | p.Ser30Tyr | p.S30Y | Q16649 | protein_coding | deleterious(0.03) | benign(0.254) | TCGA-BS-A0UF-01 | Endometrium | uterine corpus endometrioid carcinoma | Female | >=65 | I/II | Unknown | Unknown | SD | |
| NFIL3 | SNV | Missense_Mutation | rs368413458 | c.337G>A | p.Ala113Thr | p.A113T | Q16649 | protein_coding | tolerated(0.05) | possibly_damaging(0.557) | TCGA-BS-A0UV-01 | Endometrium | uterine corpus endometrioid carcinoma | Female | <65 | III/IV | Unknown | Unknown | SD |
| NFIL3 | SNV | Missense_Mutation | c.272N>A | p.Arg91His | p.R91H | Q16649 | protein_coding | deleterious(0) | probably_damaging(1) | TCGA-D1-A167-01 | Endometrium | uterine corpus endometrioid carcinoma | Female | >=65 | I/II | Unknown | Unknown | SD | |
| NFIL3 | SNV | Missense_Mutation | c.1034T>C | p.Phe345Ser | p.F345S | Q16649 | protein_coding | deleterious(0) | possibly_damaging(0.503) | TCGA-D1-A17Q-01 | Endometrium | uterine corpus endometrioid carcinoma | Female | <65 | I/II | Unknown | Unknown | SD | |
| NFIL3 | SNV | Missense_Mutation | novel | c.511N>A | p.Val171Met | p.V171M | Q16649 | protein_coding | tolerated(0.26) | benign(0.034) | TCGA-DF-A2KN-01 | Endometrium | uterine corpus endometrioid carcinoma | Female | Unknown | I/II | Unknown | Unknown | SD |
| NFIL3 | SNV | Missense_Mutation | novel | c.338N>T | p.Ala113Val | p.A113V | Q16649 | protein_coding | tolerated(0.07) | benign(0.326) | TCGA-DI-A1BU-01 | Endometrium | uterine corpus endometrioid carcinoma | Female | <65 | I/II | Chemotherapy | paclitaxel | SD |
| NFIL3 | SNV | Missense_Mutation | rs774904912 | c.67N>T | p.Asp23Tyr | p.D23Y | Q16649 | protein_coding | deleterious(0) | possibly_damaging(0.751) | TCGA-E6-A1LX-01 | Endometrium | uterine corpus endometrioid carcinoma | Female | <65 | I/II | Unknown | Unknown | SD |
| NFIL3 | SNV | Missense_Mutation | novel | c.1072A>G | p.Thr358Ala | p.T358A | Q16649 | protein_coding | tolerated(0.18) | benign(0) | TCGA-EO-A22R-01 | Endometrium | uterine corpus endometrioid carcinoma | Female | <65 | I/II | Unknown | Unknown | SD |
| NFIL3 | SNV | Missense_Mutation | novel | c.284G>A | p.Arg95Gln | p.R95Q | Q16649 | protein_coding | deleterious(0) | probably_damaging(1) | TCGA-EO-A22R-01 | Endometrium | uterine corpus endometrioid carcinoma | Female | <65 | I/II | Unknown | Unknown | SD |
| NFIL3 | SNV | Missense_Mutation | novel | c.40N>A | p.Ala14Thr | p.A14T | Q16649 | protein_coding | tolerated(0.58) | benign(0.154) | TCGA-SJ-A6ZI-01 | Endometrium | uterine corpus endometrioid carcinoma | Female | <65 | I/II | Unknown | Unknown | SD |
| Page: 1 2 3 4 5 6 7 |
Top |
Related drugs of malignant transformation related genes |
| Identification of chemicals and drugs interact with genes involved in malignant transfromation |
| (DGIdb 4.0) |
| Entrez ID | Symbol | Category | Interaction Types | Drug Claim Name | Drug Name | PMIDs |
| Page: 1 |

Copyright 2023-Present -The University of Texas Health Science Center at Houston |