
|
|||||
|
 | |
| |
| |
| |
| |
| |
|
Gene: MS4A1 |
Gene summary for MS4A1 |
| Gene information | Species | Human | Gene symbol | MS4A1 | Gene ID | 931 |
| Gene name | membrane spanning 4-domains A1 | |
| Gene Alias | B1 | |
| Cytomap | 11q12.2 | |
| Gene Type | protein-coding | GO ID | GO:0001775 | UniProtAcc | A0A024R507 |
Top |
Malignant transformation analysis |
| Identification of the aberrant gene expression in precancerous and cancerous lesions by comparing the gene expression of stem-like cells in diseased tissues with normal stem cells |
| Entrez ID | Symbol | Replicates | Species | Organ | Tissue | Adj P-value | Log2FC | Malignancy |
| 931 | MS4A1 | Adj_PTCwithHT_6 | Human | Thyroid | HT | 3.72e-25 | 1.03e+00 | 0.02 |
| 931 | MS4A1 | PTCwithHT_6 | Human | Thyroid | HT | 1.77e-07 | 5.12e-01 | 0.02 |
| Page: 1 |
| Tissue | Expression Dynamics | Abbreviation |
| Thyroid | 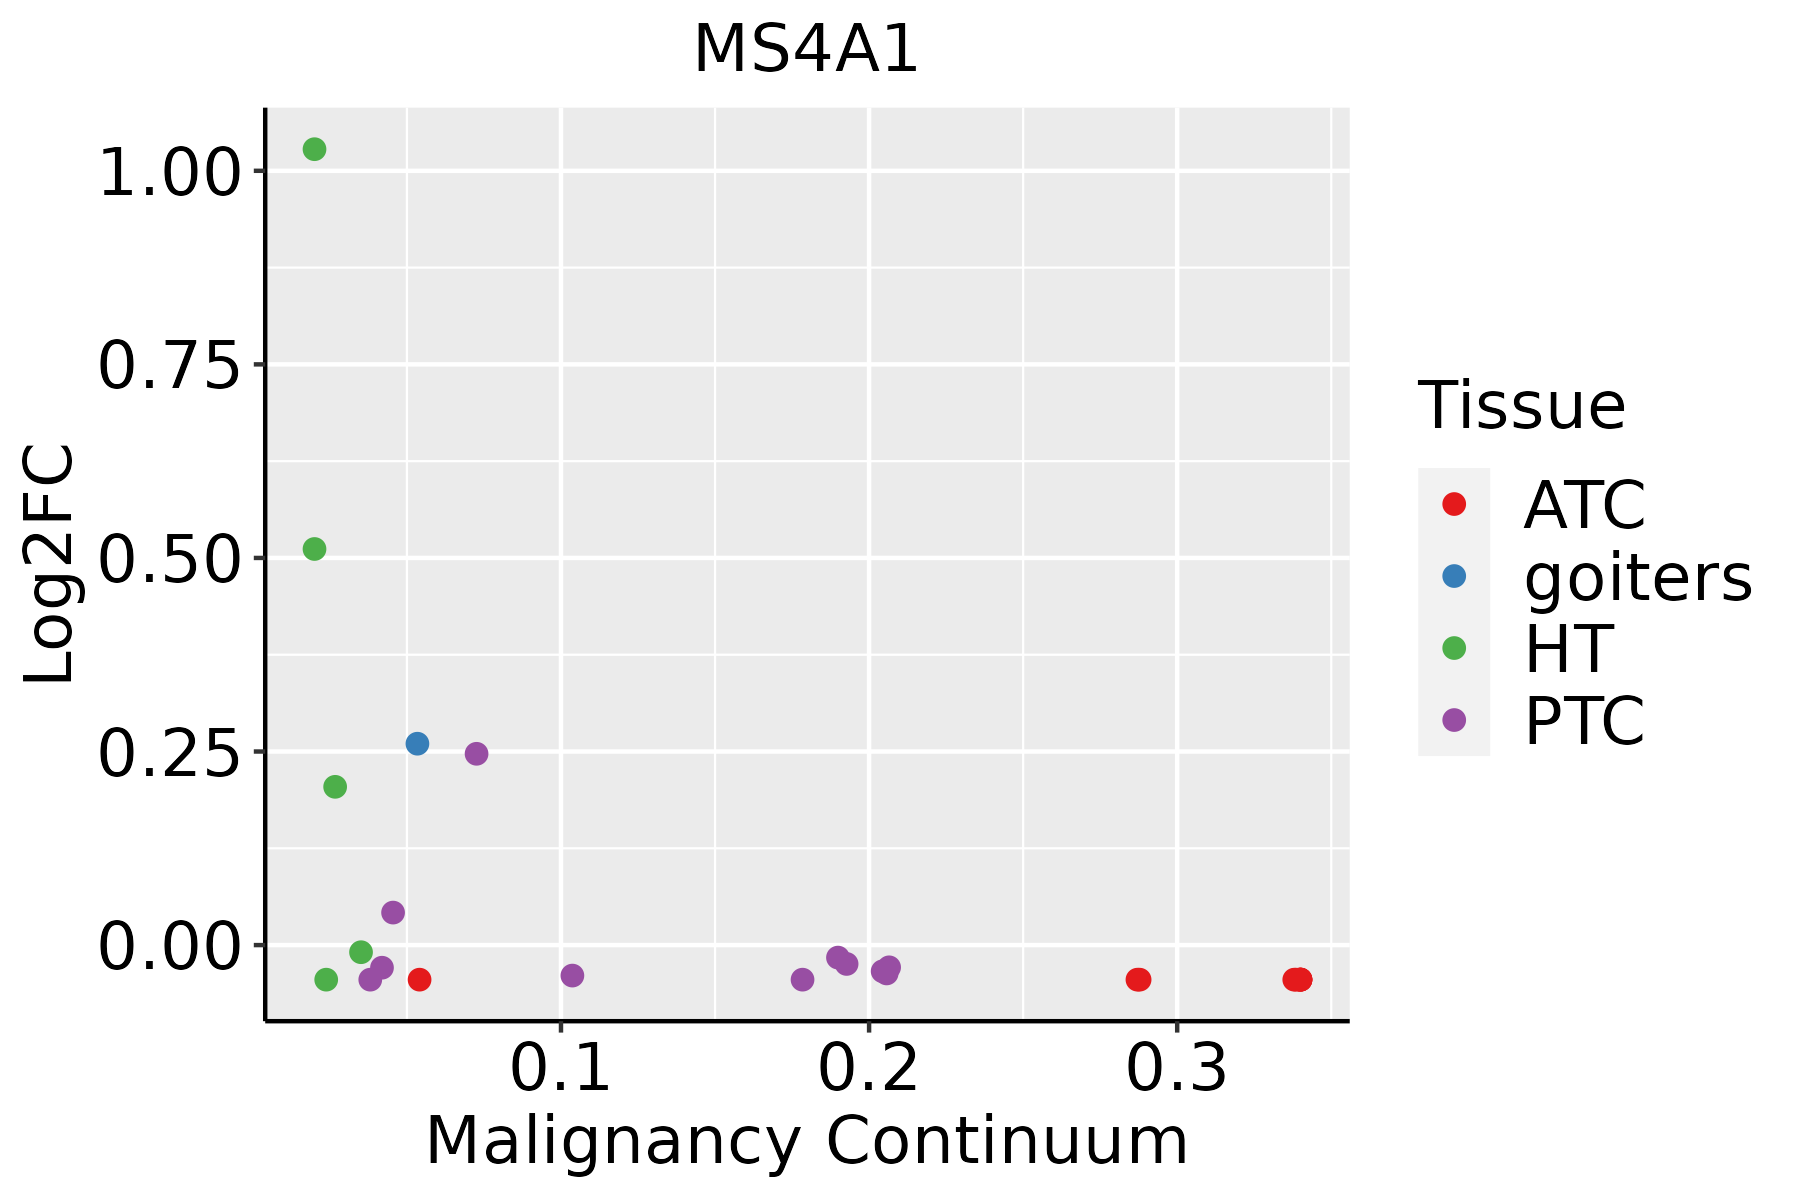 | ATC: Anaplastic thyroid cancer |
| HT: Hashimoto's thyroiditis | ||
| PTC: Papillary thyroid cancer |
| ∗log2FC in expression of this searched gene in stem-like cells from each diseased tissue sample relative to stem-like cells in normal samples in each tissue plotted against the malignancy continuum. Samples are colored based on if they are from different disease stage. |
Top |
Malignant transformation related pathway analysis |
| Find out the enriched GO biological processes and KEGG pathways involved in transition from healthy to precancer to cancer |
| Tissue | Disease Stage | Enriched GO biological Processes |
| Colorectum | AD |  |
| Colorectum | SER |  |
| Colorectum | MSS |  |
| Colorectum | MSI-H |  |
| Colorectum | FAP |  |
| ∗Top 15 enriched GO BP terms are showed in the bar plot of each disease state in each tissue. Each row represents a significant GO biological process which is colored according to the -log10(p.adjust). |
| Page: 1 2 3 4 5 6 7 8 9 |
| GO ID | Tissue | Disease Stage | Description | Gene Ratio | Bg Ratio | pvalue | p.adjust | Count |
| GO:007066110 | Thyroid | HT | leukocyte proliferation | 44/1272 | 318/18723 | 5.29e-06 | 1.64e-04 | 44 |
| GO:19031319 | Thyroid | HT | mononuclear cell differentiation | 54/1272 | 426/18723 | 6.88e-06 | 2.00e-04 | 54 |
| GO:00466519 | Thyroid | HT | lymphocyte proliferation | 40/1272 | 288/18723 | 1.27e-05 | 3.30e-04 | 40 |
| GO:00329438 | Thyroid | HT | mononuclear cell proliferation | 40/1272 | 291/18723 | 1.63e-05 | 3.95e-04 | 40 |
| GO:00300986 | Thyroid | HT | lymphocyte differentiation | 47/1272 | 374/18723 | 3.32e-05 | 7.02e-04 | 47 |
| GO:00022536 | Thyroid | HT | activation of immune response | 47/1272 | 375/18723 | 3.55e-05 | 7.40e-04 | 47 |
| GO:00069598 | Thyroid | HT | humoral immune response | 40/1272 | 317/18723 | 1.14e-04 | 1.86e-03 | 40 |
| GO:00421133 | Thyroid | HT | B cell activation | 39/1272 | 334/18723 | 6.66e-04 | 7.61e-03 | 39 |
| GO:00027648 | Thyroid | HT | immune response-regulating signaling pathway | 50/1272 | 468/18723 | 9.96e-04 | 1.02e-02 | 50 |
| GO:00508515 | Thyroid | HT | antigen receptor-mediated signaling pathway | 27/1272 | 240/18723 | 6.87e-03 | 4.20e-02 | 27 |
| GO:00024293 | Thyroid | HT | immune response-activating cell surface receptor signaling pathway | 31/1272 | 291/18723 | 8.69e-03 | 4.92e-02 | 31 |
| GO:00027573 | Thyroid | HT | immune response-activating signal transduction | 31/1272 | 291/18723 | 8.69e-03 | 4.92e-02 | 31 |
| Page: 1 |
| Pathway ID | Tissue | Disease Stage | Description | Gene Ratio | Bg Ratio | pvalue | p.adjust | qvalue | Count |
| Page: 1 |
Top |
Cell-cell communication analysis |
| Identification of potential cell-cell interactions between two cell types and their ligand-receptor pairs for different disease states |
| Ligand | Receptor | LRpair | Pathway | Tissue | Disease Stage |
| Page: 1 |
Top |
Single-cell gene regulatory network inference analysis |
| Find out the significant the regulons (TFs) and the target genes of each regulon across cell types for different disease states |
| TF | Cell Type | Tissue | Disease Stage | Target Gene | RSS | Regulon Activity |
| ∗The dot plots of a searched regulon are shown for all cell subpopulations in each disease state of each tissue based on the regulon specific score inferred using pySCENIC and by calculating the average expression. |
| Page: 1 |
Top |
Somatic mutation of malignant transformation related genes |
| Annotation of somatic variants for genes involved in malignant transformation |
| Hugo Symbol | Variant Class | Variant Classification | dbSNP RS | HGVSc | HGVSp | HGVSp Short | SWISSPROT | BIOTYPE | SIFT | PolyPhen | Tumor Sample Barcode | Tissue | Histology | Sex | Age | Stage | Therapy Types | Drugs | Outcome |
| MS4A1 | SNV | Missense_Mutation | novel | c.244G>T | p.Val82Leu | p.V82L | P11836 | protein_coding | tolerated(0.19) | benign(0.015) | TCGA-O2-A52Q-01 | Lung | lung squamous cell carcinoma | Female | <65 | III/IV | Unknown | Unknown | PD |
| MS4A1 | SNV | Missense_Mutation | novel | c.224G>A | p.Gly75Glu | p.G75E | P11836 | protein_coding | tolerated(0.76) | benign(0.027) | TCGA-D6-6516-01 | Oral cavity | head & neck squamous cell carcinoma | Male | >=65 | I/II | Unknown | Unknown | SD |
| MS4A1 | SNV | Missense_Mutation | novel | c.433N>A | p.His145Asn | p.H145N | P11836 | protein_coding | tolerated(0.18) | benign(0.045) | TCGA-QK-A8Z8-01 | Oral cavity | head & neck squamous cell carcinoma | Female | <65 | I/II | Chemotherapy | docetaxel | PD |
| MS4A1 | SNV | Missense_Mutation | c.646N>A | p.Trp216Arg | p.W216R | P11836 | protein_coding | deleterious(0) | probably_damaging(1) | TCGA-UF-A71D-01 | Oral cavity | head & neck squamous cell carcinoma | Female | <65 | I/II | Unknown | Unknown | SD | |
| MS4A1 | SNV | Missense_Mutation | c.256N>C | p.Tyr86His | p.Y86H | P11836 | protein_coding | deleterious(0) | probably_damaging(0.999) | TCGA-BR-7851-01 | Stomach | stomach adenocarcinoma | Male | >=65 | I/II | Unknown | Unknown | SD | |
| MS4A1 | SNV | Missense_Mutation | novel | c.452G>T | p.Ser151Ile | p.S151I | P11836 | protein_coding | deleterious(0.03) | possibly_damaging(0.69) | TCGA-HJ-7597-01 | Stomach | stomach adenocarcinoma | Female | >=65 | I/II | Chemotherapy | fluorouracil | CR |
| Page: 1 2 3 4 5 |
Top |
Related drugs of malignant transformation related genes |
| Identification of chemicals and drugs interact with genes involved in malignant transfromation |
| (DGIdb 4.0) |
| Entrez ID | Symbol | Category | Interaction Types | Drug Claim Name | Drug Name | PMIDs |
| 931 | MS4A1 | CLINICALLY ACTIONABLE, EXTERNAL SIDE OF PLASMA MEMBRANE, CELL SURFACE, DRUGGABLE GENOME | CAR-T cells targeting CD20 | |||
| 931 | MS4A1 | CLINICALLY ACTIONABLE, EXTERNAL SIDE OF PLASMA MEMBRANE, CELL SURFACE, DRUGGABLE GENOME | Obinutuzumab | OBINUTUZUMAB | ||
| 931 | MS4A1 | CLINICALLY ACTIONABLE, EXTERNAL SIDE OF PLASMA MEMBRANE, CELL SURFACE, DRUGGABLE GENOME | Rituximab | RITUXIMAB | ||
| 931 | MS4A1 | CLINICALLY ACTIONABLE, EXTERNAL SIDE OF PLASMA MEMBRANE, CELL SURFACE, DRUGGABLE GENOME | Ofatumumab | OFATUMUMAB | ||
| 931 | MS4A1 | CLINICALLY ACTIONABLE, EXTERNAL SIDE OF PLASMA MEMBRANE, CELL SURFACE, DRUGGABLE GENOME | Iodine-131-tositumomab | |||
| 931 | MS4A1 | CLINICALLY ACTIONABLE, EXTERNAL SIDE OF PLASMA MEMBRANE, CELL SURFACE, DRUGGABLE GENOME | FBT-A05 | FBT-A05 | ||
| 931 | MS4A1 | CLINICALLY ACTIONABLE, EXTERNAL SIDE OF PLASMA MEMBRANE, CELL SURFACE, DRUGGABLE GENOME | ANTI-CD20 (HA20) MONOCLONAL ANTIBODY | |||
| 931 | MS4A1 | CLINICALLY ACTIONABLE, EXTERNAL SIDE OF PLASMA MEMBRANE, CELL SURFACE, DRUGGABLE GENOME | CD20Bi aATC | 23529012 | ||
| 931 | MS4A1 | CLINICALLY ACTIONABLE, EXTERNAL SIDE OF PLASMA MEMBRANE, CELL SURFACE, DRUGGABLE GENOME | Ocrelizumab | OCRELIZUMAB | ||
| 931 | MS4A1 | CLINICALLY ACTIONABLE, EXTERNAL SIDE OF PLASMA MEMBRANE, CELL SURFACE, DRUGGABLE GENOME | antibody | 178103523 | OBINUTUZUMAB |
| Page: 1 2 3 4 5 6 7 8 9 |

Copyright 2023-Present -The University of Texas Health Science Center at Houston |