
|
|||||
|
 | |
| |
| |
| |
| |
| |
|
Gene: MRAP2 |
Gene summary for MRAP2 |
| Gene information | Species | Human | Gene symbol | MRAP2 | Gene ID | 112609 |
| Gene name | melanocortin 2 receptor accessory protein 2 | |
| Gene Alias | C6orf117 | |
| Cytomap | 6q14.2 | |
| Gene Type | protein-coding | GO ID | GO:0006091 | UniProtAcc | Q96G30 |
Top |
Malignant transformation analysis |
| Identification of the aberrant gene expression in precancerous and cancerous lesions by comparing the gene expression of stem-like cells in diseased tissues with normal stem cells |
| Entrez ID | Symbol | Replicates | Species | Organ | Tissue | Adj P-value | Log2FC | Malignancy |
| 112609 | MRAP2 | P2T-E | Human | Esophagus | ESCC | 1.22e-08 | 1.68e-01 | 0.1177 |
| 112609 | MRAP2 | P4T-E | Human | Esophagus | ESCC | 3.41e-12 | 3.36e-01 | 0.1323 |
| 112609 | MRAP2 | P9T-E | Human | Esophagus | ESCC | 7.92e-12 | 2.74e-01 | 0.1131 |
| 112609 | MRAP2 | P10T-E | Human | Esophagus | ESCC | 1.15e-10 | 3.20e-01 | 0.116 |
| 112609 | MRAP2 | P15T-E | Human | Esophagus | ESCC | 1.83e-08 | 2.80e-01 | 0.1149 |
| 112609 | MRAP2 | P20T-E | Human | Esophagus | ESCC | 3.11e-02 | 1.18e-01 | 0.1124 |
| 112609 | MRAP2 | P22T-E | Human | Esophagus | ESCC | 1.32e-05 | 1.31e-01 | 0.1236 |
| 112609 | MRAP2 | P23T-E | Human | Esophagus | ESCC | 1.84e-03 | 1.47e-01 | 0.108 |
| 112609 | MRAP2 | P27T-E | Human | Esophagus | ESCC | 8.14e-09 | 1.82e-01 | 0.1055 |
| 112609 | MRAP2 | P28T-E | Human | Esophagus | ESCC | 3.16e-14 | 3.21e-01 | 0.1149 |
| 112609 | MRAP2 | P30T-E | Human | Esophagus | ESCC | 8.40e-21 | 8.52e-01 | 0.137 |
| 112609 | MRAP2 | P31T-E | Human | Esophagus | ESCC | 2.28e-03 | 1.33e-01 | 0.1251 |
| 112609 | MRAP2 | P39T-E | Human | Esophagus | ESCC | 2.03e-12 | 2.53e-01 | 0.0894 |
| 112609 | MRAP2 | P42T-E | Human | Esophagus | ESCC | 4.97e-04 | 1.68e-01 | 0.1175 |
| 112609 | MRAP2 | P48T-E | Human | Esophagus | ESCC | 6.03e-09 | 2.29e-01 | 0.0959 |
| 112609 | MRAP2 | P52T-E | Human | Esophagus | ESCC | 1.24e-08 | 3.90e-01 | 0.1555 |
| 112609 | MRAP2 | P54T-E | Human | Esophagus | ESCC | 1.58e-02 | 1.27e-01 | 0.0975 |
| 112609 | MRAP2 | P65T-E | Human | Esophagus | ESCC | 8.90e-03 | 6.50e-02 | 0.0978 |
| 112609 | MRAP2 | P74T-E | Human | Esophagus | ESCC | 2.12e-02 | 9.90e-02 | 0.1479 |
| 112609 | MRAP2 | P128T-E | Human | Esophagus | ESCC | 1.28e-29 | 8.41e-01 | 0.1241 |
| Page: 1 2 |
| Tissue | Expression Dynamics | Abbreviation |
| Esophagus | 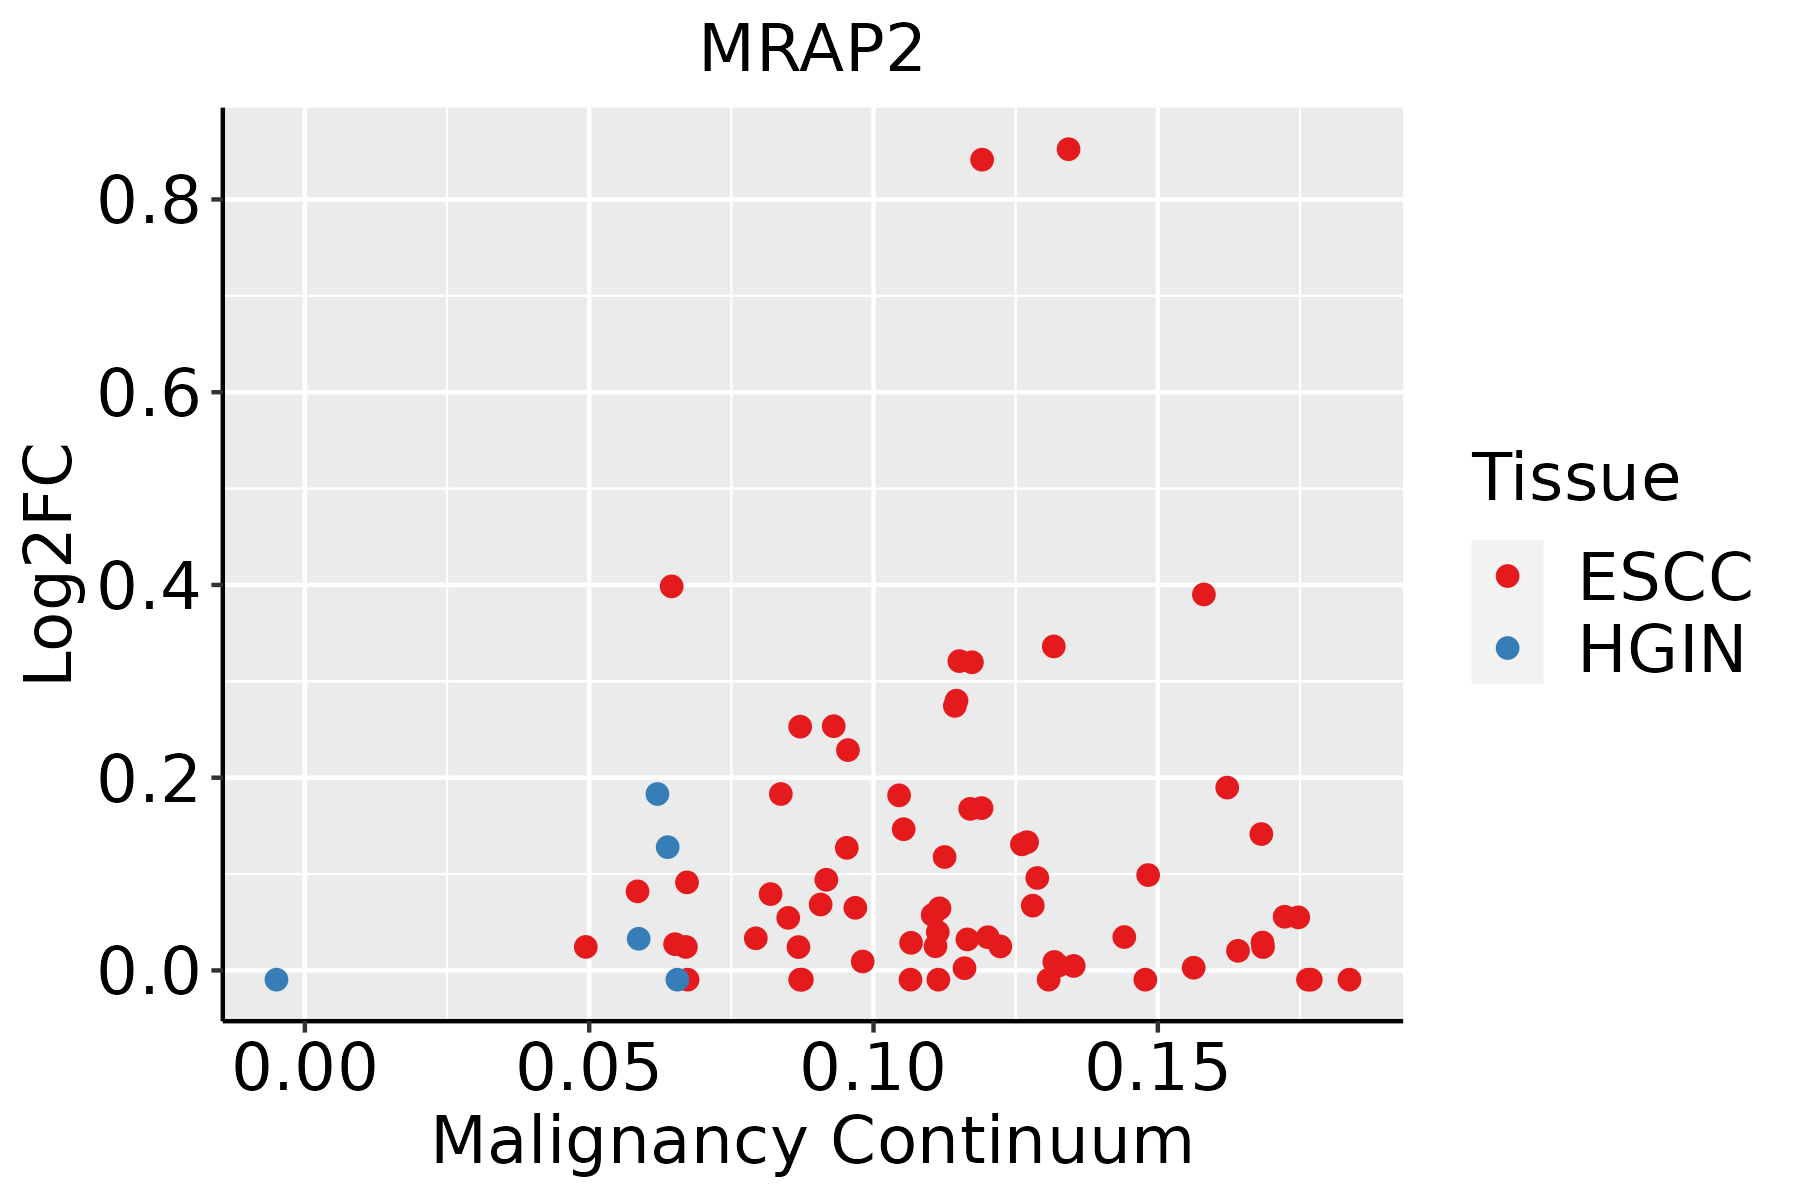 | ESCC: Esophageal squamous cell carcinoma |
| HGIN: High-grade intraepithelial neoplasias | ||
| LGIN: Low-grade intraepithelial neoplasias | ||
| Oral Cavity | 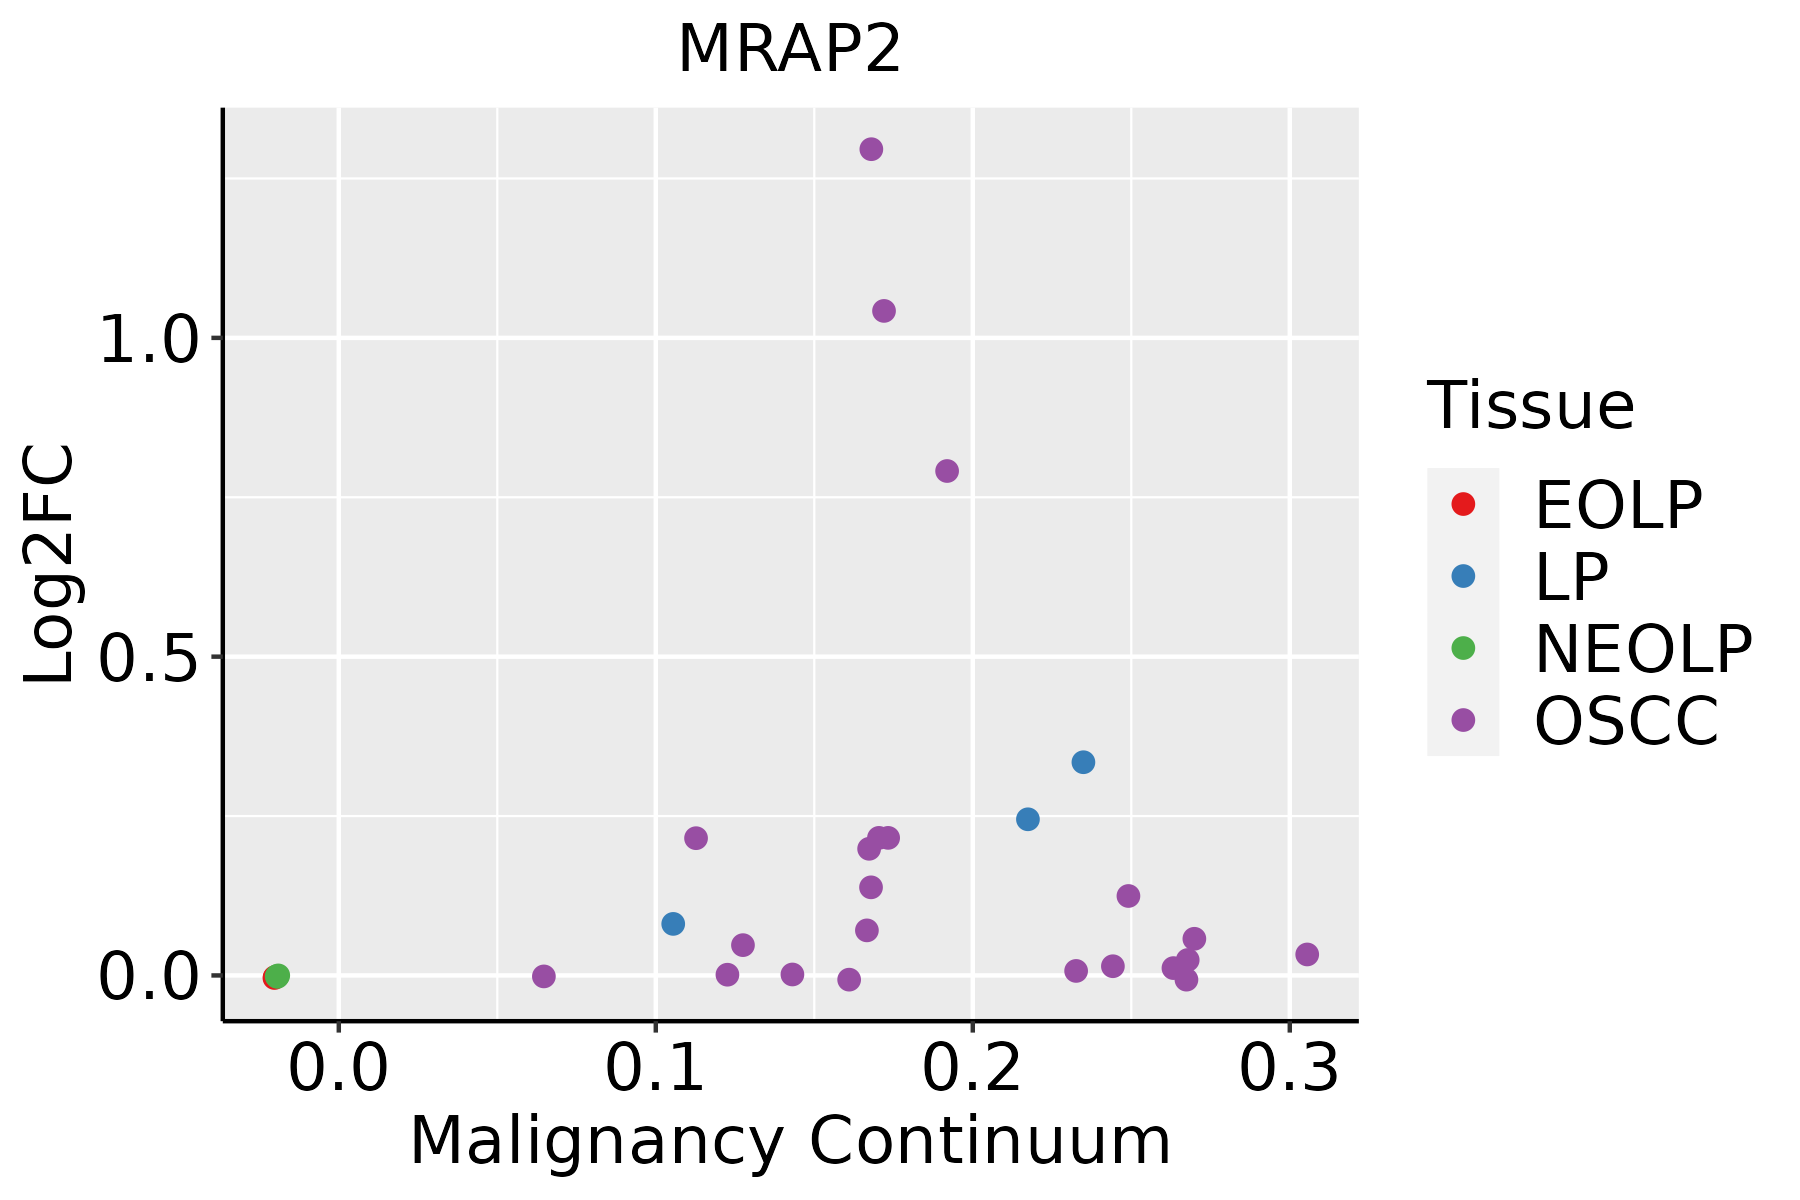 | EOLP: Erosive Oral lichen planus |
| LP: leukoplakia | ||
| NEOLP: Non-erosive oral lichen planus | ||
| OSCC: Oral squamous cell carcinoma |
| ∗log2FC in expression of this searched gene in stem-like cells from each diseased tissue sample relative to stem-like cells in normal samples in each tissue plotted against the malignancy continuum. Samples are colored based on if they are from different disease stage. |
Top |
Malignant transformation related pathway analysis |
| Find out the enriched GO biological processes and KEGG pathways involved in transition from healthy to precancer to cancer |
| Tissue | Disease Stage | Enriched GO biological Processes |
| Colorectum | AD |  |
| Colorectum | SER |  |
| Colorectum | MSS |  |
| Colorectum | MSI-H |  |
| Colorectum | FAP |  |
| ∗Top 15 enriched GO BP terms are showed in the bar plot of each disease state in each tissue. Each row represents a significant GO biological process which is colored according to the -log10(p.adjust). |
| Page: 1 2 3 4 5 6 7 8 9 |
| GO ID | Tissue | Disease Stage | Description | Gene Ratio | Bg Ratio | pvalue | p.adjust | Count |
| GO:0006091110 | Esophagus | ESCC | generation of precursor metabolites and energy | 331/8552 | 490/18723 | 3.86e-23 | 8.45e-21 | 331 |
| GO:0015980110 | Esophagus | ESCC | energy derivation by oxidation of organic compounds | 220/8552 | 318/18723 | 1.20e-17 | 1.09e-15 | 220 |
| GO:0072659110 | Esophagus | ESCC | protein localization to plasma membrane | 193/8552 | 284/18723 | 1.95e-14 | 1.03e-12 | 193 |
| GO:199077819 | Esophagus | ESCC | protein localization to cell periphery | 217/8552 | 333/18723 | 4.08e-13 | 1.88e-11 | 217 |
| GO:190547519 | Esophagus | ESCC | regulation of protein localization to membrane | 117/8552 | 175/18723 | 1.14e-08 | 2.26e-07 | 117 |
| GO:190437519 | Esophagus | ESCC | regulation of protein localization to cell periphery | 85/8552 | 125/18723 | 3.63e-07 | 5.06e-06 | 85 |
| GO:1903076110 | Esophagus | ESCC | regulation of protein localization to plasma membrane | 72/8552 | 104/18723 | 9.74e-07 | 1.23e-05 | 72 |
| GO:19038289 | Esophagus | ESCC | negative regulation of cellular protein localization | 76/8552 | 117/18723 | 1.97e-05 | 1.72e-04 | 76 |
| GO:19030778 | Esophagus | ESCC | negative regulation of protein localization to plasma membrane | 17/8552 | 24/18723 | 1.13e-02 | 3.81e-02 | 17 |
| GO:19043765 | Esophagus | ESCC | negative regulation of protein localization to cell periphery | 18/8552 | 26/18723 | 1.32e-02 | 4.31e-02 | 18 |
| GO:000609118 | Oral cavity | OSCC | generation of precursor metabolites and energy | 286/7305 | 490/18723 | 1.45e-18 | 1.71e-16 | 286 |
| GO:001598018 | Oral cavity | OSCC | energy derivation by oxidation of organic compounds | 190/7305 | 318/18723 | 4.10e-14 | 2.26e-12 | 190 |
| GO:007265918 | Oral cavity | OSCC | protein localization to plasma membrane | 169/7305 | 284/18723 | 1.69e-12 | 7.21e-11 | 169 |
| GO:199077816 | Oral cavity | OSCC | protein localization to cell periphery | 190/7305 | 333/18723 | 1.46e-11 | 5.13e-10 | 190 |
| GO:190547516 | Oral cavity | OSCC | regulation of protein localization to membrane | 105/7305 | 175/18723 | 1.42e-08 | 2.85e-07 | 105 |
| GO:190437516 | Oral cavity | OSCC | regulation of protein localization to cell periphery | 78/7305 | 125/18723 | 9.80e-08 | 1.68e-06 | 78 |
| GO:190307617 | Oral cavity | OSCC | regulation of protein localization to plasma membrane | 67/7305 | 104/18723 | 1.34e-07 | 2.24e-06 | 67 |
| GO:19038288 | Oral cavity | OSCC | negative regulation of cellular protein localization | 65/7305 | 117/18723 | 2.05e-04 | 1.36e-03 | 65 |
| GO:19030777 | Oral cavity | OSCC | negative regulation of protein localization to plasma membrane | 16/7305 | 24/18723 | 5.63e-03 | 2.17e-02 | 16 |
| GO:19054764 | Oral cavity | OSCC | negative regulation of protein localization to membrane | 19/7305 | 32/18723 | 1.56e-02 | 5.00e-02 | 19 |
| Page: 1 2 |
| Pathway ID | Tissue | Disease Stage | Description | Gene Ratio | Bg Ratio | pvalue | p.adjust | qvalue | Count |
| Page: 1 |
Top |
Cell-cell communication analysis |
| Identification of potential cell-cell interactions between two cell types and their ligand-receptor pairs for different disease states |
| Ligand | Receptor | LRpair | Pathway | Tissue | Disease Stage |
| Page: 1 |
Top |
Single-cell gene regulatory network inference analysis |
| Find out the significant the regulons (TFs) and the target genes of each regulon across cell types for different disease states |
| TF | Cell Type | Tissue | Disease Stage | Target Gene | RSS | Regulon Activity |
| ∗The dot plots of a searched regulon are shown for all cell subpopulations in each disease state of each tissue based on the regulon specific score inferred using pySCENIC and by calculating the average expression. |
| Page: 1 |
Top |
Somatic mutation of malignant transformation related genes |
| Annotation of somatic variants for genes involved in malignant transformation |
| Hugo Symbol | Variant Class | Variant Classification | dbSNP RS | HGVSc | HGVSp | HGVSp Short | SWISSPROT | BIOTYPE | SIFT | PolyPhen | Tumor Sample Barcode | Tissue | Histology | Sex | Age | Stage | Therapy Types | Drugs | Outcome |
| MRAP2 | deletion | Frame_Shift_Del | c.590delN | p.Gln198ArgfsTer14 | p.Q198Rfs*14 | Q96G30 | protein_coding | TCGA-05-4382-01 | Lung | lung adenocarcinoma | Male | >=65 | I/II | Unknown | Unknown | PD | |||
| MRAP2 | SNV | Missense_Mutation | c.101N>T | p.Ser34Phe | p.S34F | Q96G30 | protein_coding | deleterious(0.02) | probably_damaging(0.998) | TCGA-D6-6516-01 | Oral cavity | head & neck squamous cell carcinoma | Male | >=65 | I/II | Unknown | Unknown | SD | |
| MRAP2 | SNV | Missense_Mutation | c.518A>G | p.Asp173Gly | p.D173G | Q96G30 | protein_coding | deleterious(0) | benign(0.179) | TCGA-BR-6452-01 | Stomach | stomach adenocarcinoma | Female | >=65 | I/II | Unknown | Unknown | SD |
| Page: 1 2 3 4 5 |
Top |
Related drugs of malignant transformation related genes |
| Identification of chemicals and drugs interact with genes involved in malignant transfromation |
| (DGIdb 4.0) |
| Entrez ID | Symbol | Category | Interaction Types | Drug Claim Name | Drug Name | PMIDs |
| Page: 1 |

Copyright 2023-Present -The University of Texas Health Science Center at Houston |