| Tissue | Expression Dynamics | Abbreviation |
| Colorectum (GSE201348) |  | FAP: Familial adenomatous polyposis |
| CRC: Colorectal cancer |
| Colorectum (HTA11) |  | AD: Adenomas |
| SER: Sessile serrated lesions |
| MSI-H: Microsatellite-high colorectal cancer |
| MSS: Microsatellite stable colorectal cancer |
| Esophagus | 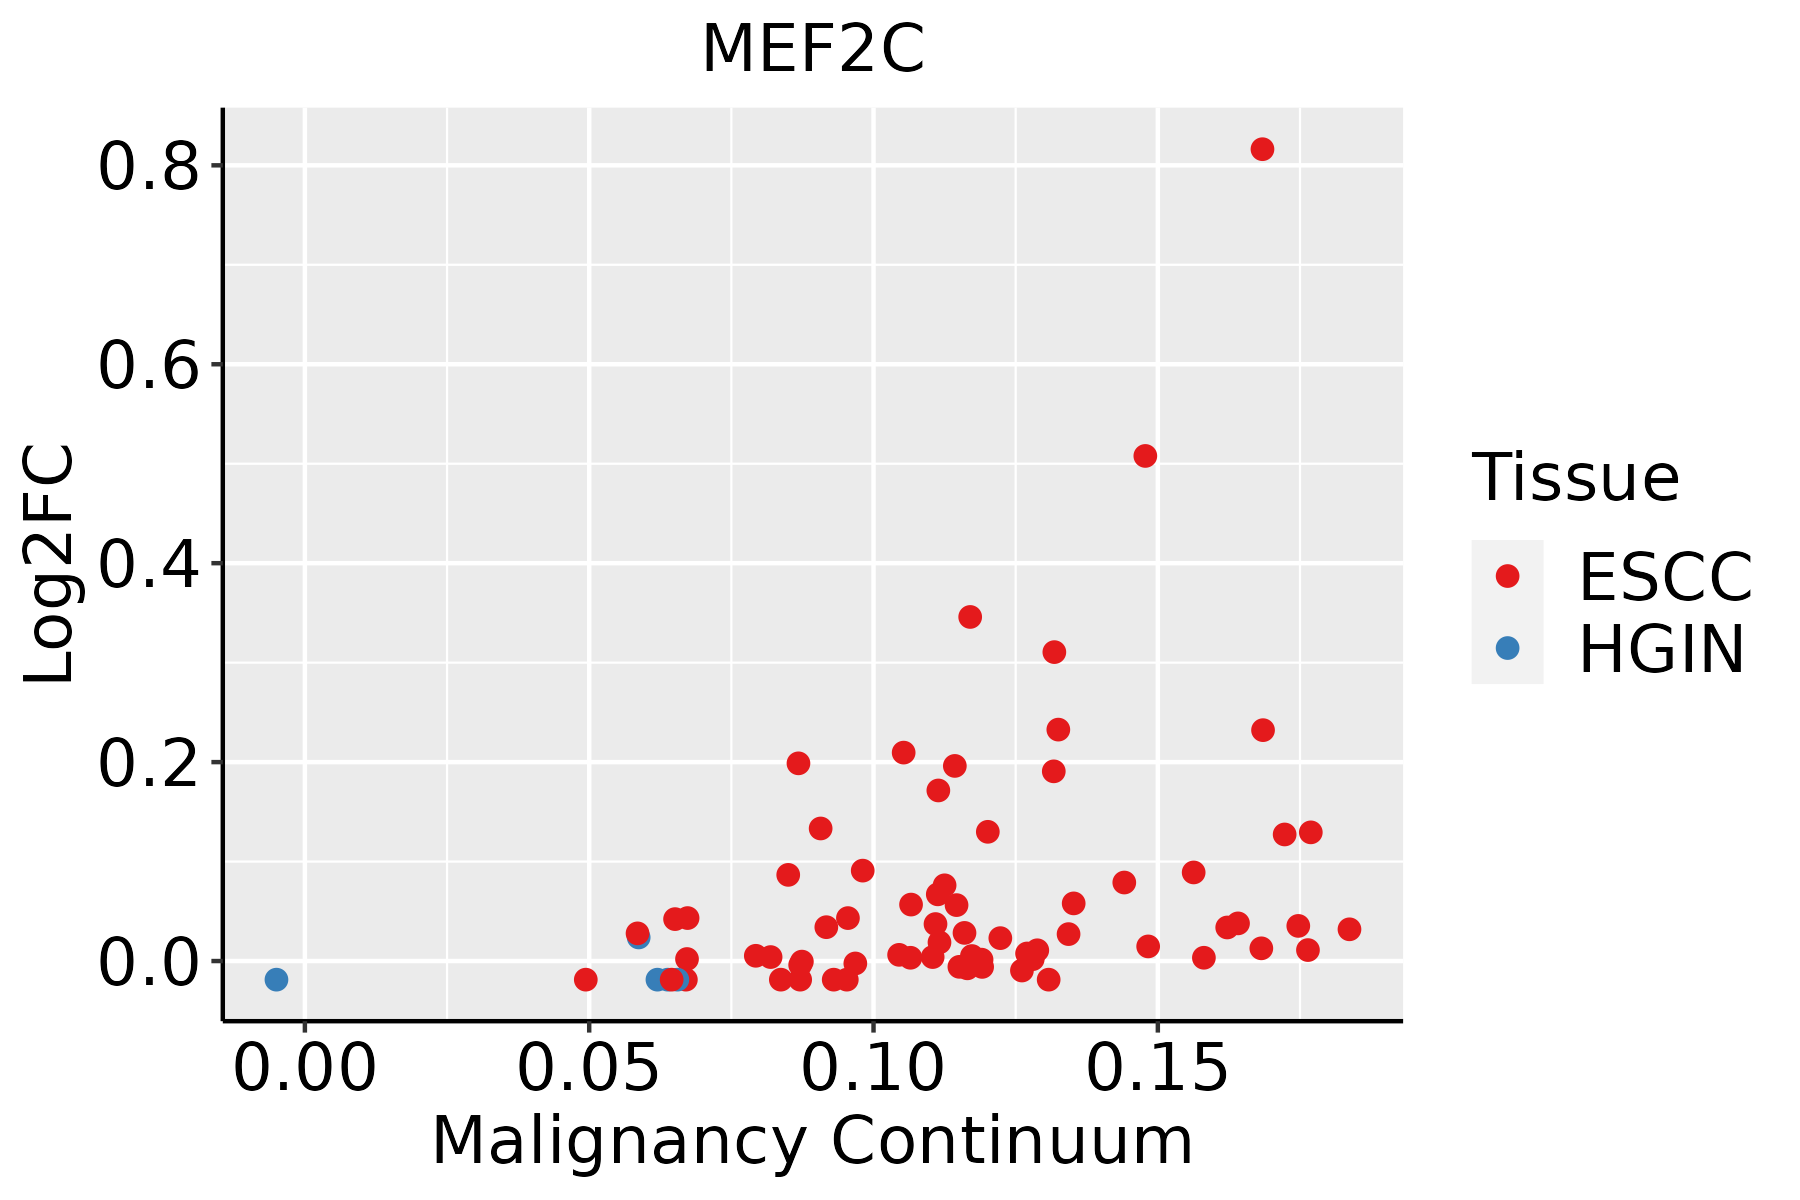 | ESCC: Esophageal squamous cell carcinoma |
| HGIN: High-grade intraepithelial neoplasias |
| LGIN: Low-grade intraepithelial neoplasias |
| Liver |  | HCC: Hepatocellular carcinoma |
| NAFLD: Non-alcoholic fatty liver disease |
| Lung |  | AAH: Atypical adenomatous hyperplasia |
| AIS: Adenocarcinoma in situ |
| IAC: Invasive lung adenocarcinoma |
| MIA: Minimally invasive adenocarcinoma |
| Thyroid | 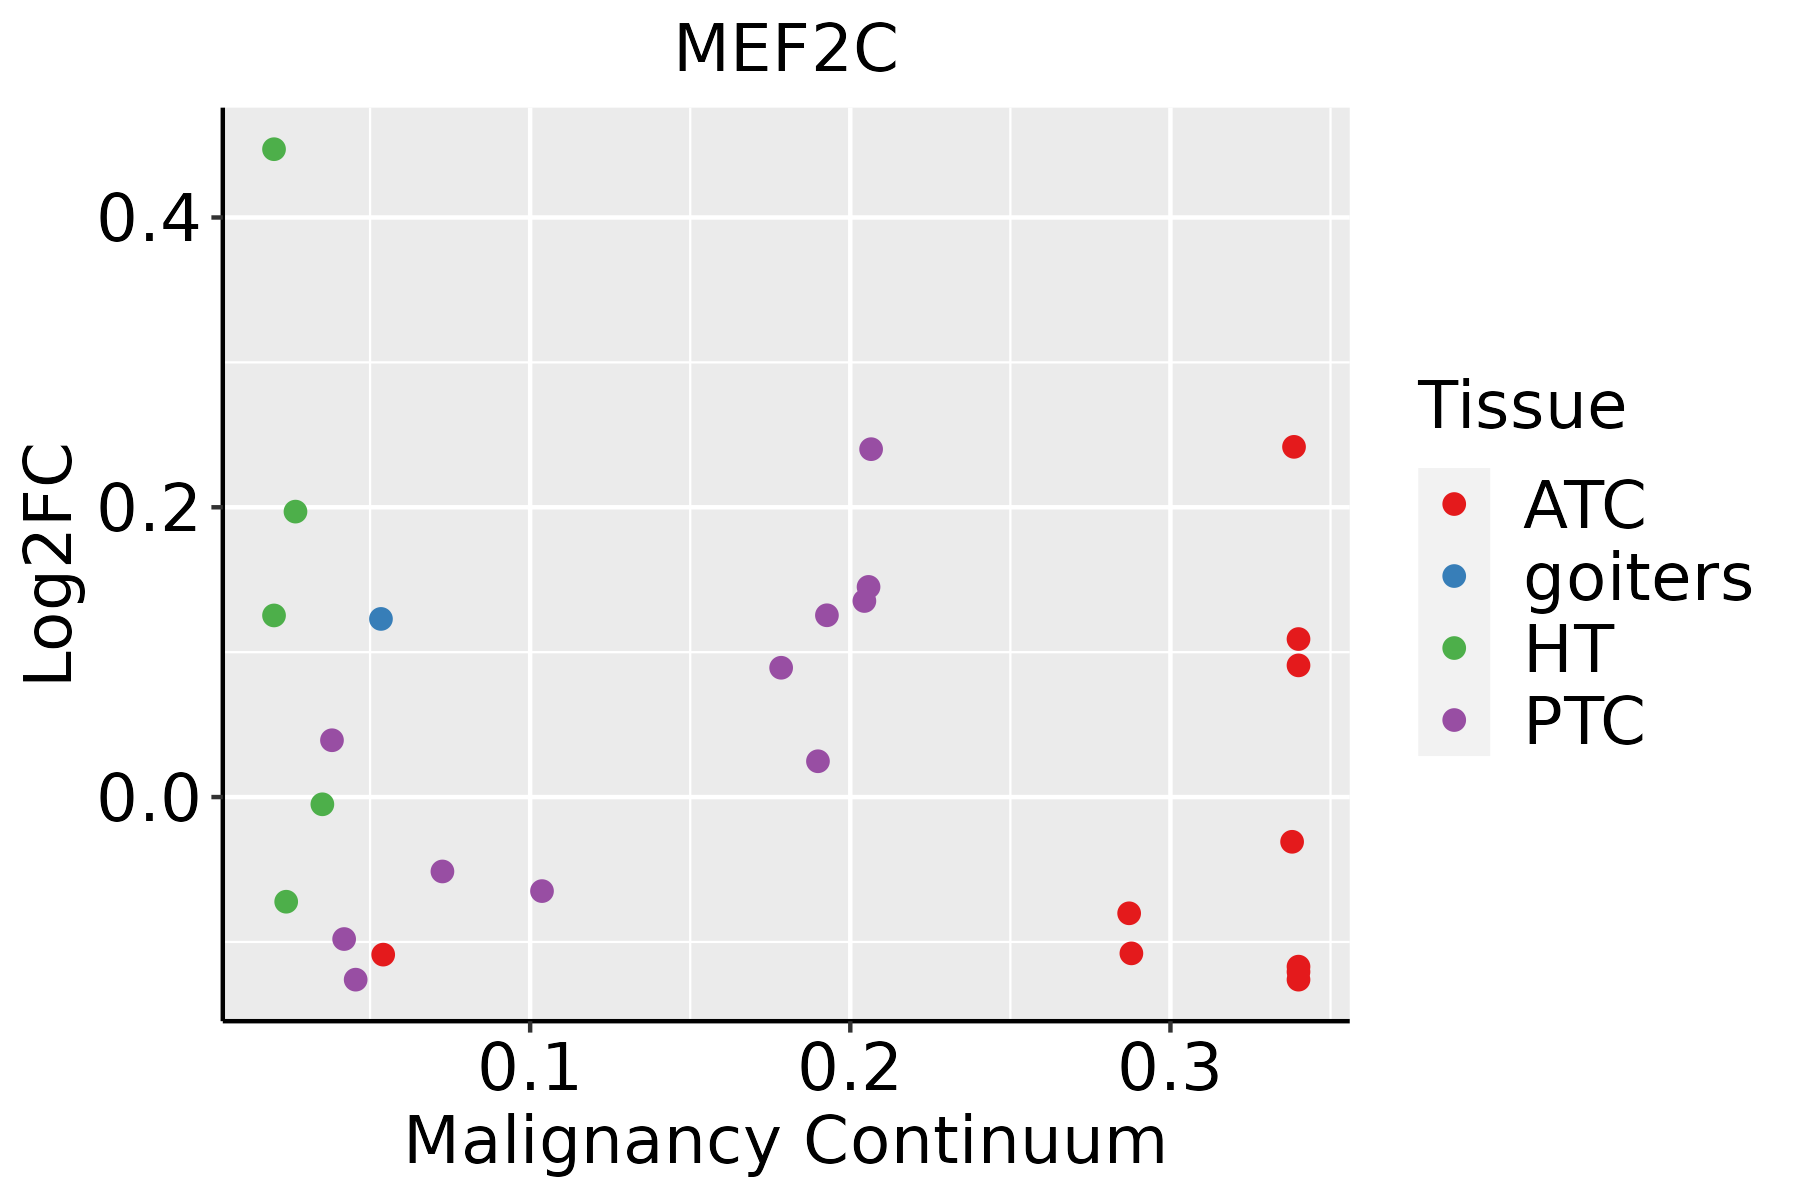 | ATC: Anaplastic thyroid cancer |
| HT: Hashimoto's thyroiditis |
| PTC: Papillary thyroid cancer |
| GO ID | Tissue | Disease Stage | Description | Gene Ratio | Bg Ratio | pvalue | p.adjust | Count |
| GO:0034329 | Colorectum | AD | cell junction assembly | 136/3918 | 420/18723 | 2.02e-08 | 1.15e-06 | 136 |
| GO:0070997 | Colorectum | AD | neuron death | 114/3918 | 361/18723 | 1.13e-06 | 3.72e-05 | 114 |
| GO:0030099 | Colorectum | AD | myeloid cell differentiation | 119/3918 | 381/18723 | 1.24e-06 | 4.01e-05 | 119 |
| GO:0048872 | Colorectum | AD | homeostasis of number of cells | 87/3918 | 272/18723 | 1.16e-05 | 2.61e-04 | 87 |
| GO:1901214 | Colorectum | AD | regulation of neuron death | 99/3918 | 319/18723 | 1.26e-05 | 2.76e-04 | 99 |
| GO:0016311 | Colorectum | AD | dephosphorylation | 123/3918 | 417/18723 | 1.84e-05 | 3.82e-04 | 123 |
| GO:0001667 | Colorectum | AD | ameboidal-type cell migration | 137/3918 | 475/18723 | 2.17e-05 | 4.33e-04 | 137 |
| GO:0035303 | Colorectum | AD | regulation of dephosphorylation | 46/3918 | 128/18723 | 6.20e-05 | 1.04e-03 | 46 |
| GO:0051402 | Colorectum | AD | neuron apoptotic process | 77/3918 | 246/18723 | 8.07e-05 | 1.28e-03 | 77 |
| GO:1901215 | Colorectum | AD | negative regulation of neuron death | 67/3918 | 208/18723 | 8.81e-05 | 1.35e-03 | 67 |
| GO:0090132 | Colorectum | AD | epithelium migration | 105/3918 | 360/18723 | 1.18e-04 | 1.73e-03 | 105 |
| GO:0010632 | Colorectum | AD | regulation of epithelial cell migration | 88/3918 | 292/18723 | 1.19e-04 | 1.75e-03 | 88 |
| GO:0010631 | Colorectum | AD | epithelial cell migration | 104/3918 | 357/18723 | 1.33e-04 | 1.90e-03 | 104 |
| GO:0090130 | Colorectum | AD | tissue migration | 105/3918 | 365/18723 | 2.10e-04 | 2.77e-03 | 105 |
| GO:0009410 | Colorectum | AD | response to xenobiotic stimulus | 128/3918 | 462/18723 | 2.69e-04 | 3.31e-03 | 128 |
| GO:0010038 | Colorectum | AD | response to metal ion | 106/3918 | 373/18723 | 3.22e-04 | 3.83e-03 | 106 |
| GO:0001649 | Colorectum | AD | osteoblast differentiation | 70/3918 | 229/18723 | 3.59e-04 | 4.18e-03 | 70 |
| GO:0045927 | Colorectum | AD | positive regulation of growth | 77/3918 | 259/18723 | 4.82e-04 | 5.27e-03 | 77 |
| GO:0060562 | Colorectum | AD | epithelial tube morphogenesis | 93/3918 | 325/18723 | 5.65e-04 | 6.00e-03 | 93 |
| GO:0071248 | Colorectum | AD | cellular response to metal ion | 61/3918 | 197/18723 | 5.74e-04 | 6.09e-03 | 61 |
| Pathway ID | Tissue | Disease Stage | Description | Gene Ratio | Bg Ratio | pvalue | p.adjust | qvalue | Count |
| hsa05418 | Colorectum | AD | Fluid shear stress and atherosclerosis | 54/2092 | 139/8465 | 1.41e-04 | 1.16e-03 | 7.37e-04 | 54 |
| hsa04928 | Colorectum | AD | Parathyroid hormone synthesis, secretion and action | 38/2092 | 106/8465 | 6.60e-03 | 2.77e-02 | 1.76e-02 | 38 |
| hsa054181 | Colorectum | AD | Fluid shear stress and atherosclerosis | 54/2092 | 139/8465 | 1.41e-04 | 1.16e-03 | 7.37e-04 | 54 |
| hsa049281 | Colorectum | AD | Parathyroid hormone synthesis, secretion and action | 38/2092 | 106/8465 | 6.60e-03 | 2.77e-02 | 1.76e-02 | 38 |
| hsa054188 | Colorectum | FAP | Fluid shear stress and atherosclerosis | 45/1404 | 139/8465 | 3.05e-06 | 4.63e-05 | 2.81e-05 | 45 |
| hsa040222 | Colorectum | FAP | cGMP-PKG signaling pathway | 42/1404 | 167/8465 | 2.84e-03 | 1.27e-02 | 7.70e-03 | 42 |
| hsa049286 | Colorectum | FAP | Parathyroid hormone synthesis, secretion and action | 29/1404 | 106/8465 | 3.37e-03 | 1.44e-02 | 8.77e-03 | 29 |
| hsa04010 | Colorectum | FAP | MAPK signaling pathway | 68/1404 | 302/8465 | 4.00e-03 | 1.67e-02 | 1.02e-02 | 68 |
| hsa054189 | Colorectum | FAP | Fluid shear stress and atherosclerosis | 45/1404 | 139/8465 | 3.05e-06 | 4.63e-05 | 2.81e-05 | 45 |
| hsa040223 | Colorectum | FAP | cGMP-PKG signaling pathway | 42/1404 | 167/8465 | 2.84e-03 | 1.27e-02 | 7.70e-03 | 42 |
| hsa049287 | Colorectum | FAP | Parathyroid hormone synthesis, secretion and action | 29/1404 | 106/8465 | 3.37e-03 | 1.44e-02 | 8.77e-03 | 29 |
| hsa040101 | Colorectum | FAP | MAPK signaling pathway | 68/1404 | 302/8465 | 4.00e-03 | 1.67e-02 | 1.02e-02 | 68 |
| hsa05418211 | Esophagus | ESCC | Fluid shear stress and atherosclerosis | 109/4205 | 139/8465 | 2.00e-12 | 3.72e-11 | 1.90e-11 | 109 |
| hsa052028 | Esophagus | ESCC | Transcriptional misregulation in cancer | 116/4205 | 193/8465 | 2.08e-03 | 5.95e-03 | 3.05e-03 | 116 |
| hsa0492816 | Esophagus | ESCC | Parathyroid hormone synthesis, secretion and action | 66/4205 | 106/8465 | 5.86e-03 | 1.47e-02 | 7.51e-03 | 66 |
| hsa05418310 | Esophagus | ESCC | Fluid shear stress and atherosclerosis | 109/4205 | 139/8465 | 2.00e-12 | 3.72e-11 | 1.90e-11 | 109 |
| hsa0520213 | Esophagus | ESCC | Transcriptional misregulation in cancer | 116/4205 | 193/8465 | 2.08e-03 | 5.95e-03 | 3.05e-03 | 116 |
| hsa0492817 | Esophagus | ESCC | Parathyroid hormone synthesis, secretion and action | 66/4205 | 106/8465 | 5.86e-03 | 1.47e-02 | 7.51e-03 | 66 |
| hsa0541842 | Liver | HCC | Fluid shear stress and atherosclerosis | 89/4020 | 139/8465 | 5.58e-05 | 2.88e-04 | 1.60e-04 | 89 |
| hsa0541852 | Liver | HCC | Fluid shear stress and atherosclerosis | 89/4020 | 139/8465 | 5.58e-05 | 2.88e-04 | 1.60e-04 | 89 |
| TF | Cell Type | Tissue | Disease Stage | Target Gene | RSS | Regulon Activity |
| MEF2C | MYOEPI | Breast | ADJ | HLA-DPA1,HLA-DPB1,C1QB, etc. | 6.19e-01 |  |
| MEF2C | STM | Breast | DCIS | HLA-DPA1,HLA-DPB1,C1QB, etc. | 2.21e-01 |  |
| MEF2C | MYOEPI | Breast | Precancer | HLA-DPA1,HLA-DPB1,C1QB, etc. | 5.91e-01 |  |
| MEF2C | CD8TCM | Breast | ADJ | CD74,HLA-DRA,IL32, etc. | 4.64e-01 | |
| MEF2C | KER | Cervix | Healthy | CYBA,AIF1,MZB1, etc. | 2.70e-01 |  |
| MEF2C | STM | Cervix | N_HPV | HLA-DPA1,SAMHD1,CD74, etc. | 4.38e-01 |  |
| MEF2C | BN | Cervix | CC | POU2F2,BLNK,PLCG2, etc. | 1.08e-01 |  |
| MEF2C | BN | Cervix | HSIL_HPV | POU2F2,BLNK,PLCG2, etc. | 1.11e-01 |  |
| MEF2C | BN | Cervix | N_HPV | POU2F2,BLNK,PLCG2, etc. | 1.13e-01 | |
| MEF2C | ABS | Colorectum | ADJ | SELENBP1,SLC26A2,LINC01687, etc. | 3.28e-01 |  |
| Hugo Symbol | Variant Class | Variant Classification | dbSNP RS | HGVSc | HGVSp | HGVSp Short | SWISSPROT | BIOTYPE | SIFT | PolyPhen | Tumor Sample Barcode | Tissue | Histology | Sex | Age | Stage | Therapy Types | Drugs | Outcome |
| MEF2C | SNV | Missense_Mutation | | c.1247N>T | p.Ser416Leu | p.S416L | Q06413 | protein_coding | tolerated(0.15) | possibly_damaging(0.847) | TCGA-BS-A0UV-01 | Endometrium | uterine corpus endometrioid carcinoma | Female | <65 | III/IV | Unknown | Unknown | SD |
| MEF2C | SNV | Missense_Mutation | | c.77T>G | p.Phe26Cys | p.F26C | Q06413 | protein_coding | deleterious(0) | probably_damaging(1) | TCGA-D1-A103-01 | Endometrium | uterine corpus endometrioid carcinoma | Female | >=65 | I/II | Unknown | Unknown | SD |
| MEF2C | SNV | Missense_Mutation | | c.1247C>T | p.Ser416Leu | p.S416L | Q06413 | protein_coding | tolerated(0.15) | possibly_damaging(0.847) | TCGA-DF-A2KU-01 | Endometrium | uterine corpus endometrioid carcinoma | Female | Unknown | I/II | Unknown | Unknown | SD |
| MEF2C | SNV | Missense_Mutation | | c.26C>T | p.Thr9Met | p.T9M | Q06413 | protein_coding | deleterious(0.01) | possibly_damaging(0.828) | TCGA-DF-A2KU-01 | Endometrium | uterine corpus endometrioid carcinoma | Female | Unknown | I/II | Unknown | Unknown | SD |
| MEF2C | SNV | Missense_Mutation | novel | c.1192C>T | p.Leu398Phe | p.L398F | Q06413 | protein_coding | deleterious(0) | benign(0.1) | TCGA-E6-A2P9-01 | Endometrium | uterine corpus endometrioid carcinoma | Female | >=65 | I/II | Unknown | Unknown | SD |
| MEF2C | SNV | Missense_Mutation | novel | c.93N>T | p.Lys31Asn | p.K31N | Q06413 | protein_coding | deleterious(0) | probably_damaging(0.996) | TCGA-EC-A1QX-01 | Endometrium | uterine corpus endometrioid carcinoma | Female | >=65 | I/II | Chemotherapy | cyclophosphamide | PD |
| MEF2C | SNV | Missense_Mutation | novel | c.1031C>A | p.Ser344Tyr | p.S344Y | Q06413 | protein_coding | tolerated(0.52) | probably_damaging(0.929) | TCGA-QS-A5YQ-01 | Endometrium | uterine corpus endometrioid carcinoma | Female | <65 | III/IV | Chemotherapy | cisplatin | CR |
| MEF2C | deletion | Frame_Shift_Del | | c.412delN | p.Ile138LeufsTer8 | p.I138Lfs*8 | Q06413 | protein_coding | | | TCGA-AP-A051-01 | Endometrium | uterine corpus endometrioid carcinoma | Female | >=65 | I/II | Unknown | Unknown | SD |
| MEF2C | insertion | Frame_Shift_Ins | novel | c.14_15insA | p.Ile6AspfsTer9 | p.I6Dfs*9 | Q06413 | protein_coding | | | TCGA-AX-A3FT-01 | Endometrium | uterine corpus endometrioid carcinoma | Female | <65 | I/II | Unknown | Unknown | SD |
| MEF2C | deletion | Frame_Shift_Del | | c.412delN | p.Ile138LeufsTer8 | p.I138Lfs*8 | Q06413 | protein_coding | | | TCGA-B5-A0JZ-01 | Endometrium | uterine corpus endometrioid carcinoma | Female | <65 | III/IV | Chemotherapy | carboplatin | PD |


