
|
|||||
|
 | |
| |
| |
| |
| |
| |
|
Gene: MARCH8 |
Gene summary for MARCH8 |
| Gene information | Species | Human | Gene symbol | MARCH8 | Gene ID | 220972 |
| Gene name | membrane associated ring-CH-type finger 8 | |
| Gene Alias | CMIR | |
| Cytomap | 10q11.21-q11.22 | |
| Gene Type | protein-coding | GO ID | GO:0000209 | UniProtAcc | A0A024R7U2 |
Top |
Malignant transformation analysis |
| Identification of the aberrant gene expression in precancerous and cancerous lesions by comparing the gene expression of stem-like cells in diseased tissues with normal stem cells |
| Entrez ID | Symbol | Replicates | Species | Organ | Tissue | Adj P-value | Log2FC | Malignancy |
| 220972 | MARCH8 | HTA11_3410_2000001011 | Human | Colorectum | AD | 5.81e-23 | -5.32e-01 | 0.0155 |
| 220972 | MARCH8 | HTA11_2487_2000001011 | Human | Colorectum | SER | 1.96e-13 | -5.32e-01 | -0.1808 |
| 220972 | MARCH8 | HTA11_2951_2000001011 | Human | Colorectum | AD | 2.38e-02 | -5.32e-01 | 0.0216 |
| 220972 | MARCH8 | HTA11_1938_2000001011 | Human | Colorectum | AD | 4.52e-10 | -5.32e-01 | -0.0811 |
| 220972 | MARCH8 | HTA11_78_2000001011 | Human | Colorectum | AD | 6.67e-16 | -5.32e-01 | -0.1088 |
| 220972 | MARCH8 | HTA11_347_2000001011 | Human | Colorectum | AD | 1.13e-24 | -5.32e-01 | -0.1954 |
| 220972 | MARCH8 | HTA11_3361_2000001011 | Human | Colorectum | AD | 1.75e-10 | -5.32e-01 | -0.1207 |
| 220972 | MARCH8 | HTA11_83_2000001011 | Human | Colorectum | SER | 2.89e-08 | -5.32e-01 | -0.1526 |
| 220972 | MARCH8 | HTA11_696_2000001011 | Human | Colorectum | AD | 7.76e-28 | -5.32e-01 | -0.1464 |
| 220972 | MARCH8 | HTA11_866_2000001011 | Human | Colorectum | AD | 9.10e-25 | -5.32e-01 | -0.1001 |
| 220972 | MARCH8 | HTA11_1391_2000001011 | Human | Colorectum | AD | 1.52e-18 | -5.32e-01 | -0.059 |
| 220972 | MARCH8 | HTA11_2992_2000001011 | Human | Colorectum | SER | 2.29e-03 | -5.32e-01 | -0.1706 |
| 220972 | MARCH8 | HTA11_5212_2000001011 | Human | Colorectum | AD | 4.13e-04 | -5.32e-01 | -0.2061 |
| 220972 | MARCH8 | HTA11_5216_2000001011 | Human | Colorectum | SER | 2.38e-02 | -5.32e-01 | -0.1462 |
| 220972 | MARCH8 | HTA11_546_2000001011 | Human | Colorectum | AD | 4.79e-07 | -5.32e-01 | -0.0842 |
| 220972 | MARCH8 | HTA11_7862_2000001011 | Human | Colorectum | AD | 1.50e-05 | -5.32e-01 | -0.0179 |
| 220972 | MARCH8 | HTA11_866_3004761011 | Human | Colorectum | AD | 3.10e-20 | -5.32e-01 | 0.096 |
| 220972 | MARCH8 | HTA11_4255_2000001011 | Human | Colorectum | SER | 2.38e-02 | -5.32e-01 | 0.0446 |
| 220972 | MARCH8 | HTA11_8622_2000001021 | Human | Colorectum | SER | 1.78e-04 | -5.32e-01 | 0.0528 |
| 220972 | MARCH8 | HTA11_7663_2000001011 | Human | Colorectum | SER | 7.31e-03 | -5.32e-01 | 0.0131 |
| Page: 1 2 3 4 |
| Tissue | Expression Dynamics | Abbreviation |
| Colorectum (GSE201348) |  | FAP: Familial adenomatous polyposis |
| CRC: Colorectal cancer | ||
| Colorectum (HTA11) |  | AD: Adenomas |
| SER: Sessile serrated lesions | ||
| MSI-H: Microsatellite-high colorectal cancer | ||
| MSS: Microsatellite stable colorectal cancer | ||
| Liver | 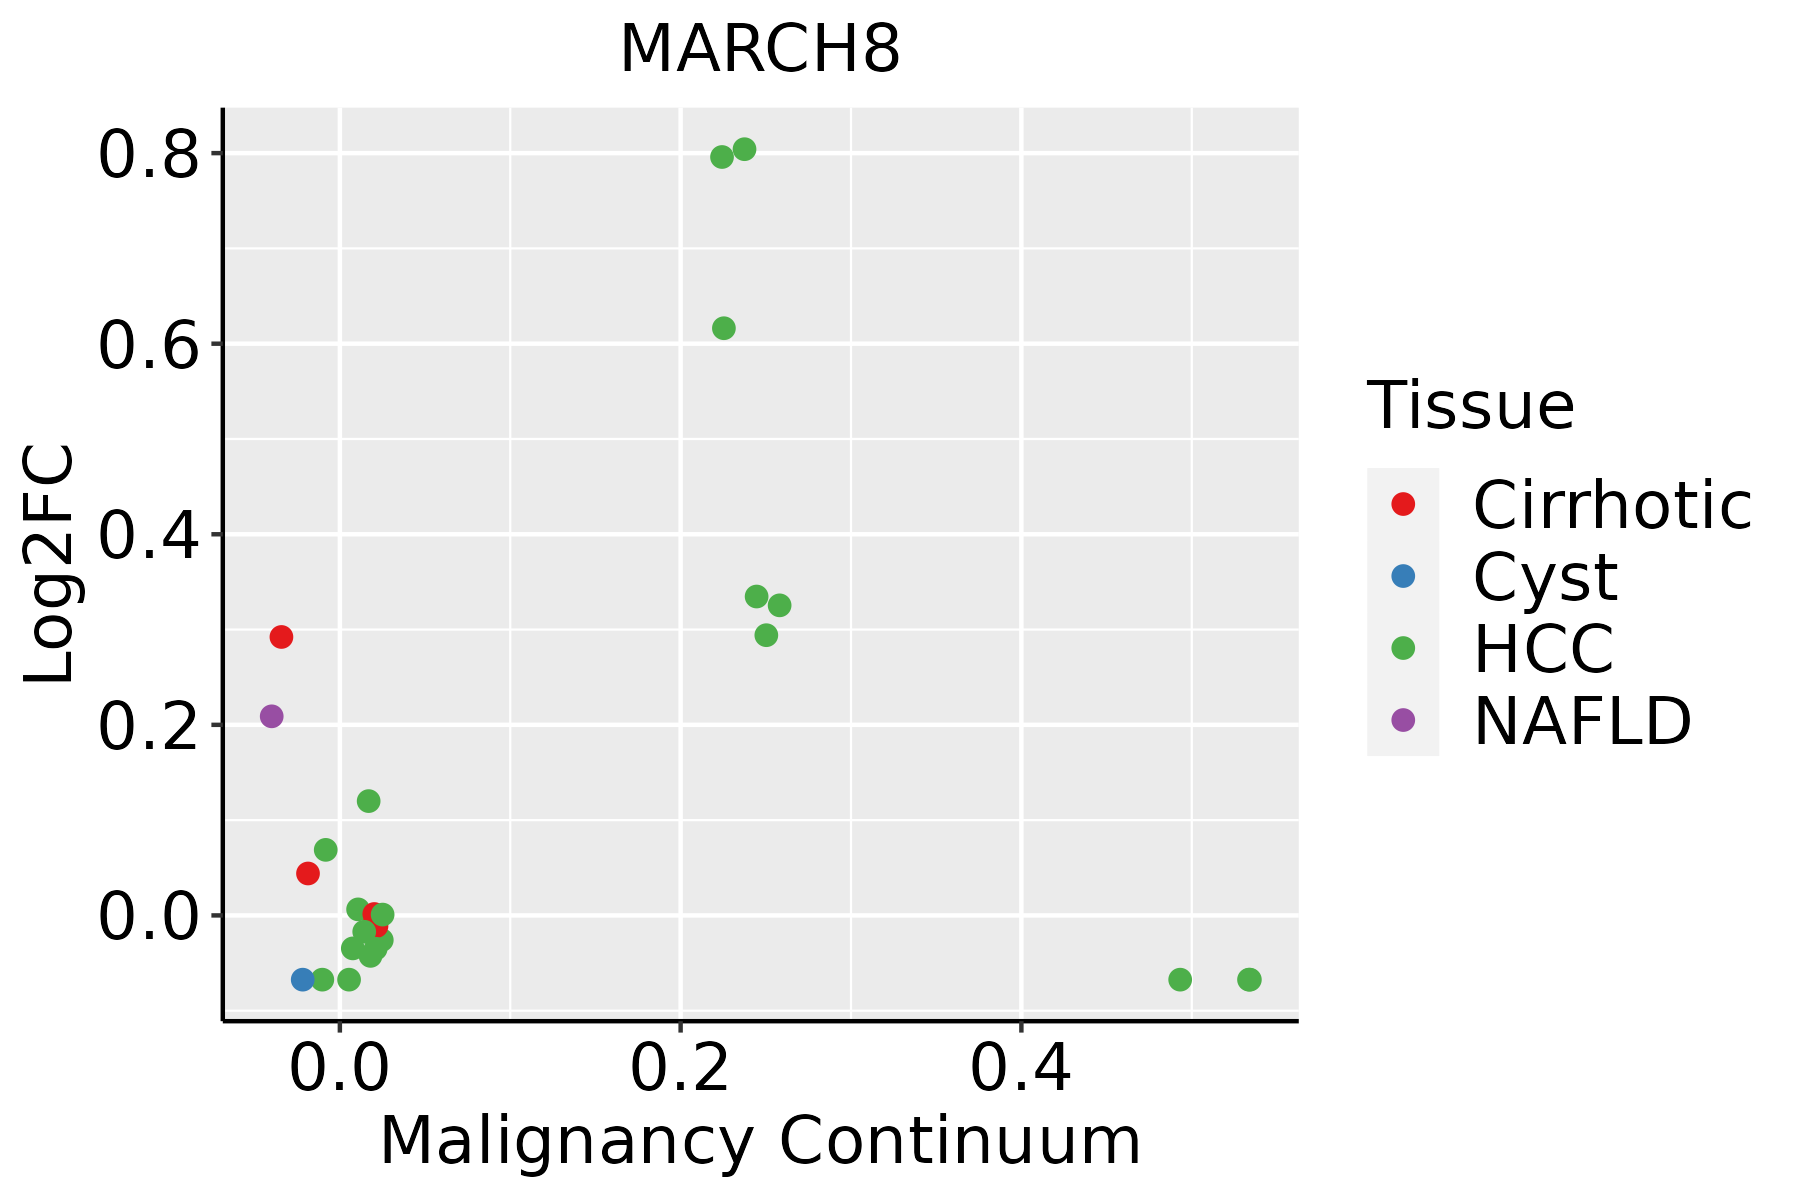 | HCC: Hepatocellular carcinoma |
| NAFLD: Non-alcoholic fatty liver disease |
| ∗log2FC in expression of this searched gene in stem-like cells from each diseased tissue sample relative to stem-like cells in normal samples in each tissue plotted against the malignancy continuum. Samples are colored based on if they are from different disease stage. |
Top |
Malignant transformation related pathway analysis |
| Find out the enriched GO biological processes and KEGG pathways involved in transition from healthy to precancer to cancer |
| Tissue | Disease Stage | Enriched GO biological Processes |
| Colorectum | AD |  |
| Colorectum | SER |  |
| Colorectum | MSS |  |
| Colorectum | MSI-H |  |
| Colorectum | FAP |  |
| ∗Top 15 enriched GO BP terms are showed in the bar plot of each disease state in each tissue. Each row represents a significant GO biological process which is colored according to the -log10(p.adjust). |
| Page: 1 2 3 4 5 6 7 8 9 |
| GO ID | Tissue | Disease Stage | Description | Gene Ratio | Bg Ratio | pvalue | p.adjust | Count |
| Page: 1 |
| Pathway ID | Tissue | Disease Stage | Description | Gene Ratio | Bg Ratio | pvalue | p.adjust | qvalue | Count |
| Page: 1 |
Top |
Cell-cell communication analysis |
| Identification of potential cell-cell interactions between two cell types and their ligand-receptor pairs for different disease states |
| Ligand | Receptor | LRpair | Pathway | Tissue | Disease Stage |
| Page: 1 |
Top |
Single-cell gene regulatory network inference analysis |
| Find out the significant the regulons (TFs) and the target genes of each regulon across cell types for different disease states |
| TF | Cell Type | Tissue | Disease Stage | Target Gene | RSS | Regulon Activity |
| ∗The dot plots of a searched regulon are shown for all cell subpopulations in each disease state of each tissue based on the regulon specific score inferred using pySCENIC and by calculating the average expression. |
| Page: 1 |
Top |
Somatic mutation of malignant transformation related genes |
| Annotation of somatic variants for genes involved in malignant transformation |
| Hugo Symbol | Variant Class | Variant Classification | dbSNP RS | HGVSc | HGVSp | HGVSp Short | SWISSPROT | BIOTYPE | SIFT | PolyPhen | Tumor Sample Barcode | Tissue | Histology | Sex | Age | Stage | Therapy Types | Drugs | Outcome |
| MARCH8 | SNV | Missense_Mutation | c.1199N>T | p.Ser400Phe | p.S400F | Q5T0T0 | protein_coding | deleterious(0) | probably_damaging(1) | TCGA-CR-5248-01 | Oral cavity | head & neck squamous cell carcinoma | Male | <65 | I/II | Chemotherapy | oxaliplatin | PD | |
| MARCH8 | SNV | Missense_Mutation | c.1208N>C | p.Arg403Pro | p.R403P | Q5T0T0 | protein_coding | deleterious(0) | probably_damaging(0.997) | TCGA-CV-A45Z-01 | Oral cavity | head & neck squamous cell carcinoma | Male | >=65 | I/II | Unknown | Unknown | PD | |
| MARCH8 | SNV | Missense_Mutation | c.1394N>G | p.Glu465Gly | p.E465G | Q5T0T0 | protein_coding | deleterious(0.01) | probably_damaging(0.999) | TCGA-BR-6458-01 | Stomach | stomach adenocarcinoma | Female | <65 | I/II | Chemotherapy | 5-fluorouracil | PD | |
| MARCH8 | SNV | Missense_Mutation | c.1367N>G | p.Tyr456Cys | p.Y456C | Q5T0T0 | protein_coding | deleterious(0.02) | probably_damaging(1) | TCGA-FK-A3SG-01 | Thyroid | thyroid carcinoma | Female | <65 | I/II | Unknown | Unknown | SD |
| Page: 1 2 3 4 5 |
Top |
Related drugs of malignant transformation related genes |
| Identification of chemicals and drugs interact with genes involved in malignant transfromation |
| (DGIdb 4.0) |
| Entrez ID | Symbol | Category | Interaction Types | Drug Claim Name | Drug Name | PMIDs |
| Page: 1 |

Copyright 2023-Present -The University of Texas Health Science Center at Houston |