
|
|||||
|
 | |
| |
| |
| |
| |
| |
|
Gene: ILKAP |
Gene summary for ILKAP |
| Gene information | Species | Human | Gene symbol | ILKAP | Gene ID | 80895 |
| Gene name | ILK associated serine/threonine phosphatase | |
| Gene Alias | ILKAP2 | |
| Cytomap | 2q37.3 | |
| Gene Type | protein-coding | GO ID | GO:0006464 | UniProtAcc | Q9H0C8 |
Top |
Malignant transformation analysis |
| Identification of the aberrant gene expression in precancerous and cancerous lesions by comparing the gene expression of stem-like cells in diseased tissues with normal stem cells |
| Entrez ID | Symbol | Replicates | Species | Organ | Tissue | Adj P-value | Log2FC | Malignancy |
| 80895 | ILKAP | LZE3D | Human | Esophagus | HGIN | 8.50e-04 | 6.79e-01 | 0.0668 |
| 80895 | ILKAP | LZE4T | Human | Esophagus | ESCC | 4.29e-12 | 3.37e-01 | 0.0811 |
| 80895 | ILKAP | LZE5T | Human | Esophagus | ESCC | 1.04e-02 | 1.65e-01 | 0.0514 |
| 80895 | ILKAP | LZE7T | Human | Esophagus | ESCC | 1.48e-05 | 2.97e-01 | 0.0667 |
| 80895 | ILKAP | LZE20T | Human | Esophagus | ESCC | 6.71e-09 | 1.95e-01 | 0.0662 |
| 80895 | ILKAP | LZE22T | Human | Esophagus | ESCC | 9.94e-03 | 4.28e-01 | 0.068 |
| 80895 | ILKAP | LZE24T | Human | Esophagus | ESCC | 1.27e-13 | 4.09e-01 | 0.0596 |
| 80895 | ILKAP | P1T-E | Human | Esophagus | ESCC | 2.41e-10 | 3.93e-01 | 0.0875 |
| 80895 | ILKAP | P2T-E | Human | Esophagus | ESCC | 3.05e-29 | 5.06e-01 | 0.1177 |
| 80895 | ILKAP | P4T-E | Human | Esophagus | ESCC | 7.48e-12 | 3.73e-01 | 0.1323 |
| 80895 | ILKAP | P5T-E | Human | Esophagus | ESCC | 1.37e-20 | 3.91e-01 | 0.1327 |
| 80895 | ILKAP | P8T-E | Human | Esophagus | ESCC | 2.36e-17 | 4.14e-01 | 0.0889 |
| 80895 | ILKAP | P9T-E | Human | Esophagus | ESCC | 6.15e-16 | 4.24e-01 | 0.1131 |
| 80895 | ILKAP | P10T-E | Human | Esophagus | ESCC | 3.33e-34 | 6.89e-01 | 0.116 |
| 80895 | ILKAP | P11T-E | Human | Esophagus | ESCC | 3.71e-14 | 5.76e-01 | 0.1426 |
| 80895 | ILKAP | P12T-E | Human | Esophagus | ESCC | 1.07e-44 | 8.04e-01 | 0.1122 |
| 80895 | ILKAP | P15T-E | Human | Esophagus | ESCC | 1.02e-34 | 6.69e-01 | 0.1149 |
| 80895 | ILKAP | P16T-E | Human | Esophagus | ESCC | 2.94e-36 | 5.97e-01 | 0.1153 |
| 80895 | ILKAP | P17T-E | Human | Esophagus | ESCC | 7.88e-09 | 6.17e-01 | 0.1278 |
| 80895 | ILKAP | P19T-E | Human | Esophagus | ESCC | 7.46e-09 | 7.48e-01 | 0.1662 |
| Page: 1 2 3 4 5 6 |
| Tissue | Expression Dynamics | Abbreviation |
| Esophagus | 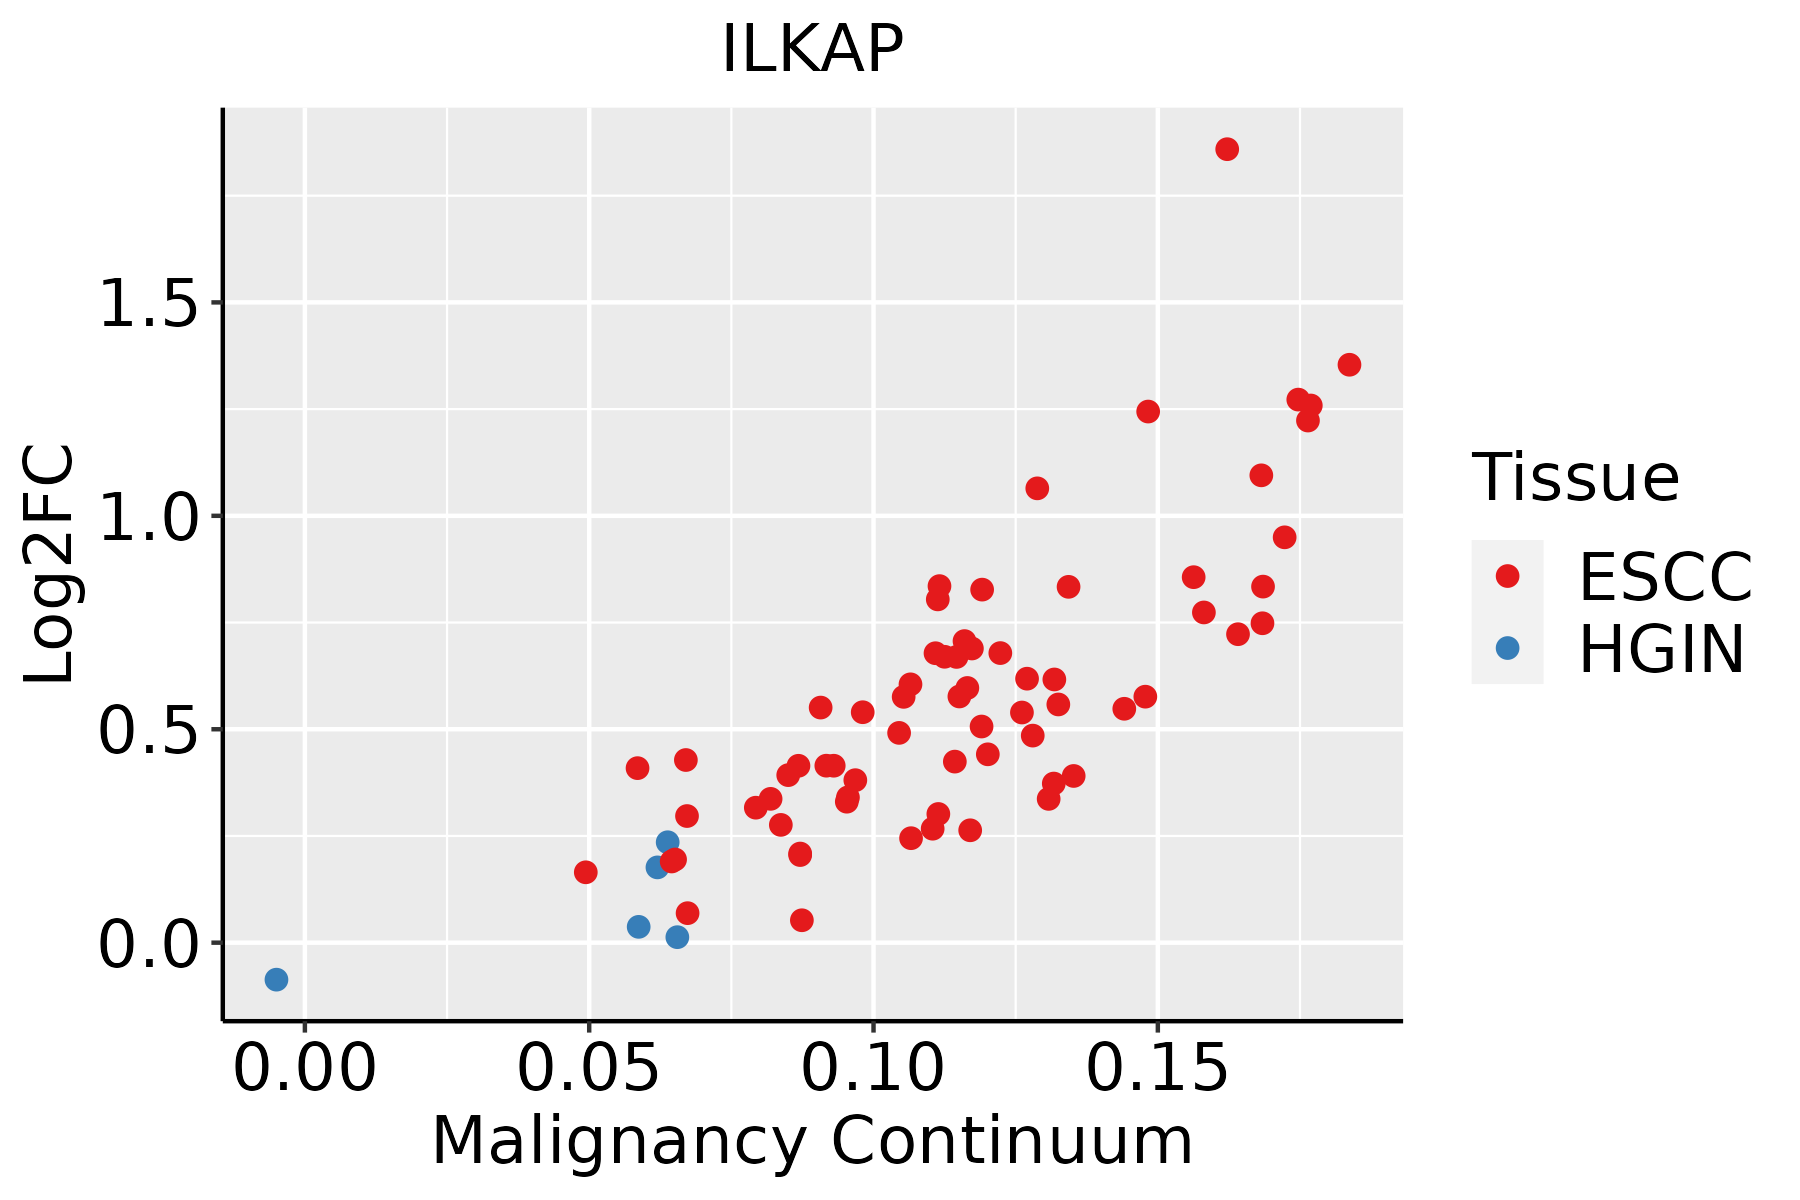 | ESCC: Esophageal squamous cell carcinoma |
| HGIN: High-grade intraepithelial neoplasias | ||
| LGIN: Low-grade intraepithelial neoplasias | ||
| Liver | 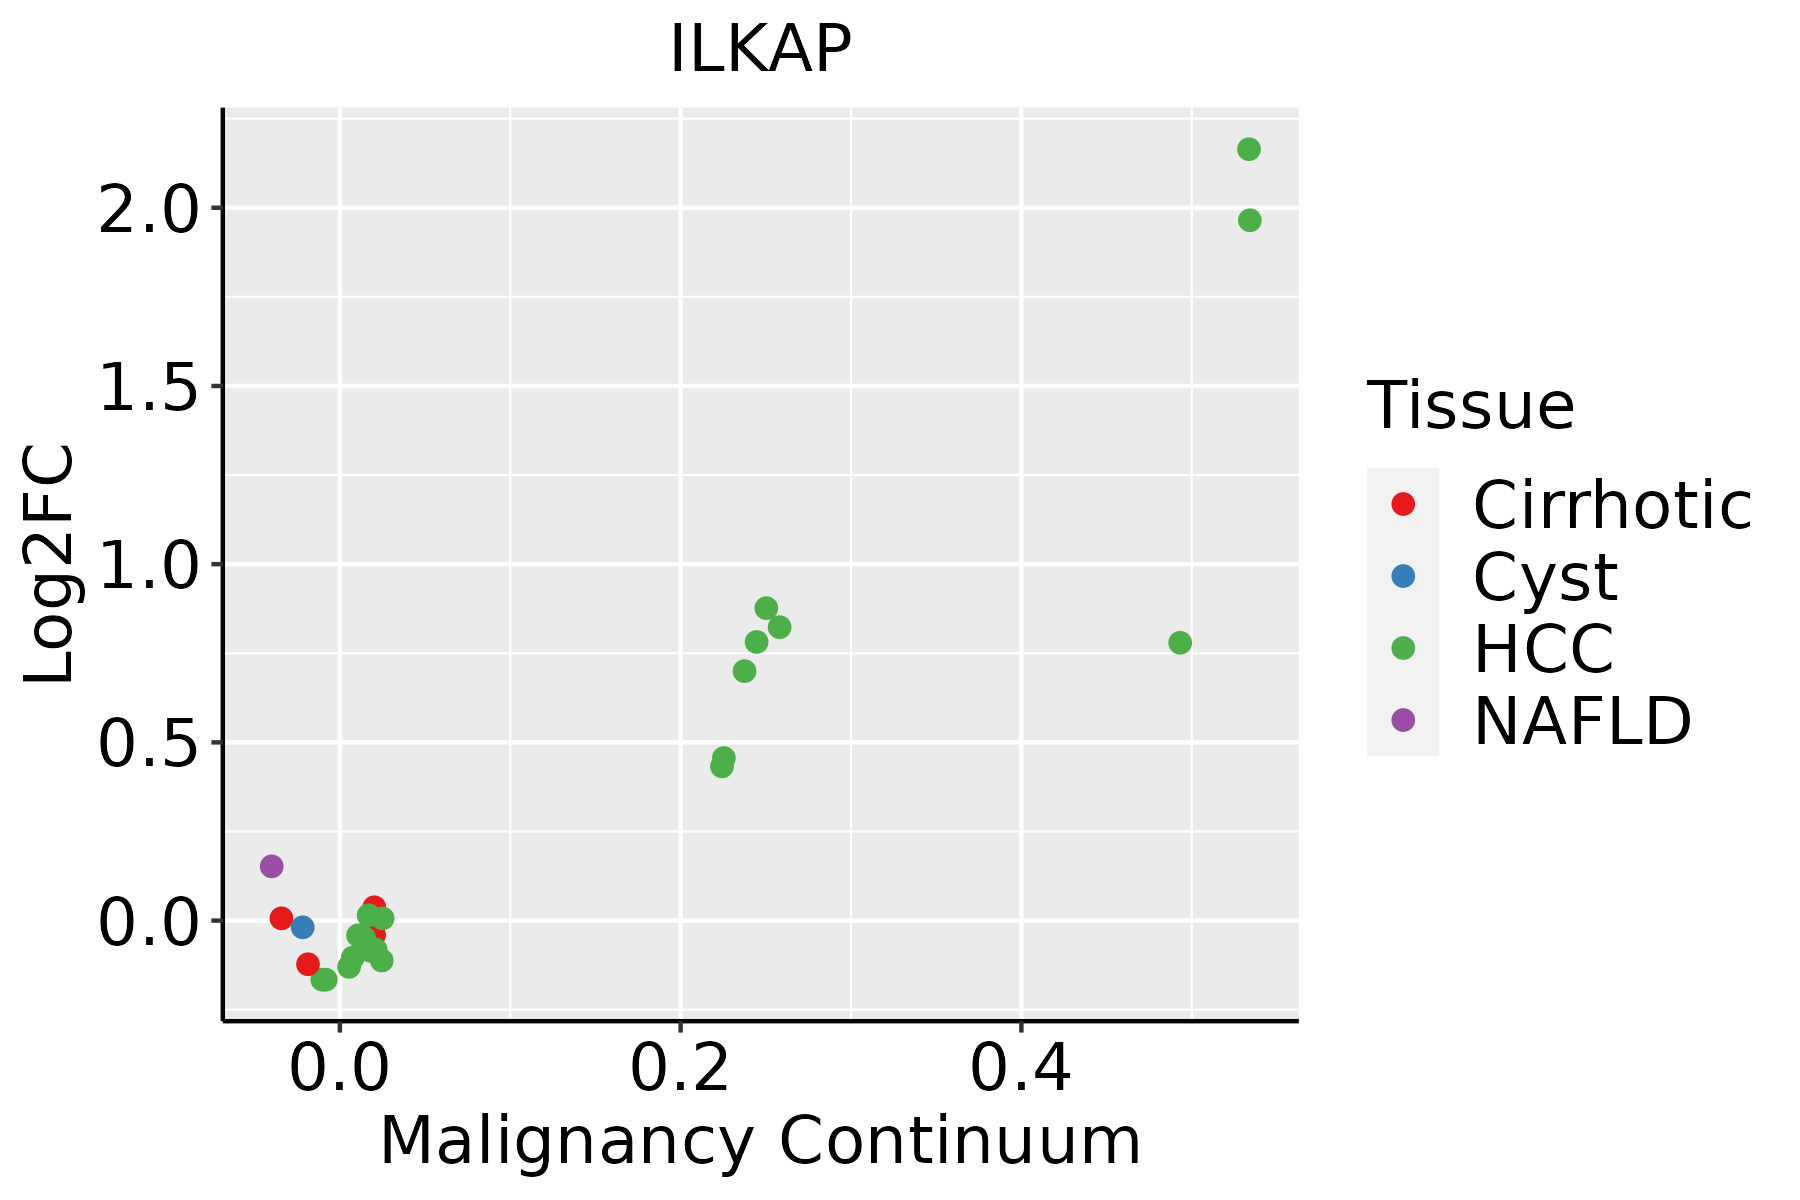 | HCC: Hepatocellular carcinoma |
| NAFLD: Non-alcoholic fatty liver disease | ||
| Oral Cavity | 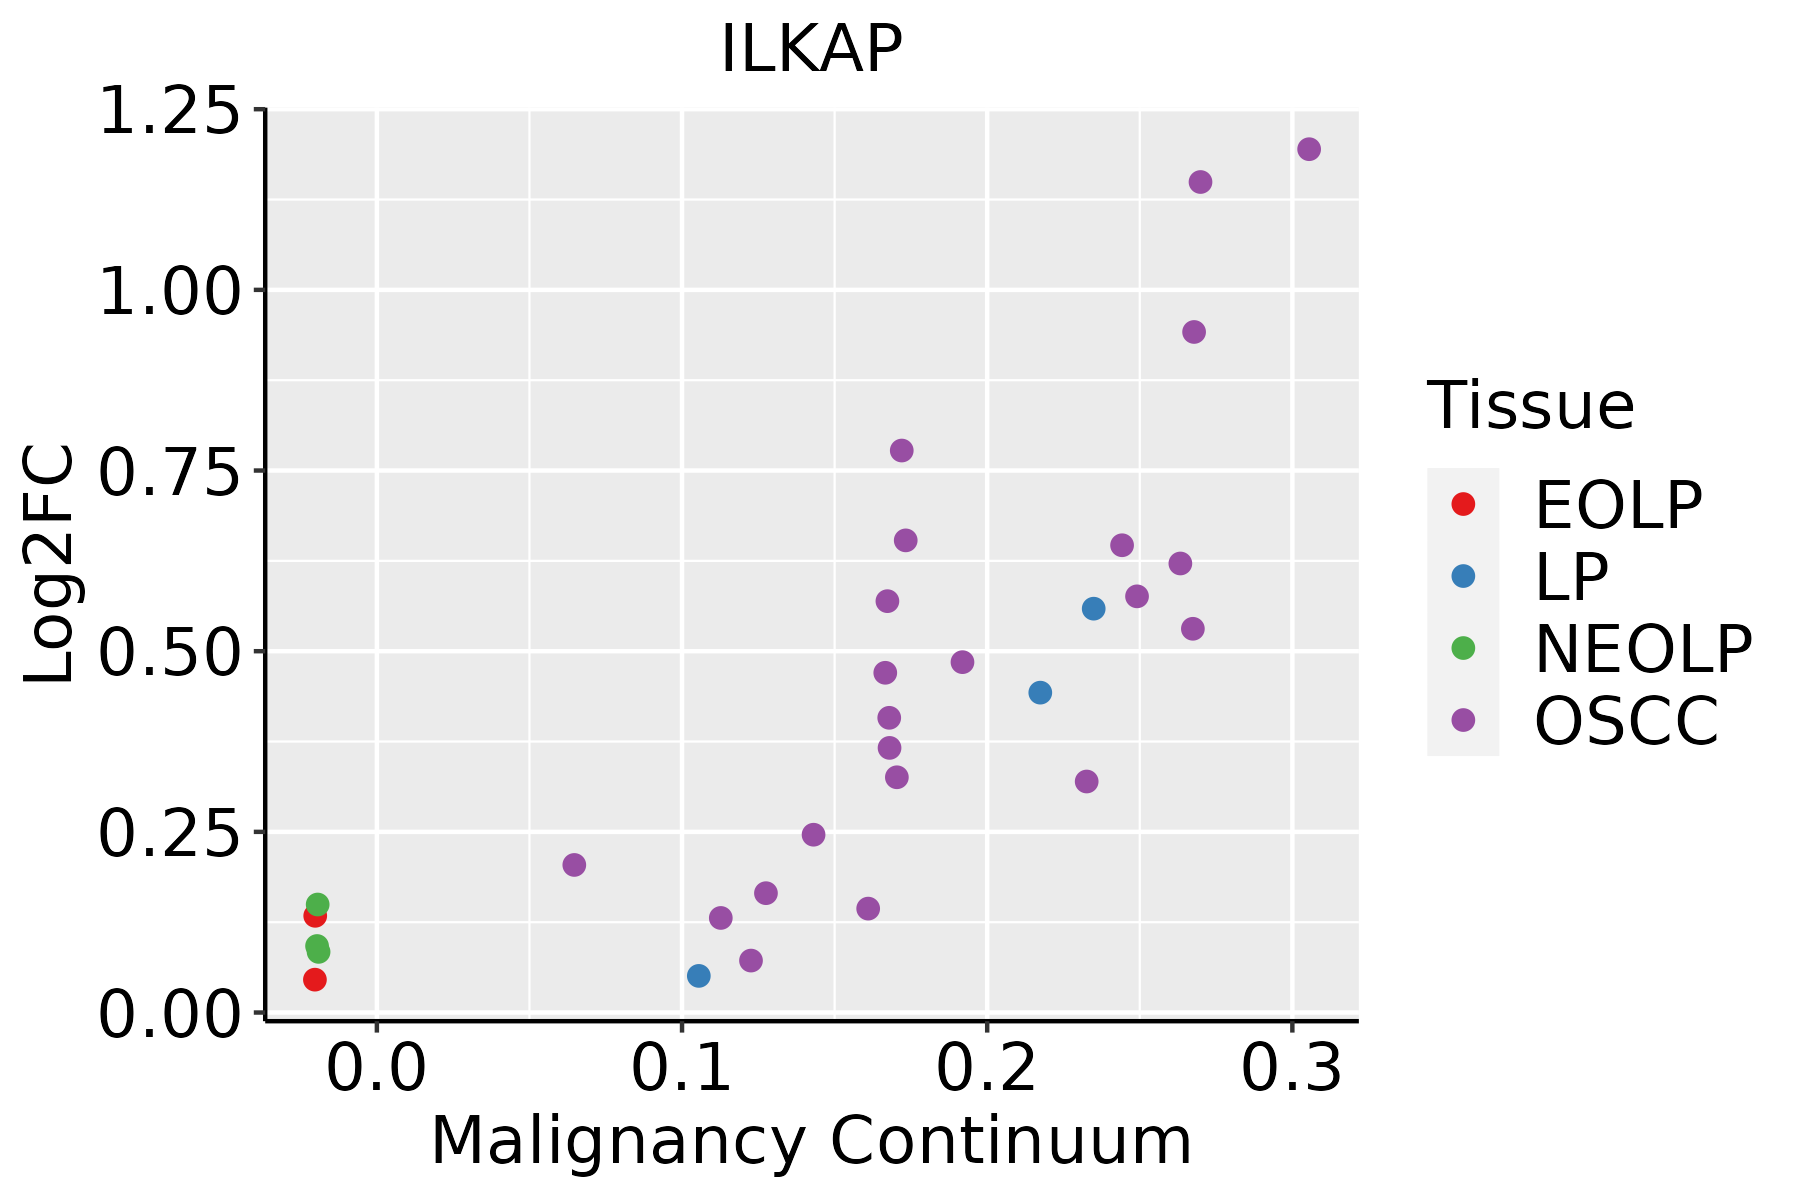 | EOLP: Erosive Oral lichen planus |
| LP: leukoplakia | ||
| NEOLP: Non-erosive oral lichen planus | ||
| OSCC: Oral squamous cell carcinoma | ||
| Skin |  | AK: Actinic keratosis |
| cSCC: Cutaneous squamous cell carcinoma | ||
| SCCIS:squamous cell carcinoma in situ | ||
| Thyroid | 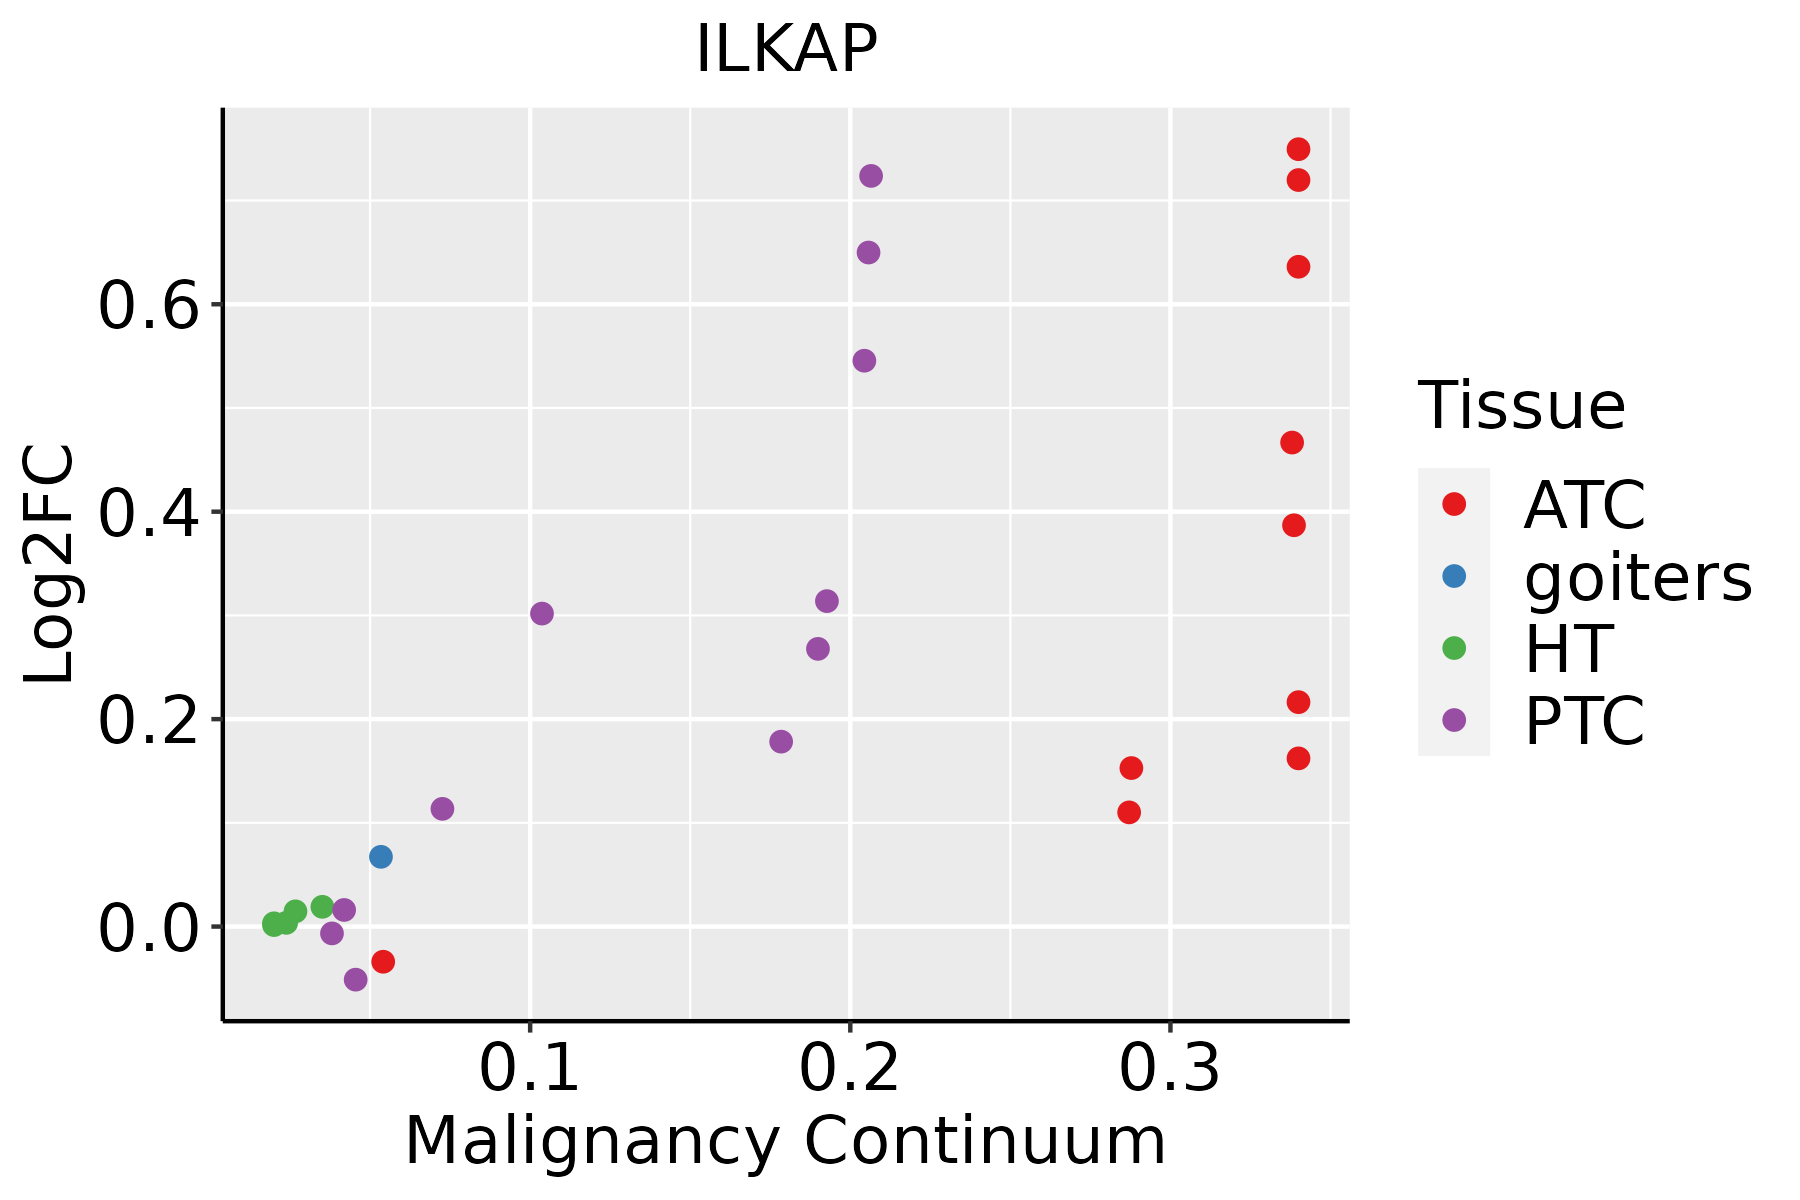 | ATC: Anaplastic thyroid cancer |
| HT: Hashimoto's thyroiditis | ||
| PTC: Papillary thyroid cancer |
| ∗log2FC in expression of this searched gene in stem-like cells from each diseased tissue sample relative to stem-like cells in normal samples in each tissue plotted against the malignancy continuum. Samples are colored based on if they are from different disease stage. |
Top |
Malignant transformation related pathway analysis |
| Find out the enriched GO biological processes and KEGG pathways involved in transition from healthy to precancer to cancer |
| Tissue | Disease Stage | Enriched GO biological Processes |
| Colorectum | AD |  |
| Colorectum | SER |  |
| Colorectum | MSS |  |
| Colorectum | MSI-H |  |
| Colorectum | FAP |  |
| ∗Top 15 enriched GO BP terms are showed in the bar plot of each disease state in each tissue. Each row represents a significant GO biological process which is colored according to the -log10(p.adjust). |
| Page: 1 2 3 4 5 6 7 8 9 |
| GO ID | Tissue | Disease Stage | Description | Gene Ratio | Bg Ratio | pvalue | p.adjust | Count |
| GO:001631110 | Esophagus | ESCC | dephosphorylation | 251/8552 | 417/18723 | 1.26e-09 | 2.99e-08 | 251 |
| GO:000647018 | Esophagus | ESCC | protein dephosphorylation | 177/8552 | 281/18723 | 3.13e-09 | 6.72e-08 | 177 |
| GO:001631121 | Liver | HCC | dephosphorylation | 230/7958 | 417/18723 | 1.00e-07 | 1.96e-06 | 230 |
| GO:000647021 | Liver | HCC | protein dephosphorylation | 162/7958 | 281/18723 | 1.91e-07 | 3.46e-06 | 162 |
| GO:000647015 | Oral cavity | OSCC | protein dephosphorylation | 162/7305 | 281/18723 | 1.56e-10 | 4.56e-09 | 162 |
| GO:00163119 | Oral cavity | OSCC | dephosphorylation | 220/7305 | 417/18723 | 6.33e-09 | 1.34e-07 | 220 |
| GO:000647016 | Oral cavity | LP | protein dephosphorylation | 89/4623 | 281/18723 | 4.60e-03 | 2.93e-02 | 89 |
| GO:000647023 | Oral cavity | EOLP | protein dephosphorylation | 72/2218 | 281/18723 | 1.19e-10 | 1.35e-08 | 72 |
| GO:001631114 | Oral cavity | EOLP | dephosphorylation | 85/2218 | 417/18723 | 3.19e-07 | 9.47e-06 | 85 |
| GO:000647019 | Skin | AK | protein dephosphorylation | 49/1910 | 281/18723 | 1.30e-04 | 1.61e-03 | 49 |
| GO:000647024 | Skin | cSCC | protein dephosphorylation | 111/4864 | 281/18723 | 4.10e-07 | 7.96e-06 | 111 |
| GO:001631115 | Skin | cSCC | dephosphorylation | 134/4864 | 417/18723 | 2.65e-03 | 1.50e-02 | 134 |
| GO:001631116 | Thyroid | PTC | dephosphorylation | 174/5968 | 417/18723 | 1.20e-05 | 1.31e-04 | 174 |
| GO:000647020 | Thyroid | PTC | protein dephosphorylation | 123/5968 | 281/18723 | 1.69e-05 | 1.77e-04 | 123 |
| GO:0006470111 | Thyroid | ATC | protein dephosphorylation | 129/6293 | 281/18723 | 1.11e-05 | 1.09e-04 | 129 |
| GO:001631117 | Thyroid | ATC | dephosphorylation | 179/6293 | 417/18723 | 3.88e-05 | 3.15e-04 | 179 |
| Page: 1 |
| Pathway ID | Tissue | Disease Stage | Description | Gene Ratio | Bg Ratio | pvalue | p.adjust | qvalue | Count |
| Page: 1 |
Top |
Cell-cell communication analysis |
| Identification of potential cell-cell interactions between two cell types and their ligand-receptor pairs for different disease states |
| Ligand | Receptor | LRpair | Pathway | Tissue | Disease Stage |
| Page: 1 |
Top |
Single-cell gene regulatory network inference analysis |
| Find out the significant the regulons (TFs) and the target genes of each regulon across cell types for different disease states |
| TF | Cell Type | Tissue | Disease Stage | Target Gene | RSS | Regulon Activity |
| ∗The dot plots of a searched regulon are shown for all cell subpopulations in each disease state of each tissue based on the regulon specific score inferred using pySCENIC and by calculating the average expression. |
| Page: 1 |
Top |
Somatic mutation of malignant transformation related genes |
| Annotation of somatic variants for genes involved in malignant transformation |
| Hugo Symbol | Variant Class | Variant Classification | dbSNP RS | HGVSc | HGVSp | HGVSp Short | SWISSPROT | BIOTYPE | SIFT | PolyPhen | Tumor Sample Barcode | Tissue | Histology | Sex | Age | Stage | Therapy Types | Drugs | Outcome |
| ILKAP | SNV | Missense_Mutation | novel | c.738N>T | p.Glu246Asp | p.E246D | Q9H0C8 | protein_coding | tolerated(0.24) | benign(0.01) | TCGA-VQ-A8P2-01 | Stomach | stomach adenocarcinoma | Male | >=65 | III/IV | Unspecific | Complete Response | |
| ILKAP | SNV | Missense_Mutation | novel | c.160N>A | p.Ala54Thr | p.A54T | Q9H0C8 | protein_coding | tolerated(0.18) | benign(0.101) | TCGA-VQ-A8P2-01 | Stomach | stomach adenocarcinoma | Male | >=65 | III/IV | Unspecific | Complete Response | |
| ILKAP | SNV | Missense_Mutation | novel | c.856N>A | p.Val286Met | p.V286M | Q9H0C8 | protein_coding | deleterious(0) | probably_damaging(0.986) | TCGA-VQ-A8PB-01 | Stomach | stomach adenocarcinoma | Female | >=65 | I/II | Chemotherapy | fluorouracil | CR |
| Page: 1 2 3 4 5 |
Top |
Related drugs of malignant transformation related genes |
| Identification of chemicals and drugs interact with genes involved in malignant transfromation |
| (DGIdb 4.0) |
| Entrez ID | Symbol | Category | Interaction Types | Drug Claim Name | Drug Name | PMIDs |
| 80895 | ILKAP | KINASE | hydrochlorothiazide | HYDROCHLOROTHIAZIDE |
| Page: 1 |

Copyright 2023-Present -The University of Texas Health Science Center at Houston |