
|
|||||
|
 | |
| |
| |
| |
| |
| |
|
Gene: GNA15 |
Gene summary for GNA15 |
| Gene information | Species | Human | Gene symbol | GNA15 | Gene ID | 2769 |
| Gene name | G protein subunit alpha 15 | |
| Gene Alias | GNA16 | |
| Cytomap | 19p13.3 | |
| Gene Type | protein-coding | GO ID | GO:0001508 | UniProtAcc | P30679 |
Top |
Malignant transformation analysis |
| Identification of the aberrant gene expression in precancerous and cancerous lesions by comparing the gene expression of stem-like cells in diseased tissues with normal stem cells |
| Entrez ID | Symbol | Replicates | Species | Organ | Tissue | Adj P-value | Log2FC | Malignancy |
| 2769 | GNA15 | LZE4T | Human | Esophagus | ESCC | 1.11e-07 | 3.01e-01 | 0.0811 |
| 2769 | GNA15 | LZE5T | Human | Esophagus | ESCC | 5.22e-03 | 1.77e-01 | 0.0514 |
| 2769 | GNA15 | LZE8T | Human | Esophagus | ESCC | 5.71e-09 | 4.87e-01 | 0.067 |
| 2769 | GNA15 | LZE24T | Human | Esophagus | ESCC | 1.27e-09 | 3.13e-01 | 0.0596 |
| 2769 | GNA15 | LZE21T | Human | Esophagus | ESCC | 1.61e-08 | 4.17e-01 | 0.0655 |
| 2769 | GNA15 | LZE6T | Human | Esophagus | ESCC | 1.04e-06 | 4.36e-01 | 0.0845 |
| 2769 | GNA15 | P1T-E | Human | Esophagus | ESCC | 1.69e-10 | 8.13e-01 | 0.0875 |
| 2769 | GNA15 | P2T-E | Human | Esophagus | ESCC | 9.89e-07 | 5.52e-02 | 0.1177 |
| 2769 | GNA15 | P4T-E | Human | Esophagus | ESCC | 1.20e-02 | 1.79e-01 | 0.1323 |
| 2769 | GNA15 | P5T-E | Human | Esophagus | ESCC | 2.63e-14 | 3.67e-01 | 0.1327 |
| 2769 | GNA15 | P8T-E | Human | Esophagus | ESCC | 1.62e-15 | 4.93e-01 | 0.0889 |
| 2769 | GNA15 | P9T-E | Human | Esophagus | ESCC | 4.70e-06 | 3.21e-01 | 0.1131 |
| 2769 | GNA15 | P11T-E | Human | Esophagus | ESCC | 9.57e-11 | 7.81e-01 | 0.1426 |
| 2769 | GNA15 | P17T-E | Human | Esophagus | ESCC | 3.57e-10 | 6.39e-01 | 0.1278 |
| 2769 | GNA15 | P19T-E | Human | Esophagus | ESCC | 9.96e-04 | 1.33e+00 | 0.1662 |
| 2769 | GNA15 | P20T-E | Human | Esophagus | ESCC | 1.95e-16 | 3.27e-01 | 0.1124 |
| 2769 | GNA15 | P21T-E | Human | Esophagus | ESCC | 1.65e-41 | 1.08e+00 | 0.1617 |
| 2769 | GNA15 | P22T-E | Human | Esophagus | ESCC | 1.39e-12 | 3.17e-01 | 0.1236 |
| 2769 | GNA15 | P23T-E | Human | Esophagus | ESCC | 2.59e-21 | 7.26e-01 | 0.108 |
| 2769 | GNA15 | P24T-E | Human | Esophagus | ESCC | 8.95e-13 | 4.32e-01 | 0.1287 |
| Page: 1 2 3 4 5 |
| Tissue | Expression Dynamics | Abbreviation |
| Esophagus | 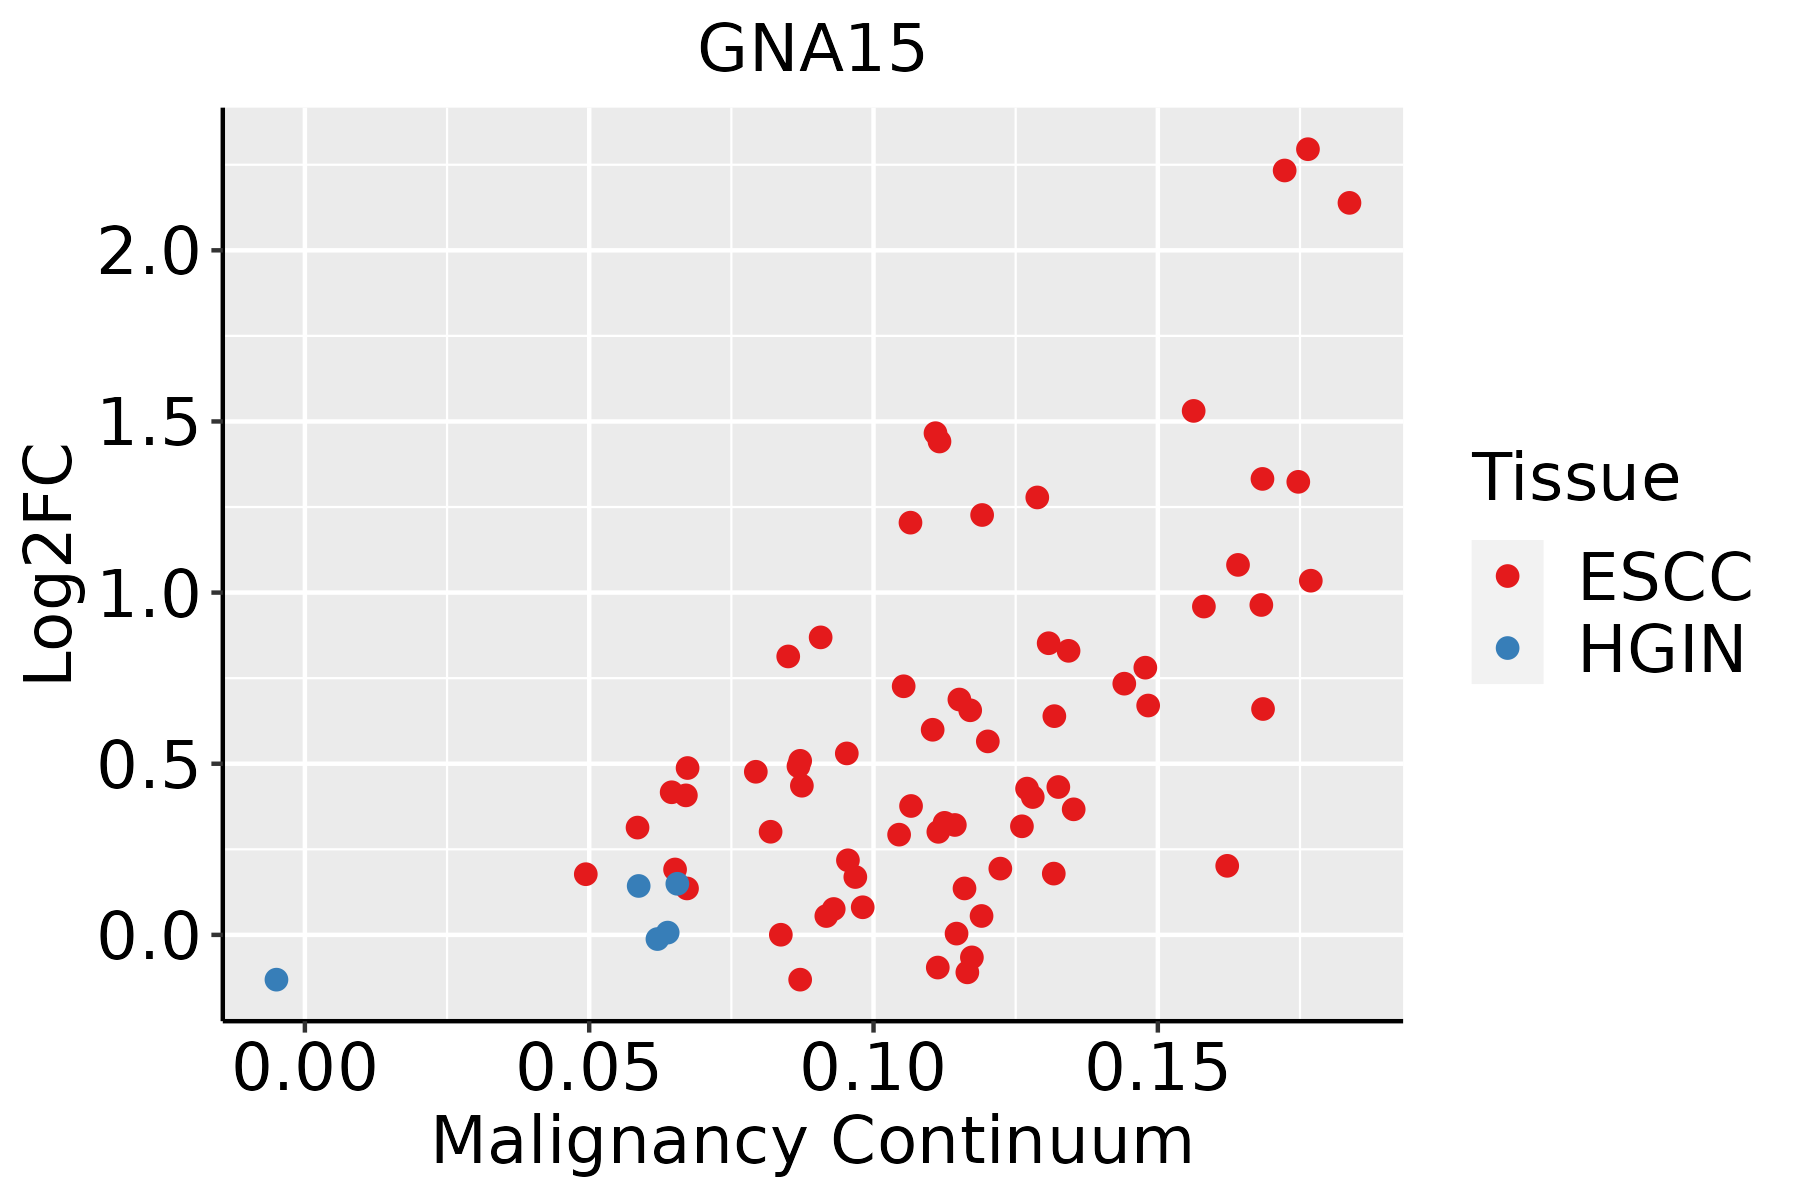 | ESCC: Esophageal squamous cell carcinoma |
| HGIN: High-grade intraepithelial neoplasias | ||
| LGIN: Low-grade intraepithelial neoplasias | ||
| Oral Cavity | 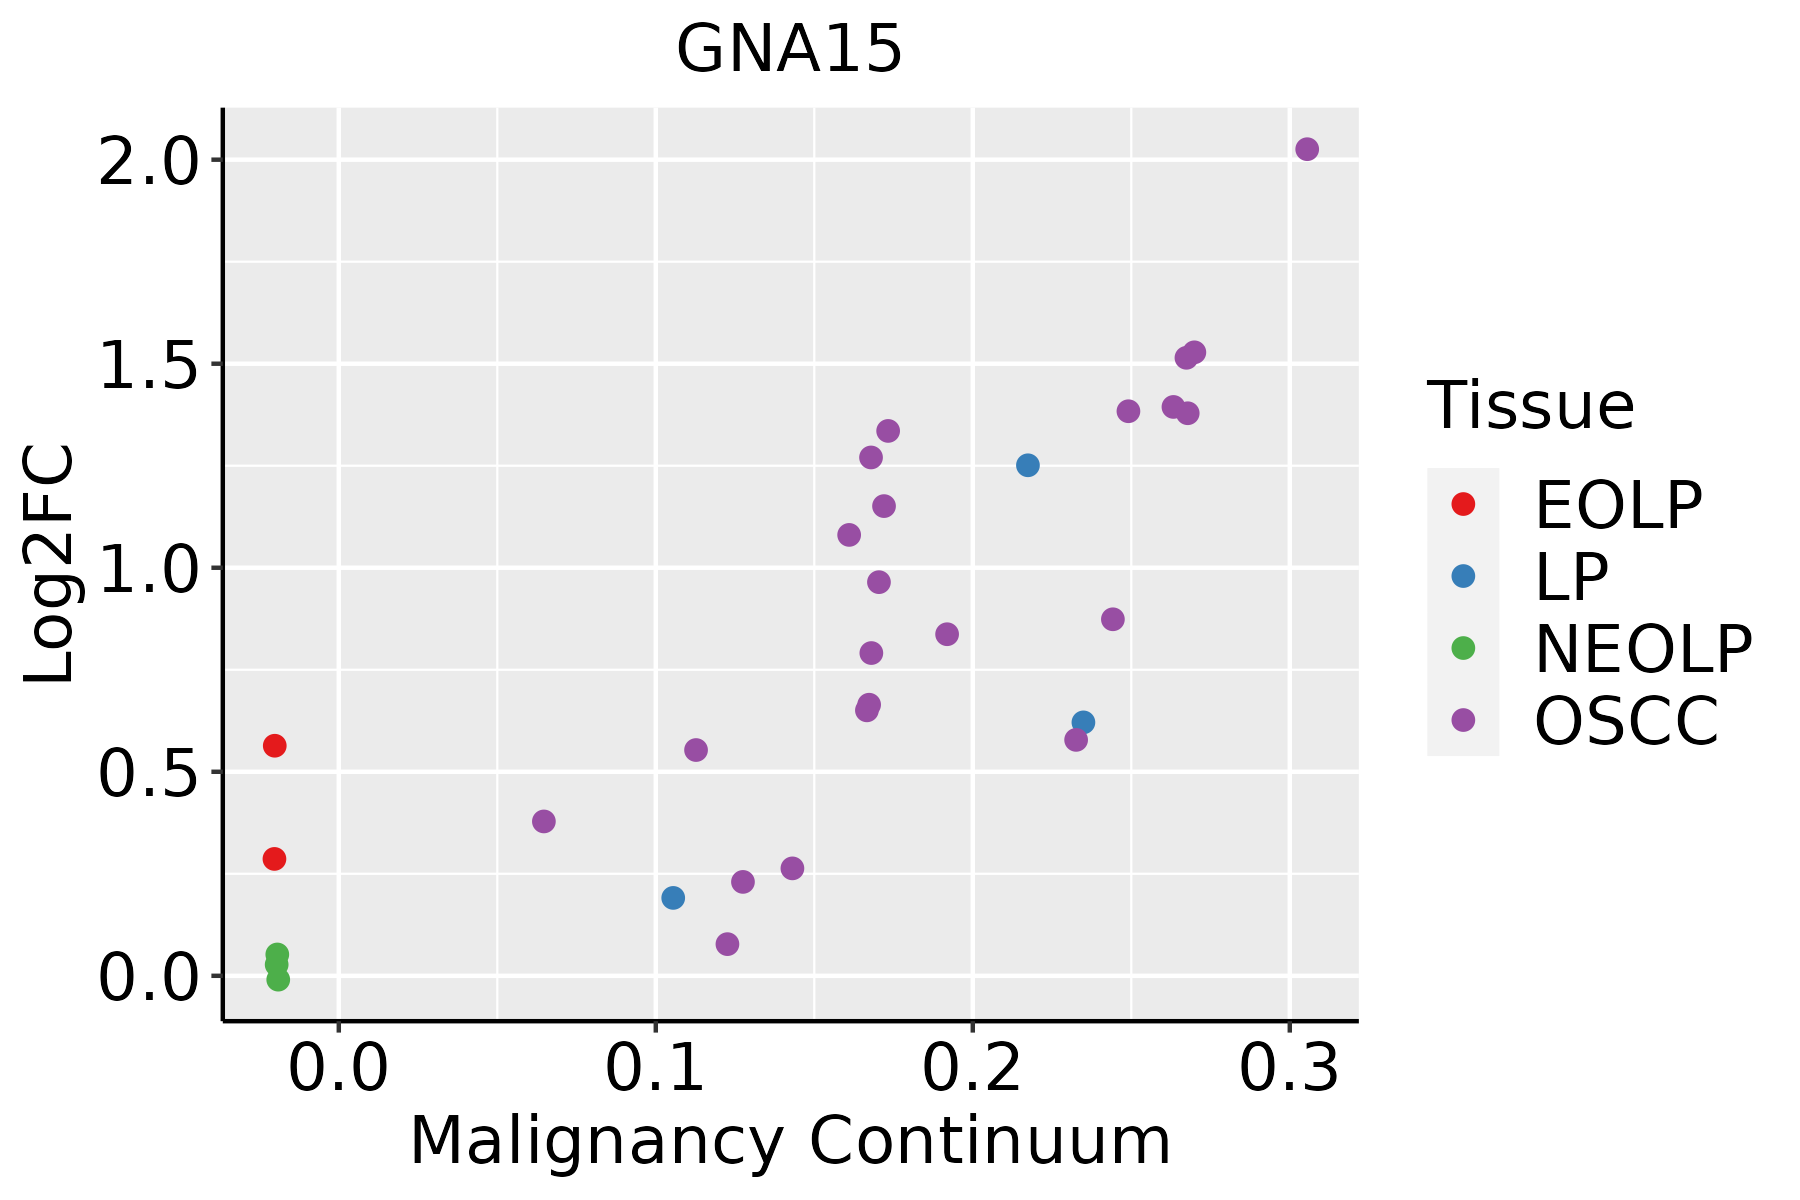 | EOLP: Erosive Oral lichen planus |
| LP: leukoplakia | ||
| NEOLP: Non-erosive oral lichen planus | ||
| OSCC: Oral squamous cell carcinoma | ||
| Skin | 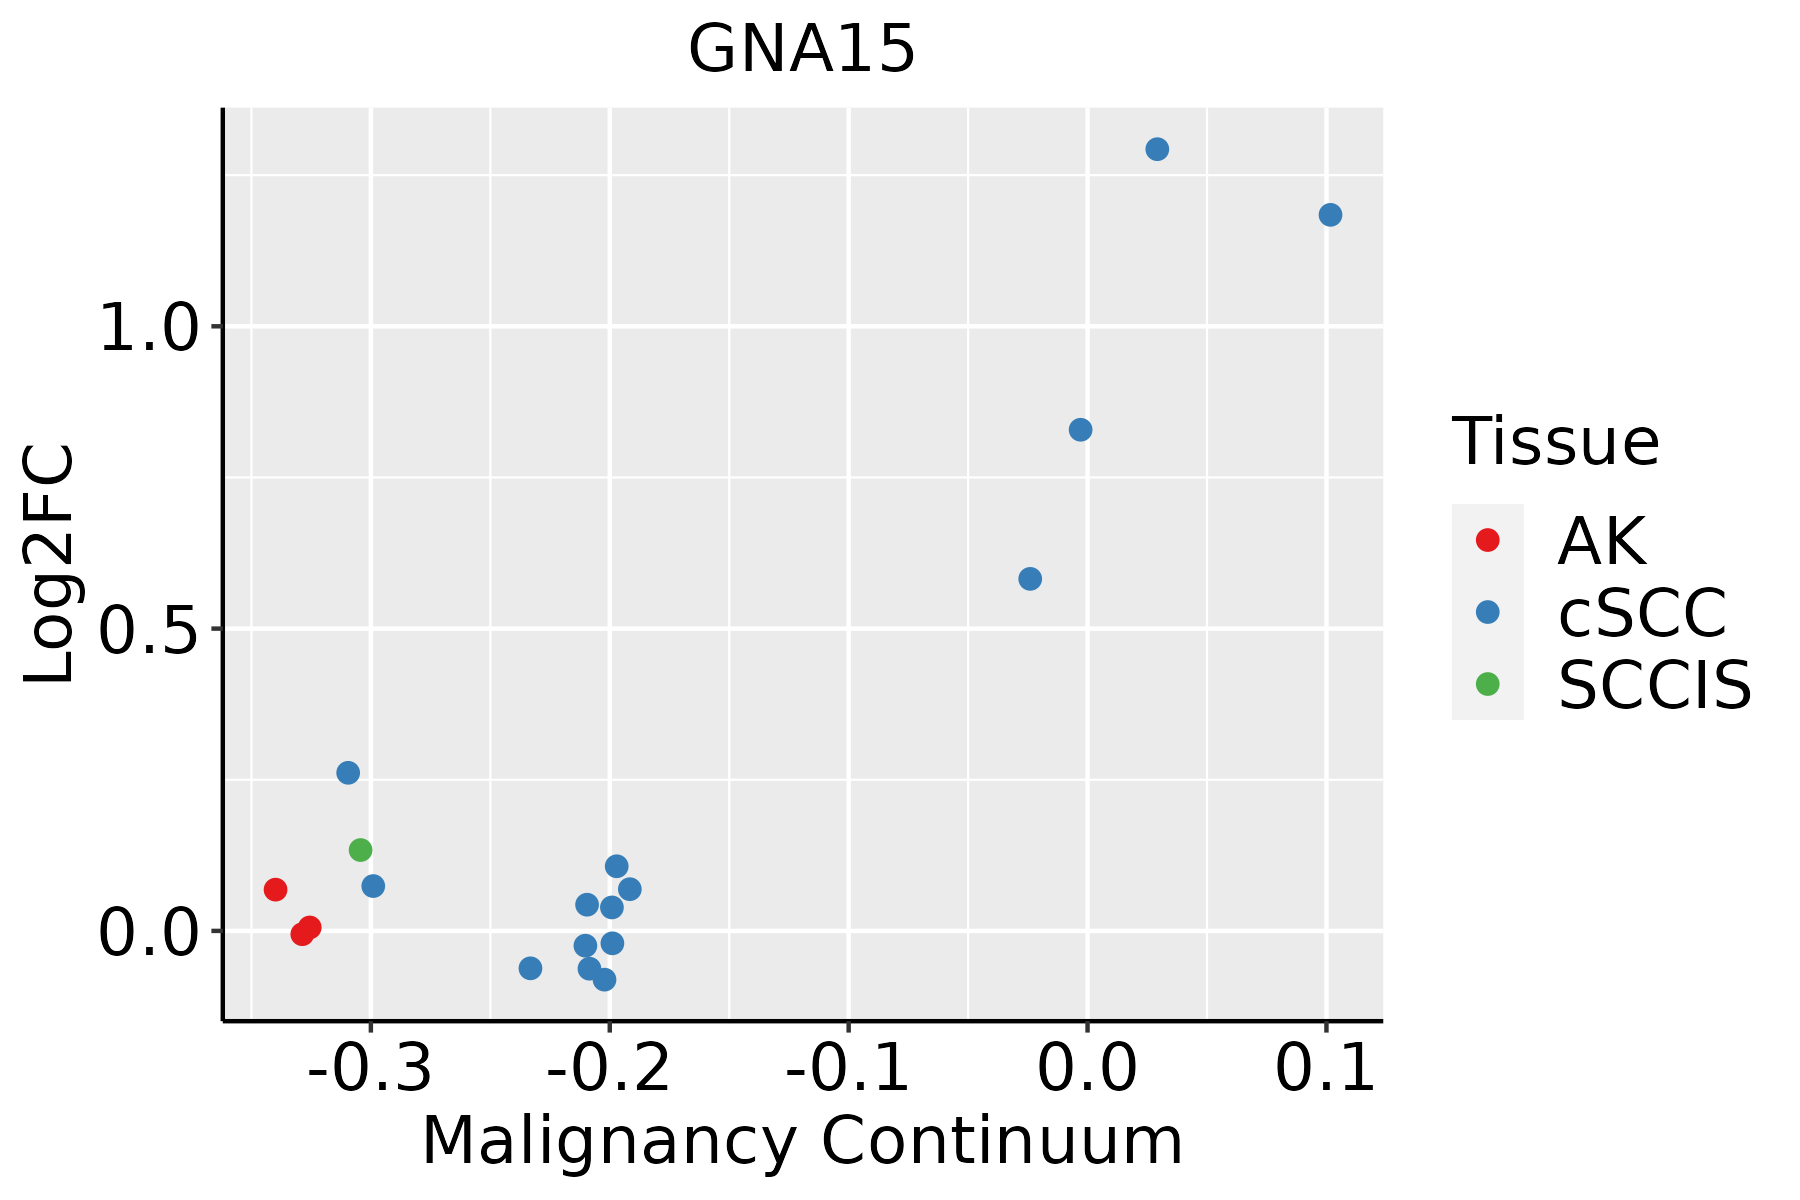 | AK: Actinic keratosis |
| cSCC: Cutaneous squamous cell carcinoma | ||
| SCCIS:squamous cell carcinoma in situ |
| ∗log2FC in expression of this searched gene in stem-like cells from each diseased tissue sample relative to stem-like cells in normal samples in each tissue plotted against the malignancy continuum. Samples are colored based on if they are from different disease stage. |
Top |
Malignant transformation related pathway analysis |
| Find out the enriched GO biological processes and KEGG pathways involved in transition from healthy to precancer to cancer |
| Tissue | Disease Stage | Enriched GO biological Processes |
| Colorectum | AD |  |
| Colorectum | SER |  |
| Colorectum | MSS |  |
| Colorectum | MSI-H |  |
| Colorectum | FAP |  |
| ∗Top 15 enriched GO BP terms are showed in the bar plot of each disease state in each tissue. Each row represents a significant GO biological process which is colored according to the -log10(p.adjust). |
| Page: 1 2 3 4 5 6 7 8 9 |
| GO ID | Tissue | Disease Stage | Description | Gene Ratio | Bg Ratio | pvalue | p.adjust | Count |
| GO:00725032 | Oral cavity | EOLP | cellular divalent inorganic cation homeostasis | 75/2218 | 486/18723 | 9.77e-03 | 4.42e-02 | 75 |
| Page: 1 |
| Pathway ID | Tissue | Disease Stage | Description | Gene Ratio | Bg Ratio | pvalue | p.adjust | qvalue | Count |
| hsa049268 | Esophagus | ESCC | Relaxin signaling pathway | 81/4205 | 129/8465 | 1.72e-03 | 5.09e-03 | 2.61e-03 | 81 |
| hsa051425 | Esophagus | ESCC | Chagas disease | 65/4205 | 102/8465 | 2.81e-03 | 7.59e-03 | 3.89e-03 | 65 |
| hsa0492616 | Esophagus | ESCC | Relaxin signaling pathway | 81/4205 | 129/8465 | 1.72e-03 | 5.09e-03 | 2.61e-03 | 81 |
| hsa0514213 | Esophagus | ESCC | Chagas disease | 65/4205 | 102/8465 | 2.81e-03 | 7.59e-03 | 3.89e-03 | 65 |
| hsa051424 | Oral cavity | OSCC | Chagas disease | 64/3704 | 102/8465 | 8.00e-05 | 2.95e-04 | 1.50e-04 | 64 |
| hsa049267 | Oral cavity | OSCC | Relaxin signaling pathway | 74/3704 | 129/8465 | 1.20e-03 | 3.37e-03 | 1.72e-03 | 74 |
| hsa051468 | Oral cavity | OSCC | Amoebiasis | 59/3704 | 102/8465 | 2.78e-03 | 7.17e-03 | 3.65e-03 | 59 |
| hsa0514212 | Oral cavity | OSCC | Chagas disease | 64/3704 | 102/8465 | 8.00e-05 | 2.95e-04 | 1.50e-04 | 64 |
| hsa0492615 | Oral cavity | OSCC | Relaxin signaling pathway | 74/3704 | 129/8465 | 1.20e-03 | 3.37e-03 | 1.72e-03 | 74 |
| hsa0514615 | Oral cavity | OSCC | Amoebiasis | 59/3704 | 102/8465 | 2.78e-03 | 7.17e-03 | 3.65e-03 | 59 |
| hsa0514221 | Oral cavity | EOLP | Chagas disease | 28/1218 | 102/8465 | 4.05e-04 | 1.64e-03 | 9.65e-04 | 28 |
| hsa0514623 | Oral cavity | EOLP | Amoebiasis | 26/1218 | 102/8465 | 2.09e-03 | 7.03e-03 | 4.15e-03 | 26 |
| hsa0492622 | Oral cavity | EOLP | Relaxin signaling pathway | 30/1218 | 129/8465 | 4.48e-03 | 1.42e-02 | 8.37e-03 | 30 |
| hsa051423 | Oral cavity | EOLP | Chagas disease | 28/1218 | 102/8465 | 4.05e-04 | 1.64e-03 | 9.65e-04 | 28 |
| hsa0514633 | Oral cavity | EOLP | Amoebiasis | 26/1218 | 102/8465 | 2.09e-03 | 7.03e-03 | 4.15e-03 | 26 |
| hsa0492631 | Oral cavity | EOLP | Relaxin signaling pathway | 30/1218 | 129/8465 | 4.48e-03 | 1.42e-02 | 8.37e-03 | 30 |
| Page: 1 |
Top |
Cell-cell communication analysis |
| Identification of potential cell-cell interactions between two cell types and their ligand-receptor pairs for different disease states |
| Ligand | Receptor | LRpair | Pathway | Tissue | Disease Stage |
| Page: 1 |
Top |
Single-cell gene regulatory network inference analysis |
| Find out the significant the regulons (TFs) and the target genes of each regulon across cell types for different disease states |
| TF | Cell Type | Tissue | Disease Stage | Target Gene | RSS | Regulon Activity |
| ∗The dot plots of a searched regulon are shown for all cell subpopulations in each disease state of each tissue based on the regulon specific score inferred using pySCENIC and by calculating the average expression. |
| Page: 1 |
Top |
Somatic mutation of malignant transformation related genes |
| Annotation of somatic variants for genes involved in malignant transformation |
| Hugo Symbol | Variant Class | Variant Classification | dbSNP RS | HGVSc | HGVSp | HGVSp Short | SWISSPROT | BIOTYPE | SIFT | PolyPhen | Tumor Sample Barcode | Tissue | Histology | Sex | Age | Stage | Therapy Types | Drugs | Outcome |
| GNA15 | SNV | Missense_Mutation | novel | c.917A>T | p.Glu306Val | p.E306V | P30679 | protein_coding | tolerated(0.13) | benign(0.444) | TCGA-VQ-A8PC-01 | Stomach | stomach adenocarcinoma | Male | >=65 | III/IV | Unknown | Unknown | PD |
| GNA15 | SNV | Missense_Mutation | rs764000592 | c.1057N>T | p.Arg353Cys | p.R353C | P30679 | protein_coding | deleterious(0.01) | probably_damaging(0.992) | TCGA-VQ-A91D-01 | Stomach | stomach adenocarcinoma | Male | >=65 | III/IV | Chemotherapy | fluorouracil | PD |
| Page: 1 2 3 4 5 |
Top |
Related drugs of malignant transformation related genes |
| Identification of chemicals and drugs interact with genes involved in malignant transfromation |
| (DGIdb 4.0) |
| Entrez ID | Symbol | Category | Interaction Types | Drug Claim Name | Drug Name | PMIDs |
| Page: 1 |

Copyright 2023-Present -The University of Texas Health Science Center at Houston |