
|
|||||
|
 | |
| |
| |
| |
| |
| |
|
Gene: GMPR |
Gene summary for GMPR |
| Gene information | Species | Human | Gene symbol | GMPR | Gene ID | 2766 |
| Gene name | guanosine monophosphate reductase | |
| Gene Alias | GMPR 1 | |
| Cytomap | 6p22.3 | |
| Gene Type | protein-coding | GO ID | GO:0006139 | UniProtAcc | P36959 |
Top |
Malignant transformation analysis |
| Identification of the aberrant gene expression in precancerous and cancerous lesions by comparing the gene expression of stem-like cells in diseased tissues with normal stem cells |
| Entrez ID | Symbol | Replicates | Species | Organ | Tissue | Adj P-value | Log2FC | Malignancy |
| 2766 | GMPR | HTA11_696_2000001011 | Human | Colorectum | AD | 1.80e-05 | 2.11e-01 | -0.1464 |
| 2766 | GMPR | HTA11_1391_2000001011 | Human | Colorectum | AD | 1.82e-04 | 3.06e-01 | -0.059 |
| 2766 | GMPR | HTA11_866_3004761011 | Human | Colorectum | AD | 8.51e-07 | 3.00e-01 | 0.096 |
| 2766 | GMPR | HTA11_4255_2000001011 | Human | Colorectum | SER | 4.56e-03 | 4.73e-01 | 0.0446 |
| 2766 | GMPR | HTA11_10711_2000001011 | Human | Colorectum | AD | 2.10e-04 | 2.80e-01 | 0.0338 |
| 2766 | GMPR | HTA11_7696_3000711011 | Human | Colorectum | AD | 8.75e-15 | 4.20e-01 | 0.0674 |
| 2766 | GMPR | HTA11_99999970781_79442 | Human | Colorectum | MSS | 1.47e-64 | 1.27e+00 | 0.294 |
| 2766 | GMPR | HTA11_99999965062_69753 | Human | Colorectum | MSI-H | 5.53e-06 | 1.20e+00 | 0.3487 |
| 2766 | GMPR | HTA11_99999965104_69814 | Human | Colorectum | MSS | 2.87e-06 | 3.72e-01 | 0.281 |
| 2766 | GMPR | HTA11_99999971662_82457 | Human | Colorectum | MSS | 4.82e-09 | 3.25e-01 | 0.3859 |
| 2766 | GMPR | CRC-3-11773 | Human | Colorectum | CRC | 1.08e-05 | 3.65e-01 | 0.2564 |
| 2766 | GMPR | P2T-E | Human | Esophagus | ESCC | 5.30e-53 | 1.12e+00 | 0.1177 |
| 2766 | GMPR | P10T-E | Human | Esophagus | ESCC | 2.83e-02 | 2.15e-02 | 0.116 |
| 2766 | GMPR | P16T-E | Human | Esophagus | ESCC | 1.34e-07 | 1.22e-01 | 0.1153 |
| 2766 | GMPR | P24T-E | Human | Esophagus | ESCC | 2.50e-07 | 2.26e-01 | 0.1287 |
| 2766 | GMPR | P26T-E | Human | Esophagus | ESCC | 8.67e-03 | 1.17e-01 | 0.1276 |
| 2766 | GMPR | P27T-E | Human | Esophagus | ESCC | 1.41e-02 | 1.60e-01 | 0.1055 |
| 2766 | GMPR | P31T-E | Human | Esophagus | ESCC | 5.62e-06 | 1.26e-01 | 0.1251 |
| 2766 | GMPR | P37T-E | Human | Esophagus | ESCC | 7.77e-03 | 8.01e-02 | 0.1371 |
| 2766 | GMPR | P40T-E | Human | Esophagus | ESCC | 1.22e-05 | 3.37e-01 | 0.109 |
| Page: 1 2 |
| Tissue | Expression Dynamics | Abbreviation |
| Colorectum (GSE201348) |  | FAP: Familial adenomatous polyposis |
| CRC: Colorectal cancer | ||
| Colorectum (HTA11) | 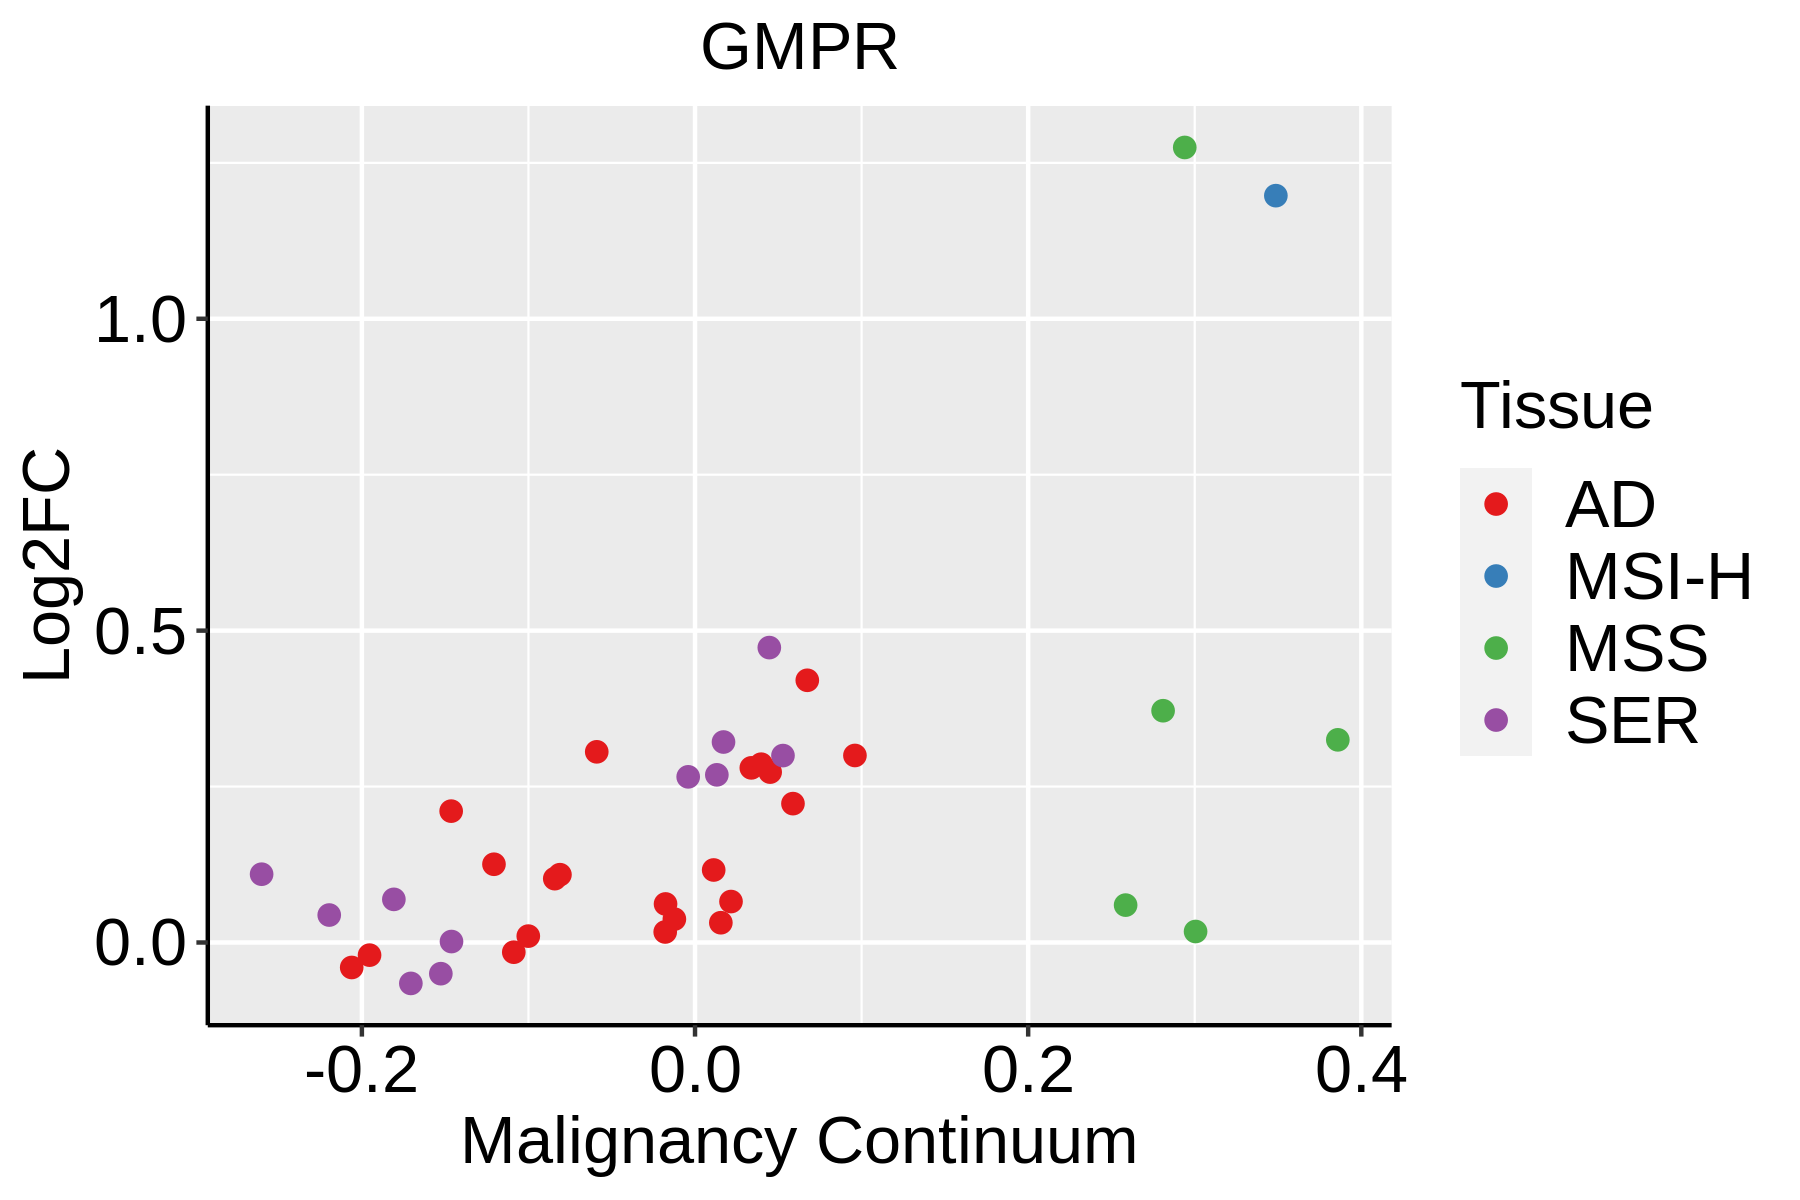 | AD: Adenomas |
| SER: Sessile serrated lesions | ||
| MSI-H: Microsatellite-high colorectal cancer | ||
| MSS: Microsatellite stable colorectal cancer | ||
| Esophagus |  | ESCC: Esophageal squamous cell carcinoma |
| HGIN: High-grade intraepithelial neoplasias | ||
| LGIN: Low-grade intraepithelial neoplasias |
| ∗log2FC in expression of this searched gene in stem-like cells from each diseased tissue sample relative to stem-like cells in normal samples in each tissue plotted against the malignancy continuum. Samples are colored based on if they are from different disease stage. |
Top |
Malignant transformation related pathway analysis |
| Find out the enriched GO biological processes and KEGG pathways involved in transition from healthy to precancer to cancer |
| Tissue | Disease Stage | Enriched GO biological Processes |
| Colorectum | AD |  |
| Colorectum | SER |  |
| Colorectum | MSS |  |
| Colorectum | MSI-H |  |
| Colorectum | FAP |  |
| ∗Top 15 enriched GO BP terms are showed in the bar plot of each disease state in each tissue. Each row represents a significant GO biological process which is colored according to the -log10(p.adjust). |
| Page: 1 2 3 4 5 6 7 8 9 |
| GO ID | Tissue | Disease Stage | Description | Gene Ratio | Bg Ratio | pvalue | p.adjust | Count |
| GO:0006163 | Colorectum | AD | purine nucleotide metabolic process | 149/3918 | 396/18723 | 1.08e-14 | 2.80e-12 | 149 |
| GO:0072521 | Colorectum | AD | purine-containing compound metabolic process | 153/3918 | 416/18723 | 4.34e-14 | 1.01e-11 | 153 |
| GO:0009117 | Colorectum | AD | nucleotide metabolic process | 168/3918 | 489/18723 | 2.20e-12 | 3.36e-10 | 168 |
| GO:0006753 | Colorectum | AD | nucleoside phosphate metabolic process | 169/3918 | 497/18723 | 4.99e-12 | 6.98e-10 | 169 |
| GO:0009409 | Colorectum | AD | response to cold | 22/3918 | 49/18723 | 1.40e-04 | 1.98e-03 | 22 |
| GO:00061631 | Colorectum | SER | purine nucleotide metabolic process | 109/2897 | 396/18723 | 4.26e-10 | 5.44e-08 | 109 |
| GO:00725211 | Colorectum | SER | purine-containing compound metabolic process | 113/2897 | 416/18723 | 4.80e-10 | 5.68e-08 | 113 |
| GO:00091171 | Colorectum | SER | nucleotide metabolic process | 122/2897 | 489/18723 | 2.50e-08 | 1.76e-06 | 122 |
| GO:00067531 | Colorectum | SER | nucleoside phosphate metabolic process | 122/2897 | 497/18723 | 6.64e-08 | 4.33e-06 | 122 |
| GO:00094091 | Colorectum | SER | response to cold | 16/2897 | 49/18723 | 2.11e-03 | 2.06e-02 | 16 |
| GO:00061632 | Colorectum | MSS | purine nucleotide metabolic process | 128/3467 | 396/18723 | 2.04e-11 | 3.02e-09 | 128 |
| GO:00725212 | Colorectum | MSS | purine-containing compound metabolic process | 132/3467 | 416/18723 | 4.13e-11 | 4.86e-09 | 132 |
| GO:00091172 | Colorectum | MSS | nucleotide metabolic process | 144/3467 | 489/18723 | 1.87e-09 | 1.35e-07 | 144 |
| GO:00067532 | Colorectum | MSS | nucleoside phosphate metabolic process | 145/3467 | 497/18723 | 3.25e-09 | 2.23e-07 | 145 |
| GO:00094092 | Colorectum | MSS | response to cold | 19/3467 | 49/18723 | 7.20e-04 | 7.70e-03 | 19 |
| GO:00091173 | Colorectum | MSI-H | nucleotide metabolic process | 53/1319 | 489/18723 | 1.16e-03 | 1.92e-02 | 53 |
| GO:0006144 | Colorectum | MSI-H | purine nucleobase metabolic process | 6/1319 | 19/18723 | 1.48e-03 | 2.23e-02 | 6 |
| GO:00067533 | Colorectum | MSI-H | nucleoside phosphate metabolic process | 53/1319 | 497/18723 | 1.66e-03 | 2.45e-02 | 53 |
| GO:00061633 | Colorectum | MSI-H | purine nucleotide metabolic process | 44/1319 | 396/18723 | 1.81e-03 | 2.61e-02 | 44 |
| GO:00725213 | Colorectum | MSI-H | purine-containing compound metabolic process | 45/1319 | 416/18723 | 2.73e-03 | 3.53e-02 | 45 |
| Page: 1 2 3 4 5 6 7 |
| Pathway ID | Tissue | Disease Stage | Description | Gene Ratio | Bg Ratio | pvalue | p.adjust | qvalue | Count |
| hsa012325 | Esophagus | ESCC | Nucleotide metabolism | 59/4205 | 85/8465 | 1.67e-04 | 6.58e-04 | 3.37e-04 | 59 |
| hsa0123212 | Esophagus | ESCC | Nucleotide metabolism | 59/4205 | 85/8465 | 1.67e-04 | 6.58e-04 | 3.37e-04 | 59 |
| Page: 1 |
Top |
Cell-cell communication analysis |
| Identification of potential cell-cell interactions between two cell types and their ligand-receptor pairs for different disease states |
| Ligand | Receptor | LRpair | Pathway | Tissue | Disease Stage |
| Page: 1 |
Top |
Single-cell gene regulatory network inference analysis |
| Find out the significant the regulons (TFs) and the target genes of each regulon across cell types for different disease states |
| TF | Cell Type | Tissue | Disease Stage | Target Gene | RSS | Regulon Activity |
| ∗The dot plots of a searched regulon are shown for all cell subpopulations in each disease state of each tissue based on the regulon specific score inferred using pySCENIC and by calculating the average expression. |
| Page: 1 |
Top |
Somatic mutation of malignant transformation related genes |
| Annotation of somatic variants for genes involved in malignant transformation |
| Hugo Symbol | Variant Class | Variant Classification | dbSNP RS | HGVSc | HGVSp | HGVSp Short | SWISSPROT | BIOTYPE | SIFT | PolyPhen | Tumor Sample Barcode | Tissue | Histology | Sex | Age | Stage | Therapy Types | Drugs | Outcome |
| GMPR | SNV | Missense_Mutation | rs148307161 | c.737N>T | p.Ser246Leu | p.S246L | P36959 | protein_coding | deleterious(0) | probably_damaging(0.948) | TCGA-VQ-A922-01 | Stomach | stomach adenocarcinoma | Male | >=65 | III/IV | Chemotherapy | fluorouracil | PD |
| Page: 1 2 3 4 5 |
Top |
Related drugs of malignant transformation related genes |
| Identification of chemicals and drugs interact with genes involved in malignant transfromation |
| (DGIdb 4.0) |
| Entrez ID | Symbol | Category | Interaction Types | Drug Claim Name | Drug Name | PMIDs |
| Page: 1 |

Copyright 2023-Present -The University of Texas Health Science Center at Houston |