
|
|||||
|
 | |
| |
| |
| |
| |
| |
|
Gene: FBXO9 |
Gene summary for FBXO9 |
| Gene information | Species | Human | Gene symbol | FBXO9 | Gene ID | 26268 |
| Gene name | F-box protein 9 | |
| Gene Alias | FBX9 | |
| Cytomap | 6p12.1 | |
| Gene Type | protein-coding | GO ID | GO:0002376 | UniProtAcc | Q9UK97 |
Top |
Malignant transformation analysis |
| Identification of the aberrant gene expression in precancerous and cancerous lesions by comparing the gene expression of stem-like cells in diseased tissues with normal stem cells |
| Entrez ID | Symbol | Replicates | Species | Organ | Tissue | Adj P-value | Log2FC | Malignancy |
| 26268 | FBXO9 | LZE2T | Human | Esophagus | ESCC | 6.31e-03 | 1.13e+00 | 0.082 |
| 26268 | FBXO9 | LZE4T | Human | Esophagus | ESCC | 1.23e-12 | 5.47e-01 | 0.0811 |
| 26268 | FBXO9 | LZE5T | Human | Esophagus | ESCC | 4.46e-06 | 3.71e-01 | 0.0514 |
| 26268 | FBXO9 | LZE7T | Human | Esophagus | ESCC | 1.34e-12 | 6.79e-01 | 0.0667 |
| 26268 | FBXO9 | LZE8T | Human | Esophagus | ESCC | 4.90e-07 | 8.13e-02 | 0.067 |
| 26268 | FBXO9 | LZE20T | Human | Esophagus | ESCC | 7.40e-09 | 2.52e-01 | 0.0662 |
| 26268 | FBXO9 | LZE21D1 | Human | Esophagus | HGIN | 9.28e-04 | 2.11e-01 | 0.0632 |
| 26268 | FBXO9 | LZE22T | Human | Esophagus | ESCC | 6.67e-03 | 4.88e-01 | 0.068 |
| 26268 | FBXO9 | LZE24T | Human | Esophagus | ESCC | 8.75e-19 | 5.65e-01 | 0.0596 |
| 26268 | FBXO9 | LZE6T | Human | Esophagus | ESCC | 2.29e-05 | 3.84e-01 | 0.0845 |
| 26268 | FBXO9 | P1T-E | Human | Esophagus | ESCC | 2.69e-12 | 6.69e-01 | 0.0875 |
| 26268 | FBXO9 | P2T-E | Human | Esophagus | ESCC | 9.83e-31 | 4.55e-01 | 0.1177 |
| 26268 | FBXO9 | P4T-E | Human | Esophagus | ESCC | 7.61e-32 | 7.88e-01 | 0.1323 |
| 26268 | FBXO9 | P5T-E | Human | Esophagus | ESCC | 3.76e-17 | 1.45e-01 | 0.1327 |
| 26268 | FBXO9 | P8T-E | Human | Esophagus | ESCC | 3.07e-23 | 3.38e-01 | 0.0889 |
| 26268 | FBXO9 | P9T-E | Human | Esophagus | ESCC | 3.73e-18 | 4.33e-01 | 0.1131 |
| 26268 | FBXO9 | P10T-E | Human | Esophagus | ESCC | 1.87e-24 | 4.89e-01 | 0.116 |
| 26268 | FBXO9 | P11T-E | Human | Esophagus | ESCC | 2.68e-11 | 6.78e-01 | 0.1426 |
| 26268 | FBXO9 | P12T-E | Human | Esophagus | ESCC | 2.93e-40 | 7.10e-01 | 0.1122 |
| 26268 | FBXO9 | P15T-E | Human | Esophagus | ESCC | 2.38e-19 | 5.10e-01 | 0.1149 |
| Page: 1 2 3 4 5 6 |
| Tissue | Expression Dynamics | Abbreviation |
| Esophagus | 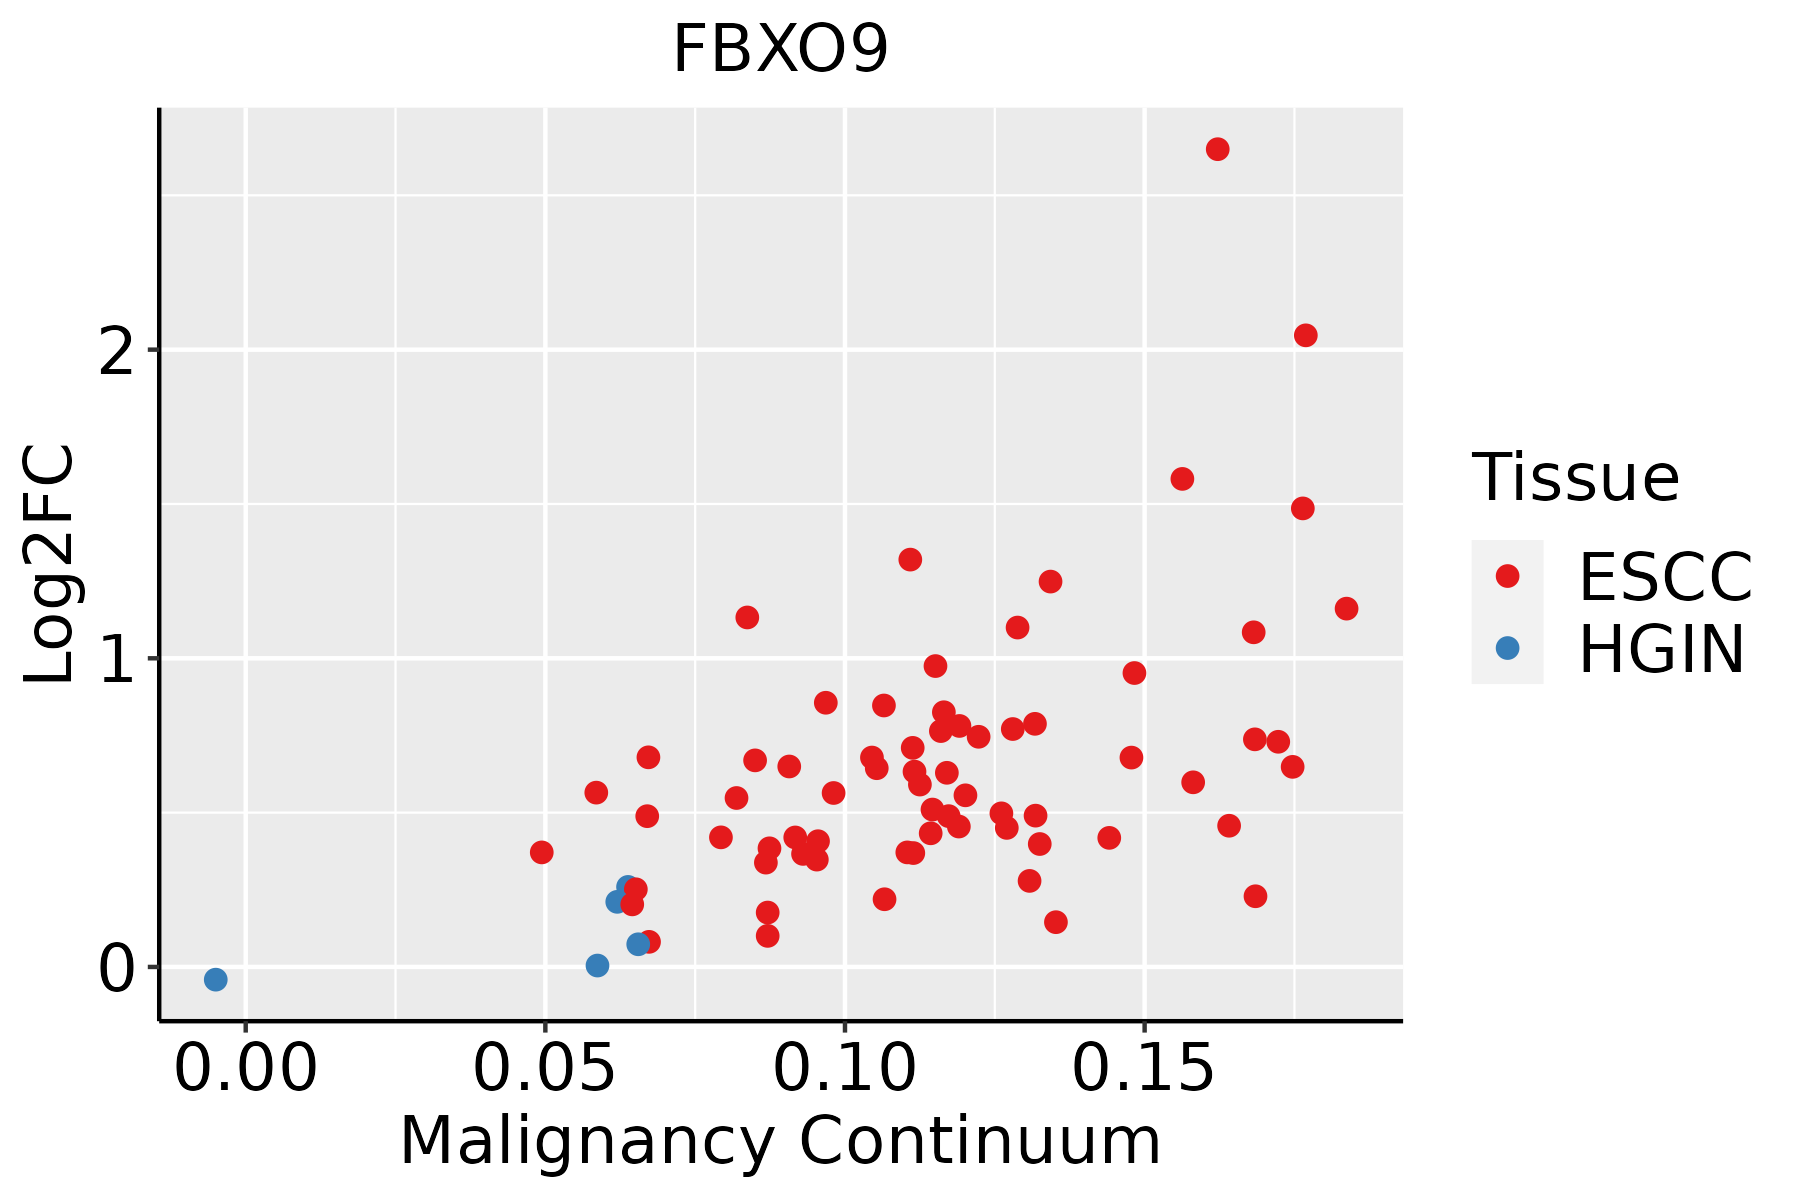 | ESCC: Esophageal squamous cell carcinoma |
| HGIN: High-grade intraepithelial neoplasias | ||
| LGIN: Low-grade intraepithelial neoplasias | ||
| Liver | 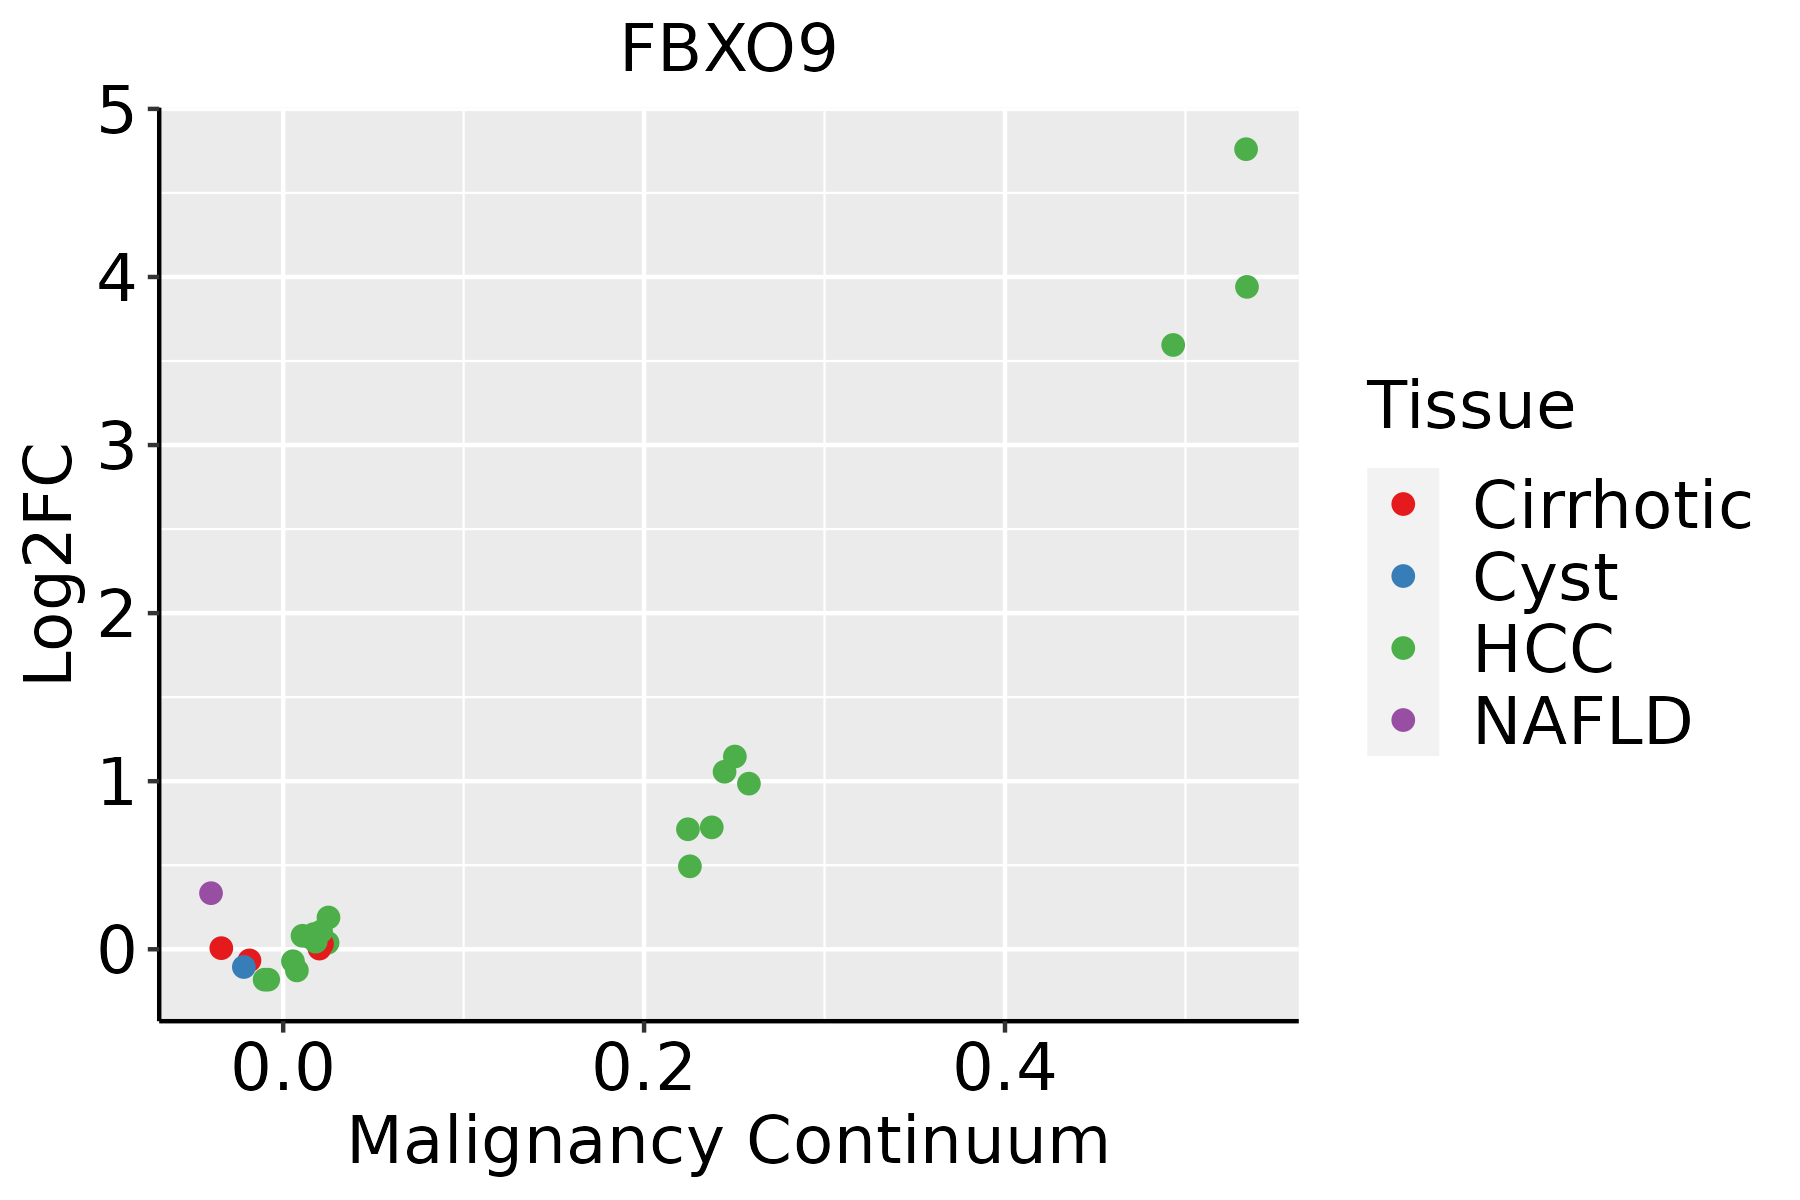 | HCC: Hepatocellular carcinoma |
| NAFLD: Non-alcoholic fatty liver disease | ||
| Oral Cavity | 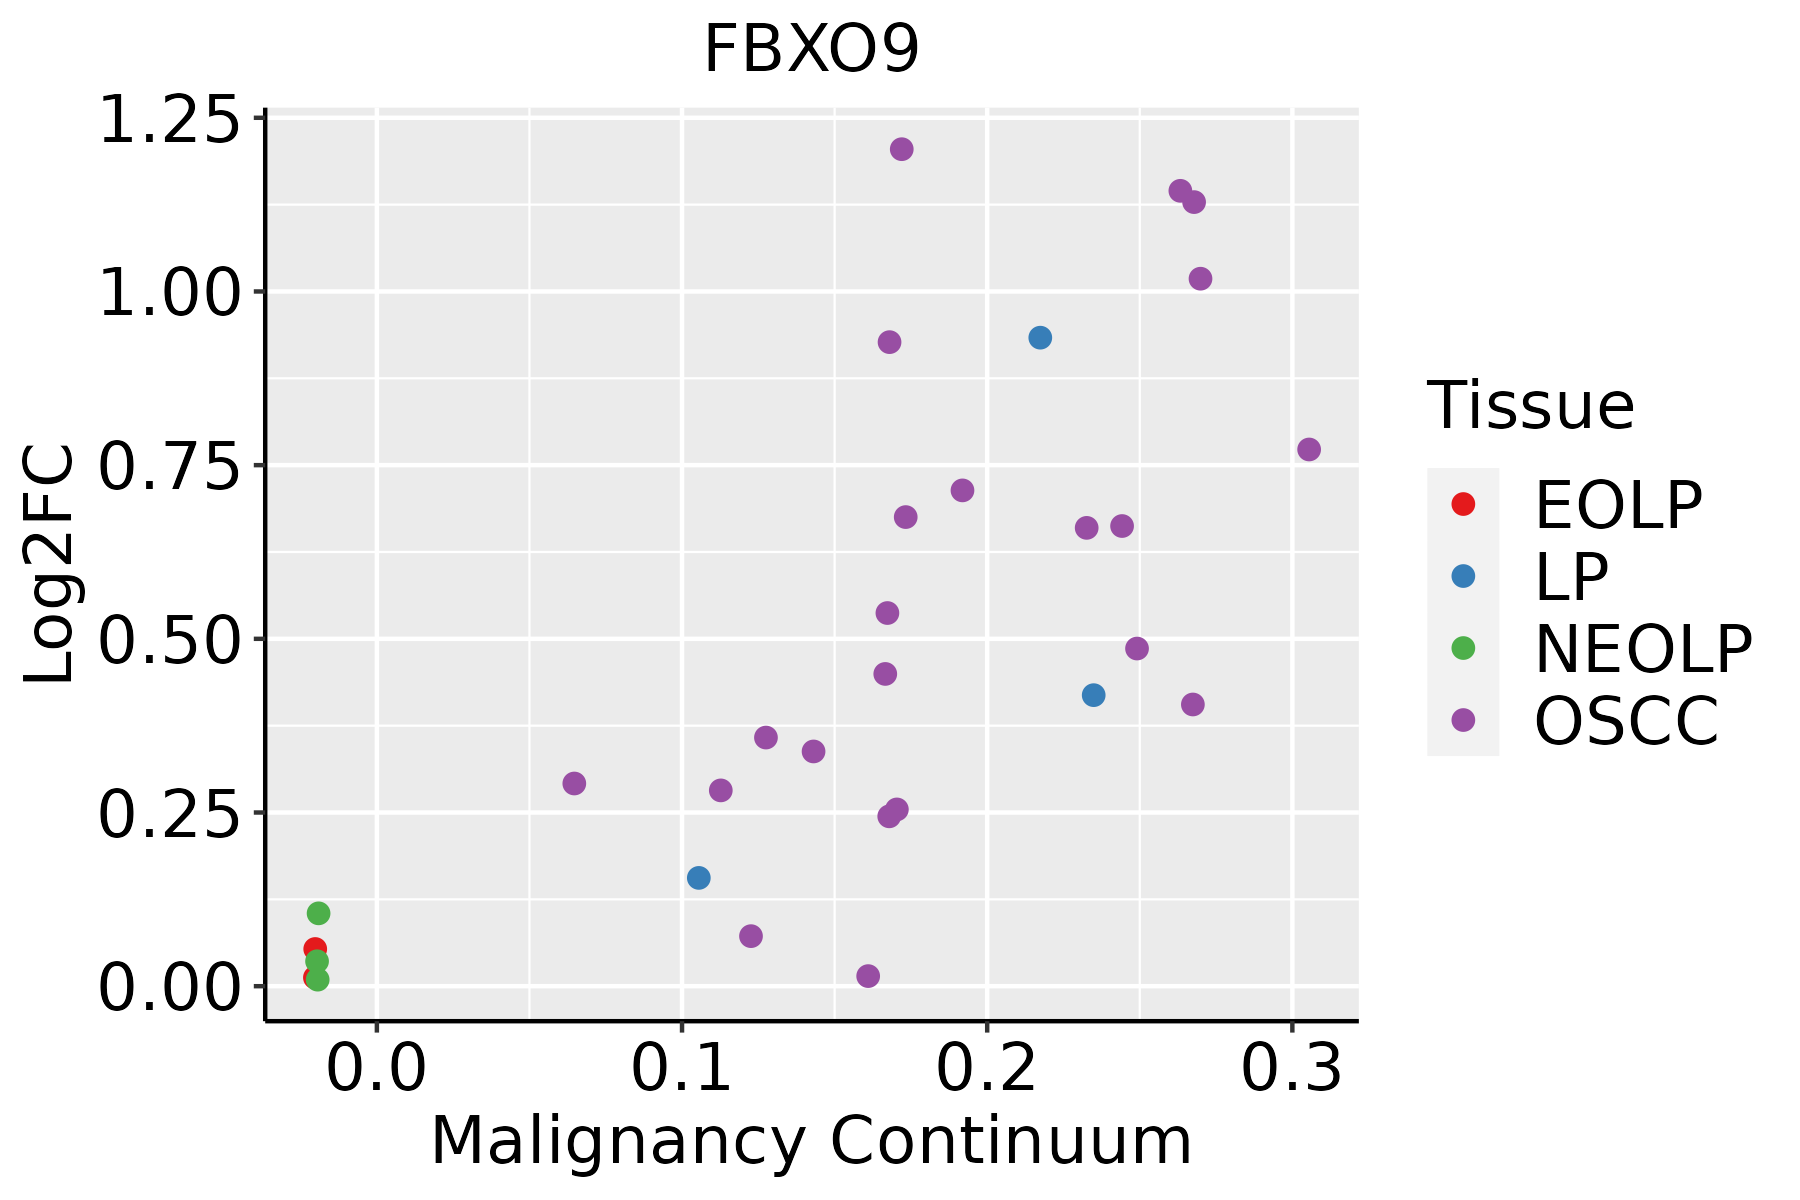 | EOLP: Erosive Oral lichen planus |
| LP: leukoplakia | ||
| NEOLP: Non-erosive oral lichen planus | ||
| OSCC: Oral squamous cell carcinoma | ||
| Prostate | 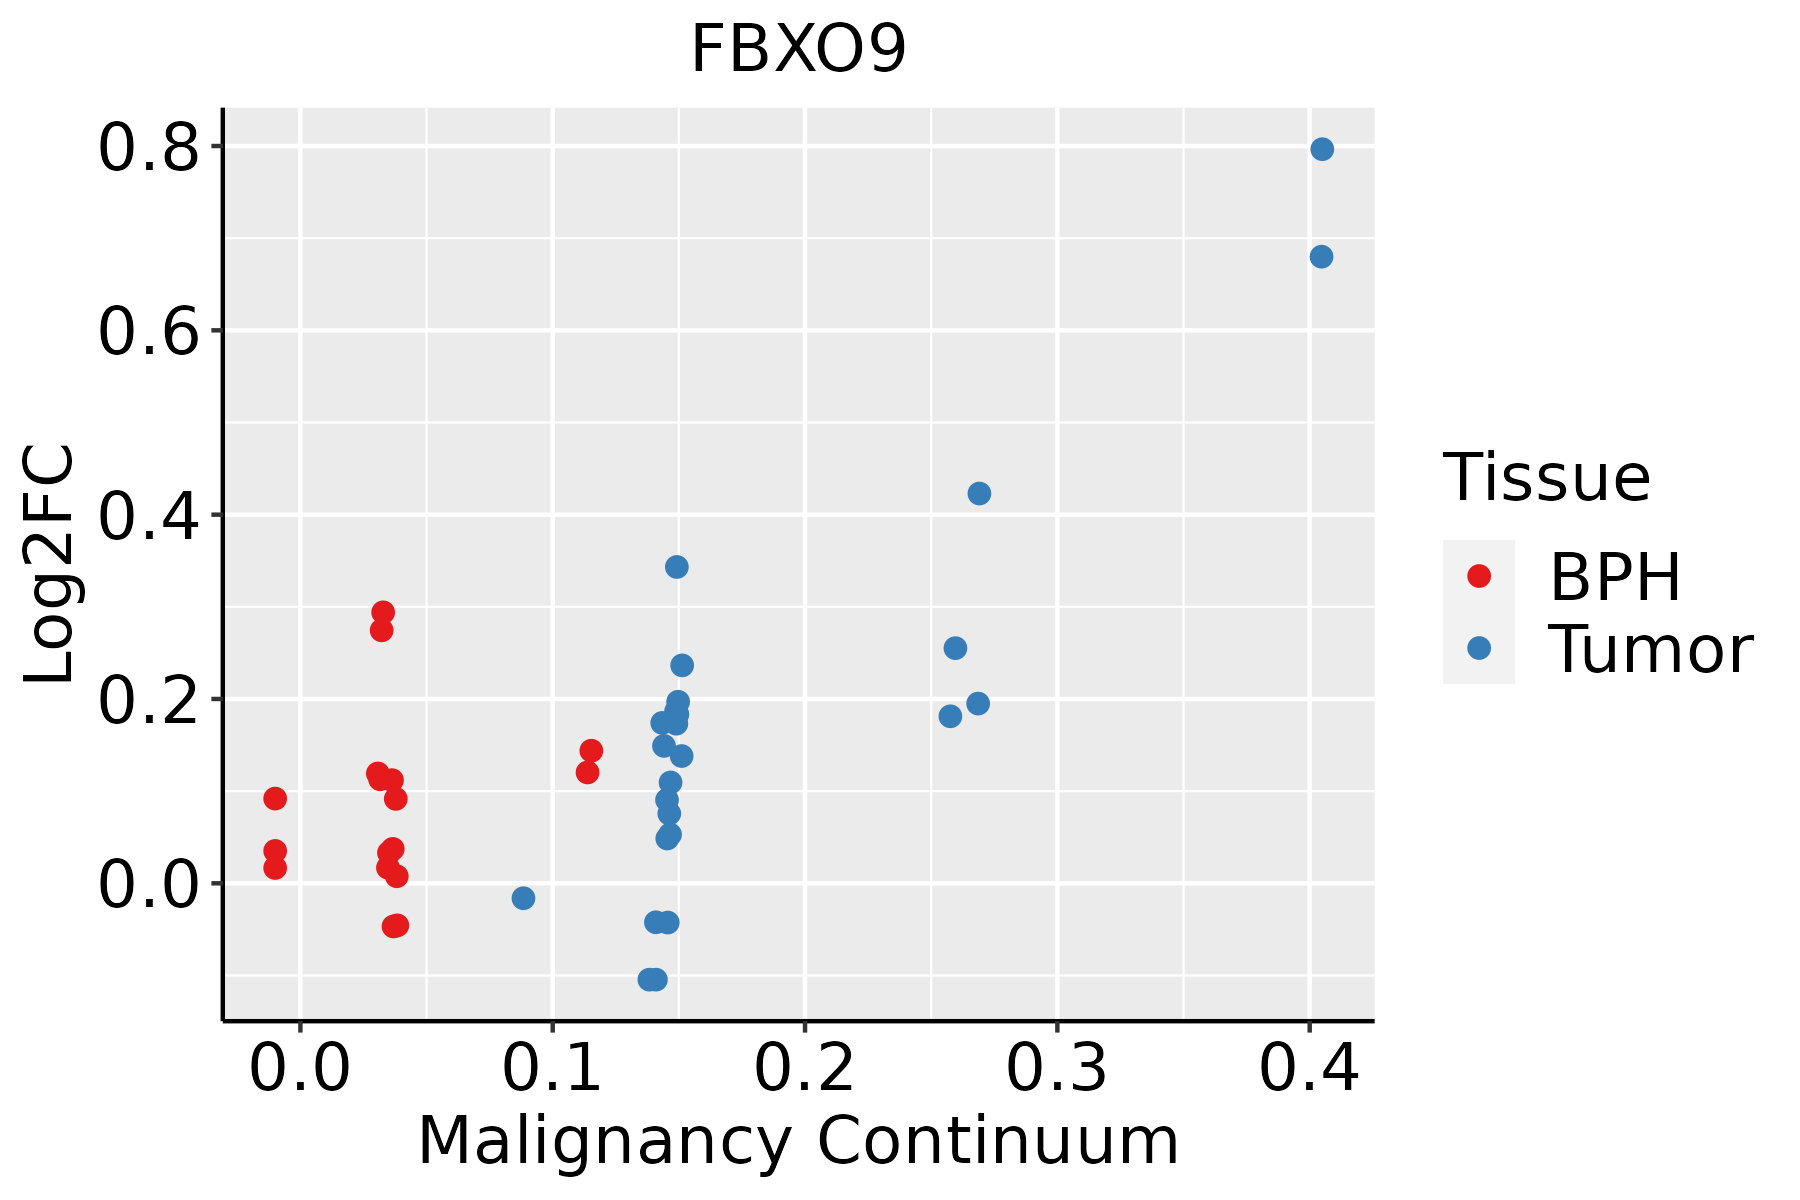 | BPH: Benign Prostatic Hyperplasia |
| Skin | 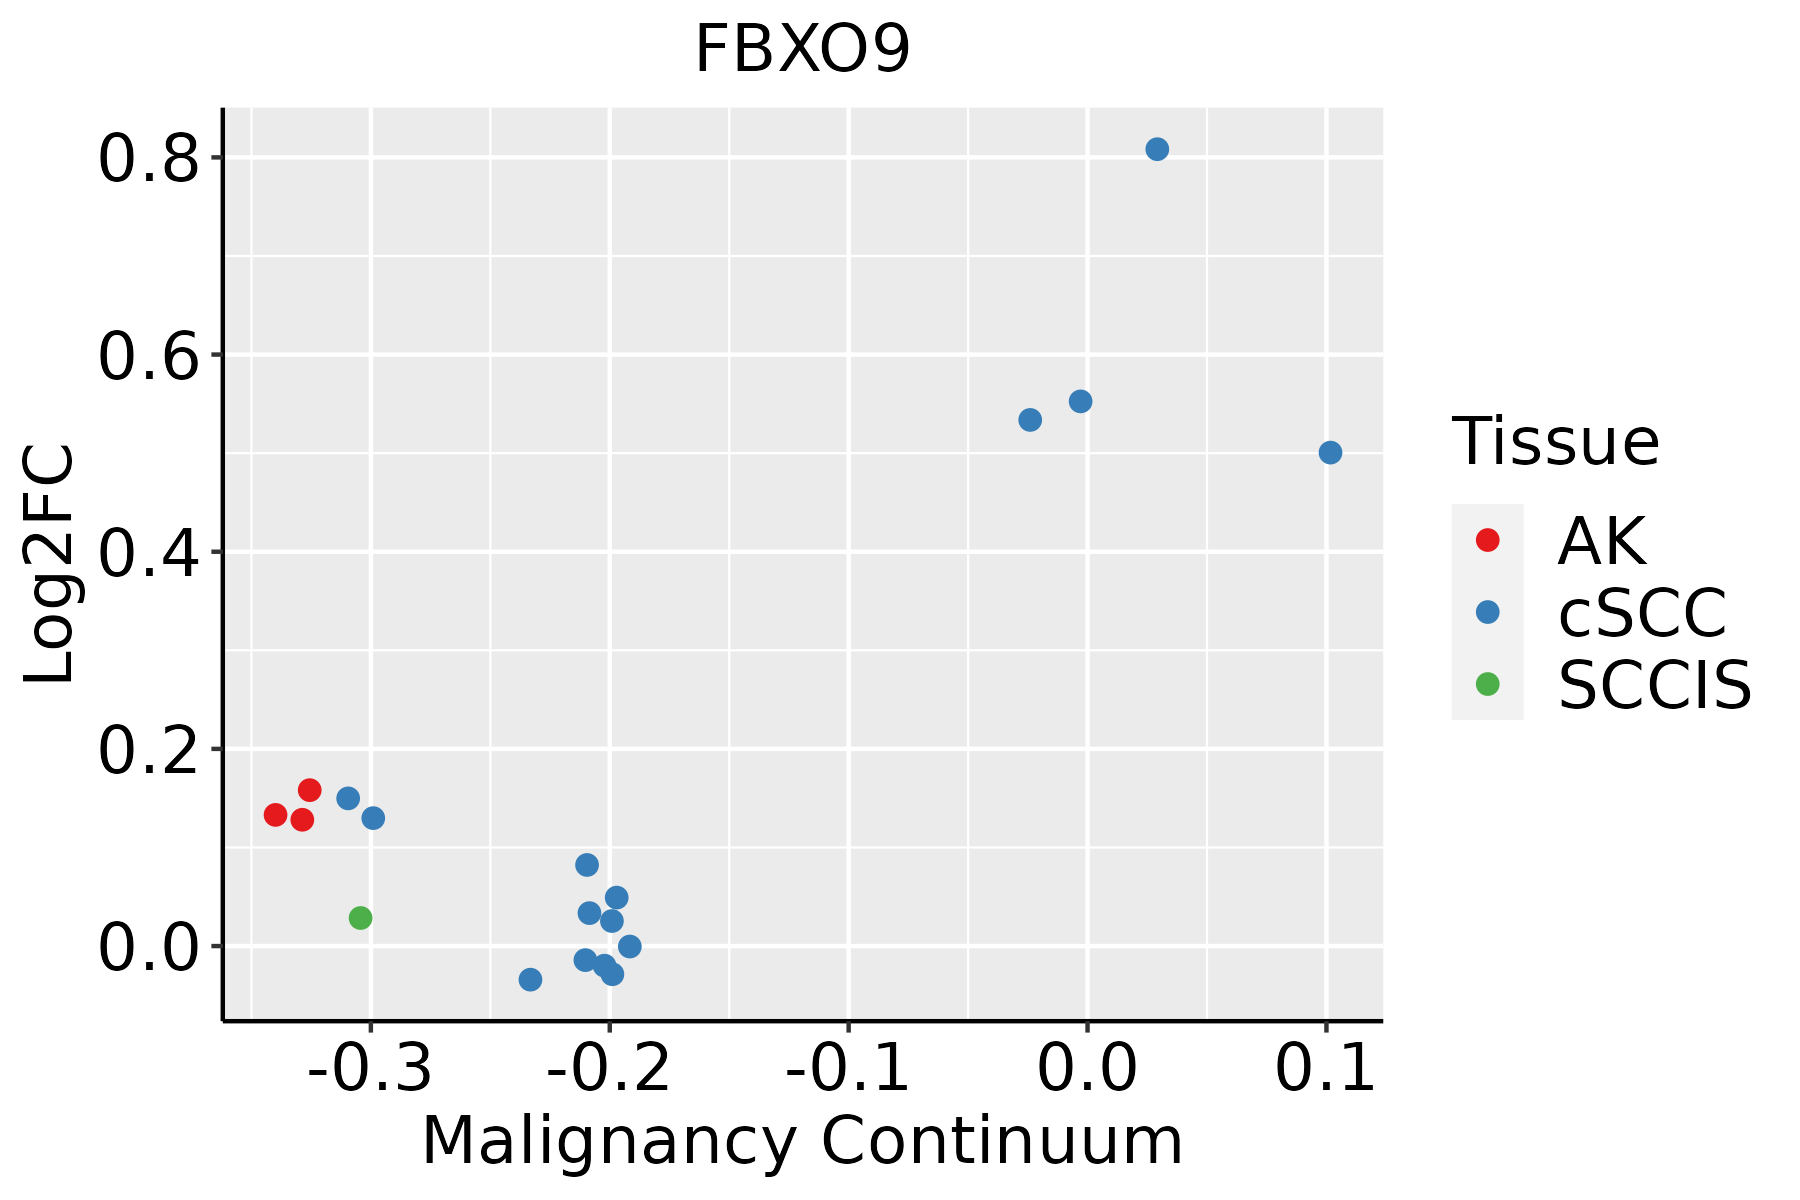 | AK: Actinic keratosis |
| cSCC: Cutaneous squamous cell carcinoma | ||
| SCCIS:squamous cell carcinoma in situ | ||
| Thyroid | 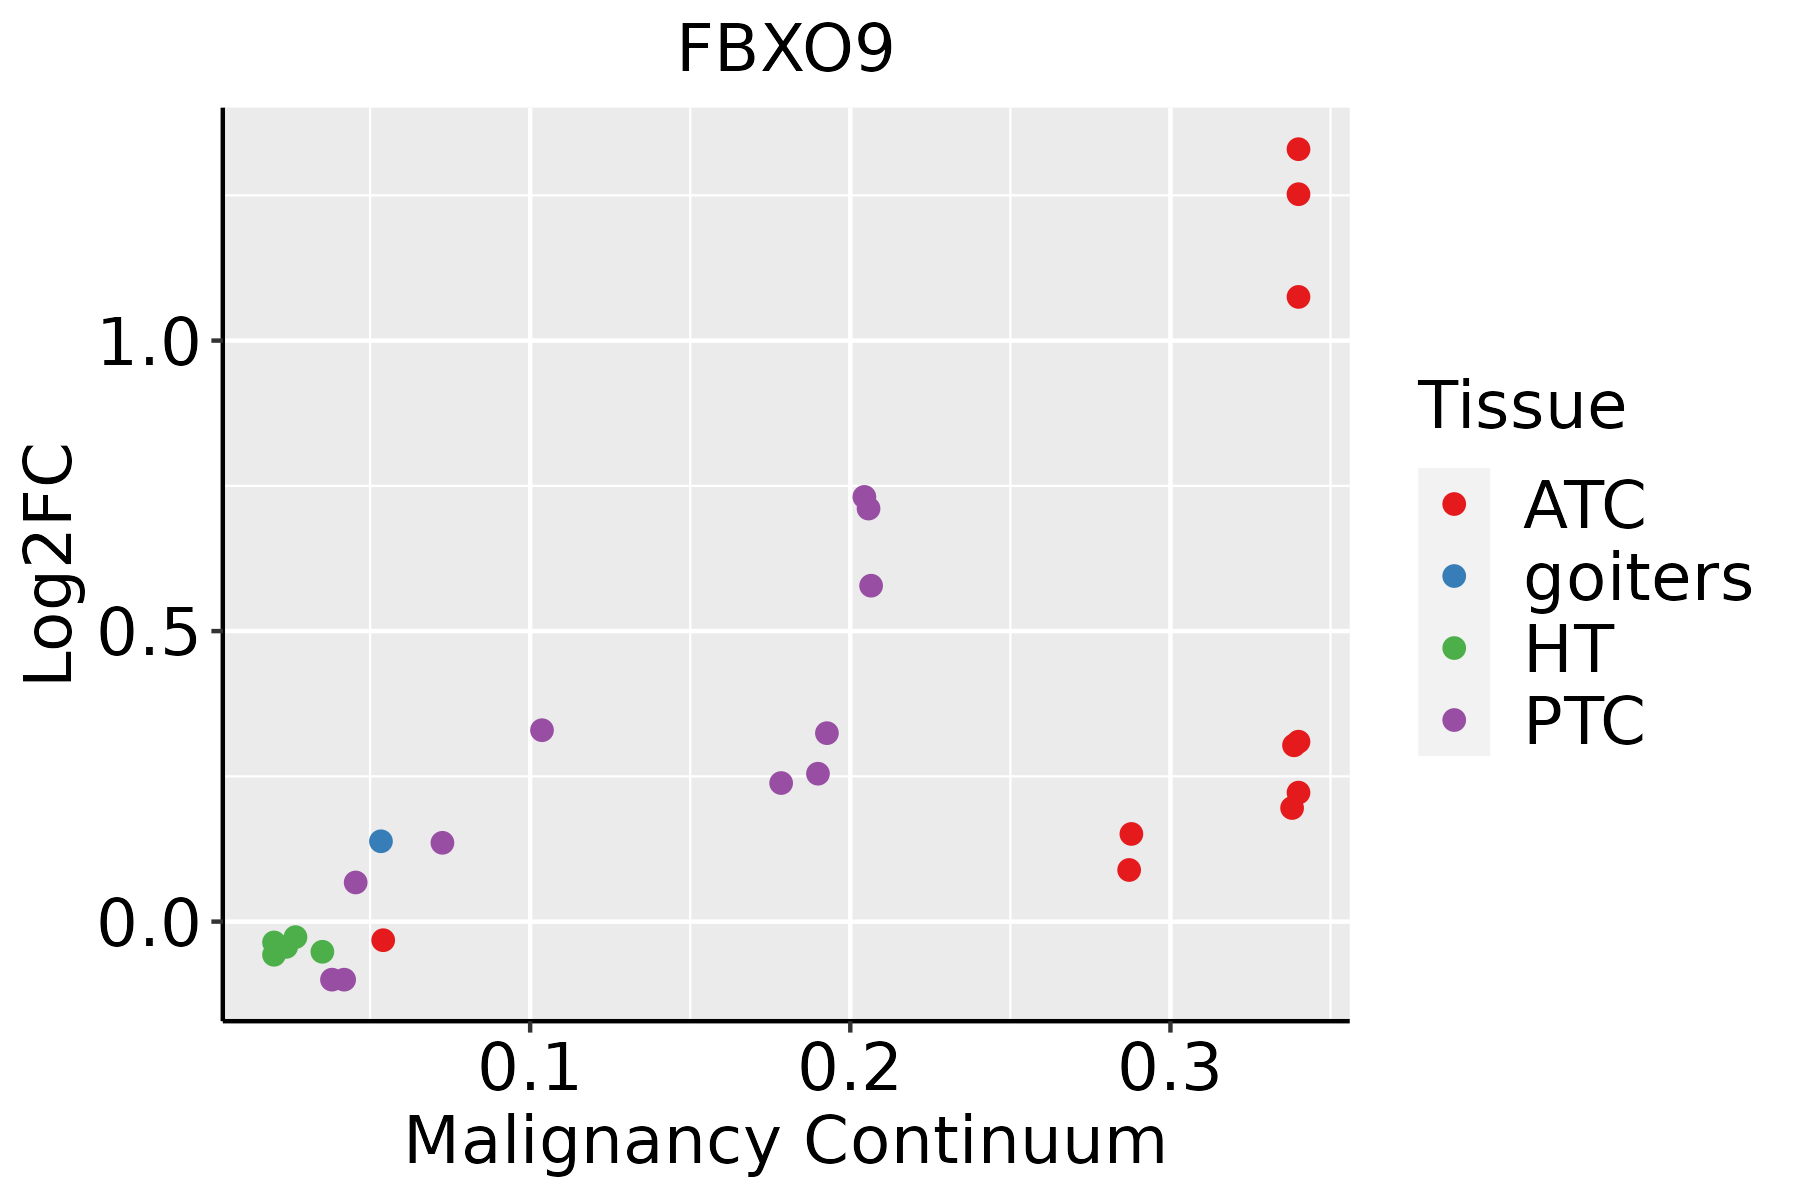 | ATC: Anaplastic thyroid cancer |
| HT: Hashimoto's thyroiditis | ||
| PTC: Papillary thyroid cancer |
| ∗log2FC in expression of this searched gene in stem-like cells from each diseased tissue sample relative to stem-like cells in normal samples in each tissue plotted against the malignancy continuum. Samples are colored based on if they are from different disease stage. |
Top |
Malignant transformation related pathway analysis |
| Find out the enriched GO biological processes and KEGG pathways involved in transition from healthy to precancer to cancer |
| Tissue | Disease Stage | Enriched GO biological Processes |
| Colorectum | AD |  |
| Colorectum | SER |  |
| Colorectum | MSS |  |
| Colorectum | MSI-H |  |
| Colorectum | FAP |  |
| ∗Top 15 enriched GO BP terms are showed in the bar plot of each disease state in each tissue. Each row represents a significant GO biological process which is colored according to the -log10(p.adjust). |
| Page: 1 2 3 4 5 6 7 8 9 |
| GO ID | Tissue | Disease Stage | Description | Gene Ratio | Bg Ratio | pvalue | p.adjust | Count |
| GO:001049826 | Esophagus | HGIN | proteasomal protein catabolic process | 139/2587 | 490/18723 | 1.20e-17 | 3.41e-15 | 139 |
| GO:004316126 | Esophagus | HGIN | proteasome-mediated ubiquitin-dependent protein catabolic process | 114/2587 | 412/18723 | 7.00e-14 | 1.20e-11 | 114 |
| GO:0010498111 | Esophagus | ESCC | proteasomal protein catabolic process | 369/8552 | 490/18723 | 1.13e-41 | 1.80e-38 | 369 |
| GO:0043161111 | Esophagus | ESCC | proteasome-mediated ubiquitin-dependent protein catabolic process | 312/8552 | 412/18723 | 3.53e-36 | 4.48e-33 | 312 |
| GO:00454449 | Esophagus | ESCC | fat cell differentiation | 135/8552 | 229/18723 | 3.38e-05 | 2.78e-04 | 135 |
| GO:00319294 | Esophagus | ESCC | TOR signaling | 79/8552 | 126/18723 | 8.57e-05 | 6.21e-04 | 79 |
| GO:00320061 | Esophagus | ESCC | regulation of TOR signaling | 63/8552 | 104/18723 | 1.55e-03 | 7.29e-03 | 63 |
| GO:00311461 | Esophagus | ESCC | SCF-dependent proteasomal ubiquitin-dependent protein catabolic process | 33/8552 | 49/18723 | 1.80e-03 | 8.26e-03 | 33 |
| GO:001049812 | Liver | Cirrhotic | proteasomal protein catabolic process | 216/4634 | 490/18723 | 2.52e-21 | 9.29e-19 | 216 |
| GO:004316112 | Liver | Cirrhotic | proteasome-mediated ubiquitin-dependent protein catabolic process | 184/4634 | 412/18723 | 4.52e-19 | 8.85e-17 | 184 |
| GO:00319292 | Liver | Cirrhotic | TOR signaling | 44/4634 | 126/18723 | 6.69e-03 | 3.30e-02 | 44 |
| GO:00454442 | Liver | Cirrhotic | fat cell differentiation | 73/4634 | 229/18723 | 8.57e-03 | 3.97e-02 | 73 |
| GO:001049822 | Liver | HCC | proteasomal protein catabolic process | 351/7958 | 490/18723 | 6.92e-40 | 1.46e-36 | 351 |
| GO:004316122 | Liver | HCC | proteasome-mediated ubiquitin-dependent protein catabolic process | 299/7958 | 412/18723 | 7.82e-36 | 8.27e-33 | 299 |
| GO:00319291 | Liver | HCC | TOR signaling | 78/7958 | 126/18723 | 8.49e-06 | 9.97e-05 | 78 |
| GO:0032006 | Liver | HCC | regulation of TOR signaling | 63/7958 | 104/18723 | 1.50e-04 | 1.20e-03 | 63 |
| GO:00454441 | Liver | HCC | fat cell differentiation | 120/7958 | 229/18723 | 1.52e-03 | 8.05e-03 | 120 |
| GO:0031146 | Liver | HCC | SCF-dependent proteasomal ubiquitin-dependent protein catabolic process | 30/7958 | 49/18723 | 6.31e-03 | 2.57e-02 | 30 |
| GO:001049820 | Oral cavity | OSCC | proteasomal protein catabolic process | 336/7305 | 490/18723 | 5.45e-41 | 8.63e-38 | 336 |
| GO:004316120 | Oral cavity | OSCC | proteasome-mediated ubiquitin-dependent protein catabolic process | 285/7305 | 412/18723 | 5.68e-36 | 5.99e-33 | 285 |
| Page: 1 2 |
| Pathway ID | Tissue | Disease Stage | Description | Gene Ratio | Bg Ratio | pvalue | p.adjust | qvalue | Count |
| Page: 1 |
Top |
Cell-cell communication analysis |
| Identification of potential cell-cell interactions between two cell types and their ligand-receptor pairs for different disease states |
| Ligand | Receptor | LRpair | Pathway | Tissue | Disease Stage |
| Page: 1 |
Top |
Single-cell gene regulatory network inference analysis |
| Find out the significant the regulons (TFs) and the target genes of each regulon across cell types for different disease states |
| TF | Cell Type | Tissue | Disease Stage | Target Gene | RSS | Regulon Activity |
| ∗The dot plots of a searched regulon are shown for all cell subpopulations in each disease state of each tissue based on the regulon specific score inferred using pySCENIC and by calculating the average expression. |
| Page: 1 |
Top |
Somatic mutation of malignant transformation related genes |
| Annotation of somatic variants for genes involved in malignant transformation |
| Hugo Symbol | Variant Class | Variant Classification | dbSNP RS | HGVSc | HGVSp | HGVSp Short | SWISSPROT | BIOTYPE | SIFT | PolyPhen | Tumor Sample Barcode | Tissue | Histology | Sex | Age | Stage | Therapy Types | Drugs | Outcome |
| FBXO9 | SNV | Missense_Mutation | c.782N>A | p.Arg261Gln | p.R261Q | Q9UK97 | protein_coding | deleterious(0) | benign(0.173) | TCGA-BR-A4QL-01 | Stomach | stomach adenocarcinoma | Female | >=65 | III/IV | Chemotherapy | xeloda | CR | |
| FBXO9 | SNV | Missense_Mutation | novel | c.730N>C | p.Ser244Arg | p.S244R | Q9UK97 | protein_coding | tolerated(0.1) | benign(0.009) | TCGA-HF-A5NB-01 | Stomach | stomach adenocarcinoma | Female | >=65 | III/IV | Chemotherapy | fluorouracil | SD |
| FBXO9 | SNV | Missense_Mutation | novel | c.508N>G | p.Gln170Glu | p.Q170E | Q9UK97 | protein_coding | tolerated(0.37) | benign(0.003) | TCGA-DE-A4MB-01 | Thyroid | thyroid carcinoma | Female | >=65 | I/II | Unknown | Unknown | SD |
| FBXO9 | insertion | Frame_Shift_Ins | novel | c.988_989insC | p.Arg330ThrfsTer3 | p.R330Tfs*3 | Q9UK97 | protein_coding | TCGA-ET-A40S-01 | Thyroid | thyroid carcinoma | Male | <65 | I/II | Unknown | Unknown | SD |
| Page: 1 2 3 4 5 |
Top |
Related drugs of malignant transformation related genes |
| Identification of chemicals and drugs interact with genes involved in malignant transfromation |
| (DGIdb 4.0) |
| Entrez ID | Symbol | Category | Interaction Types | Drug Claim Name | Drug Name | PMIDs |
| Page: 1 |

Copyright 2023-Present -The University of Texas Health Science Center at Houston |