
|
|||||
|
 | |
| |
| |
| |
| |
| |
|
Gene: ETS2 |
Gene summary for ETS2 |
| Gene information | Species | Human | Gene symbol | ETS2 | Gene ID | 2114 |
| Gene name | ETS proto-oncogene 2, transcription factor | |
| Gene Alias | ETS2IT1 | |
| Cytomap | 21q22.2 | |
| Gene Type | protein-coding | GO ID | GO:0000122 | UniProtAcc | P15036 |
Top |
Malignant transformation analysis |
| Identification of the aberrant gene expression in precancerous and cancerous lesions by comparing the gene expression of stem-like cells in diseased tissues with normal stem cells |
| Entrez ID | Symbol | Replicates | Species | Organ | Tissue | Adj P-value | Log2FC | Malignancy |
| 2114 | ETS2 | CA_HPV_2 | Human | Cervix | CC | 1.13e-05 | 3.26e-01 | 0.0391 |
| 2114 | ETS2 | CA_HPV_3 | Human | Cervix | CC | 1.78e-10 | 2.96e-01 | 0.0414 |
| 2114 | ETS2 | N_HPV_2 | Human | Cervix | N_HPV | 3.54e-07 | 3.13e-01 | -0.0131 |
| 2114 | ETS2 | CCI_1 | Human | Cervix | CC | 3.66e-06 | 7.43e-01 | 0.528 |
| 2114 | ETS2 | CCI_2 | Human | Cervix | CC | 5.77e-12 | 1.23e+00 | 0.5249 |
| 2114 | ETS2 | CCI_3 | Human | Cervix | CC | 5.79e-03 | 7.13e-01 | 0.516 |
| 2114 | ETS2 | CCII_1 | Human | Cervix | CC | 2.68e-05 | 4.40e-01 | 0.3249 |
| 2114 | ETS2 | sample1 | Human | Cervix | CC | 1.19e-24 | 9.07e-01 | 0.0959 |
| 2114 | ETS2 | sample3 | Human | Cervix | CC | 3.05e-11 | 4.41e-01 | 0.1387 |
| 2114 | ETS2 | T1 | Human | Cervix | CC | 1.86e-48 | 9.71e-01 | 0.0918 |
| 2114 | ETS2 | T2 | Human | Cervix | CC | 1.97e-03 | 5.48e-01 | 0.0709 |
| 2114 | ETS2 | T3 | Human | Cervix | CC | 3.45e-14 | 4.29e-01 | 0.1389 |
| 2114 | ETS2 | HTA11_3410_2000001011 | Human | Colorectum | AD | 8.44e-05 | 2.60e-01 | 0.0155 |
| 2114 | ETS2 | HTA11_7862_2000001011 | Human | Colorectum | AD | 1.44e-03 | 6.68e-01 | -0.0179 |
| 2114 | ETS2 | HTA11_866_3004761011 | Human | Colorectum | AD | 1.02e-31 | 1.21e+00 | 0.096 |
| 2114 | ETS2 | HTA11_4255_2000001011 | Human | Colorectum | SER | 3.41e-03 | 6.59e-01 | 0.0446 |
| 2114 | ETS2 | HTA11_7663_2000001011 | Human | Colorectum | SER | 6.20e-09 | 1.09e+00 | 0.0131 |
| 2114 | ETS2 | HTA11_7696_3000711011 | Human | Colorectum | AD | 1.02e-14 | 8.94e-01 | 0.0674 |
| 2114 | ETS2 | HTA11_6818_2000001011 | Human | Colorectum | AD | 8.61e-06 | 7.93e-01 | 0.0112 |
| 2114 | ETS2 | HTA11_6818_2000001021 | Human | Colorectum | AD | 4.10e-12 | 8.69e-01 | 0.0588 |
| Page: 1 2 3 4 5 6 7 8 9 10 11 |
| Tissue | Expression Dynamics | Abbreviation |
| Cervix |  | CC: Cervix cancer |
| HSIL_HPV: HPV-infected high-grade squamous intraepithelial lesions | ||
| N_HPV: HPV-infected normal cervix | ||
| Colorectum (GSE201348) |  | FAP: Familial adenomatous polyposis |
| CRC: Colorectal cancer | ||
| Colorectum (HTA11) |  | AD: Adenomas |
| SER: Sessile serrated lesions | ||
| MSI-H: Microsatellite-high colorectal cancer | ||
| MSS: Microsatellite stable colorectal cancer | ||
| Esophagus | 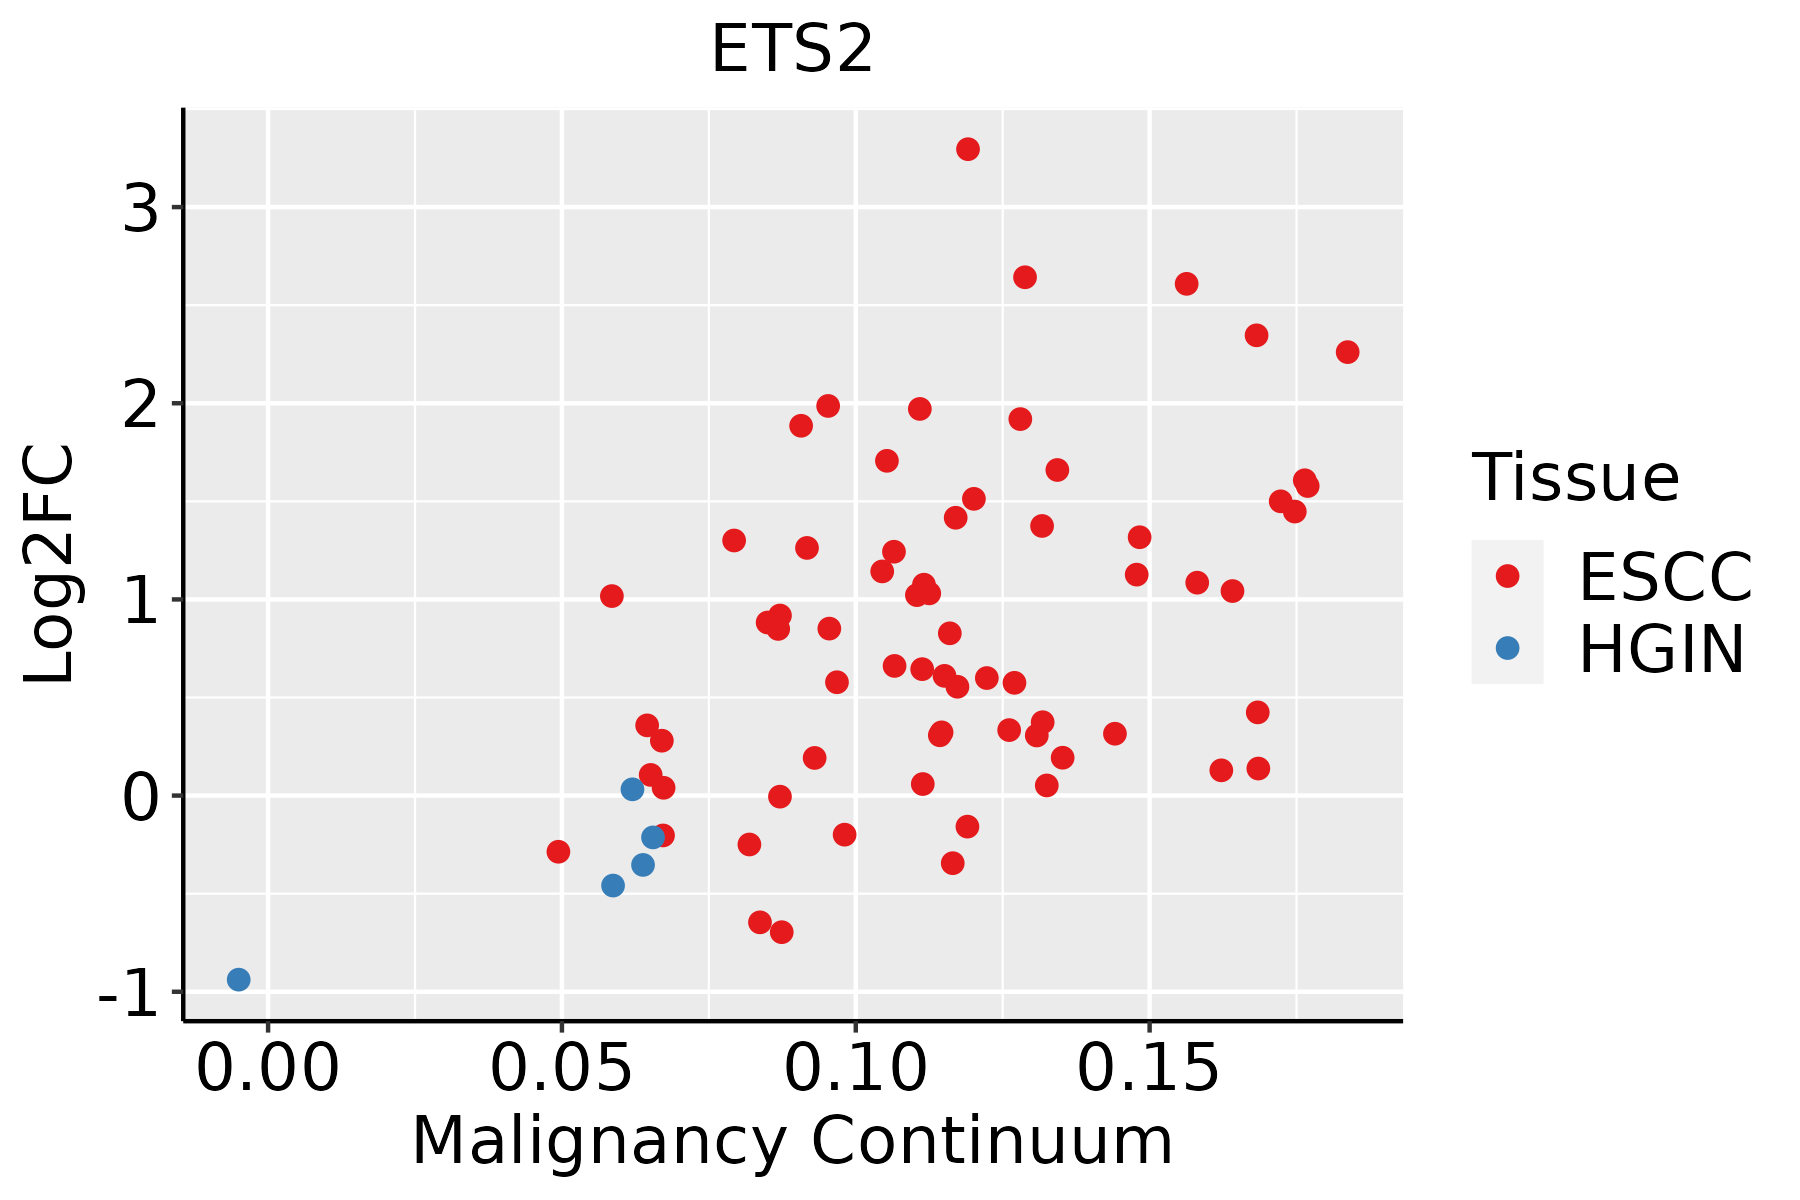 | ESCC: Esophageal squamous cell carcinoma |
| HGIN: High-grade intraepithelial neoplasias | ||
| LGIN: Low-grade intraepithelial neoplasias | ||
| GC |  | CAG: Chronic atrophic gastritis |
| CAG with IM: Chronic atrophic gastritis with intestinal metaplasia | ||
| CSG: Chronic superficial gastritis | ||
| GC: Gastric cancer | ||
| SIM: Severe intestinal metaplasia | ||
| WIM: Wild intestinal metaplasia | ||
| Liver | 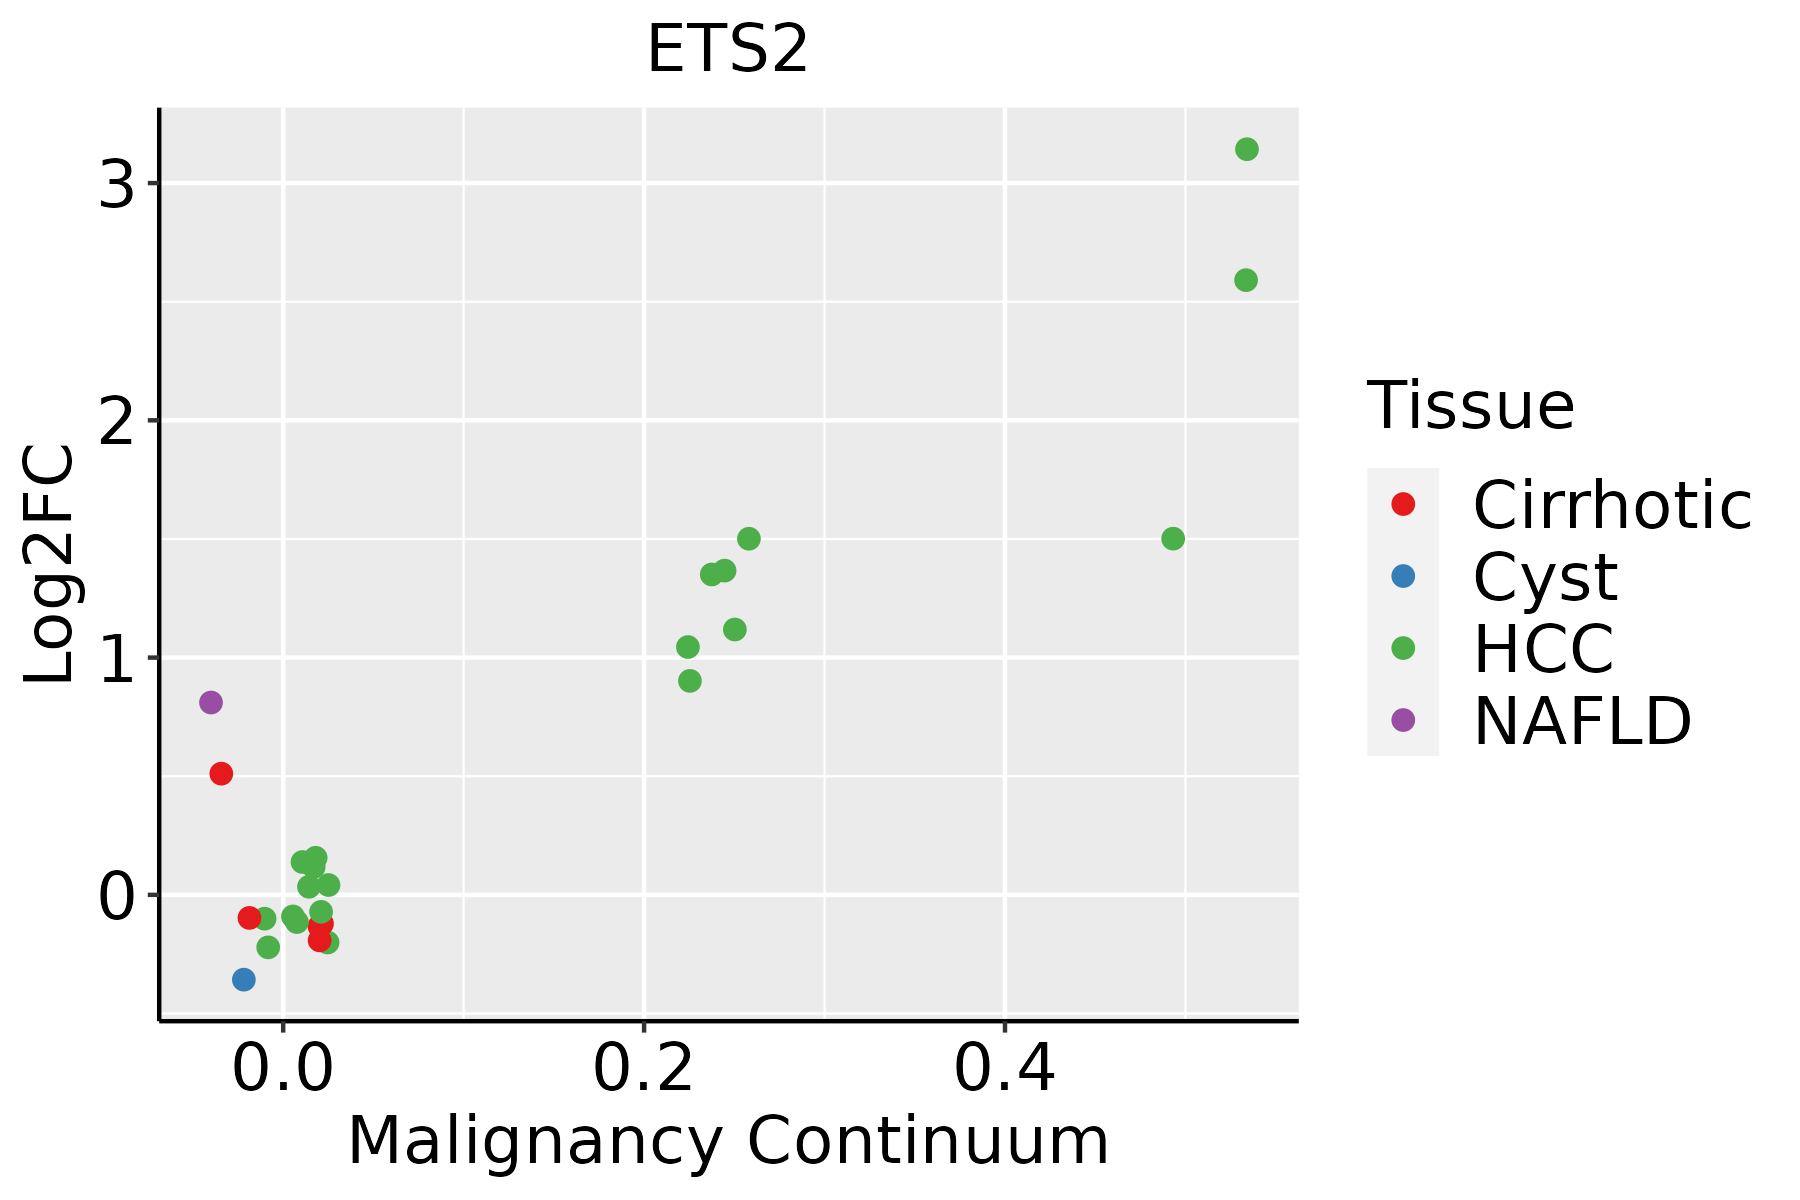 | HCC: Hepatocellular carcinoma |
| NAFLD: Non-alcoholic fatty liver disease | ||
| Oral Cavity | 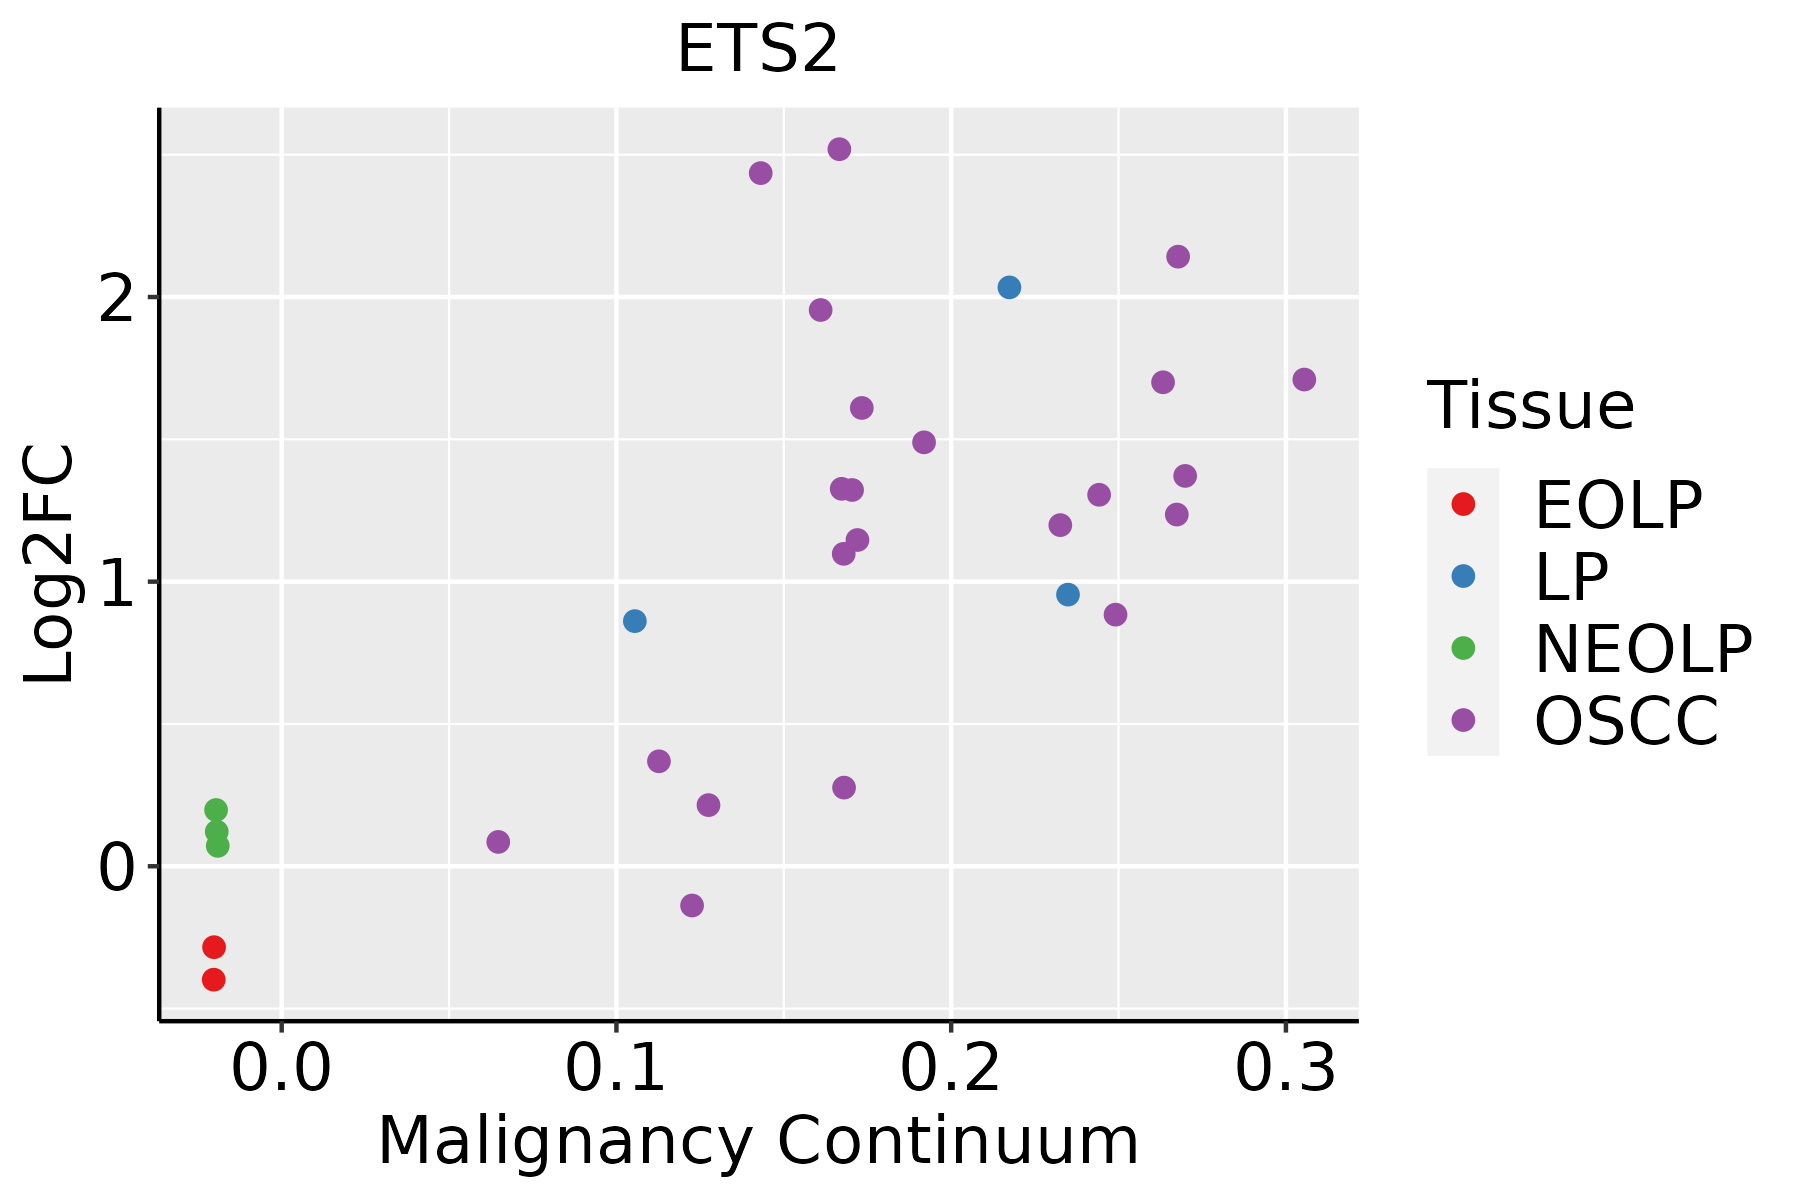 | EOLP: Erosive Oral lichen planus |
| LP: leukoplakia | ||
| NEOLP: Non-erosive oral lichen planus | ||
| OSCC: Oral squamous cell carcinoma | ||
| Prostate | 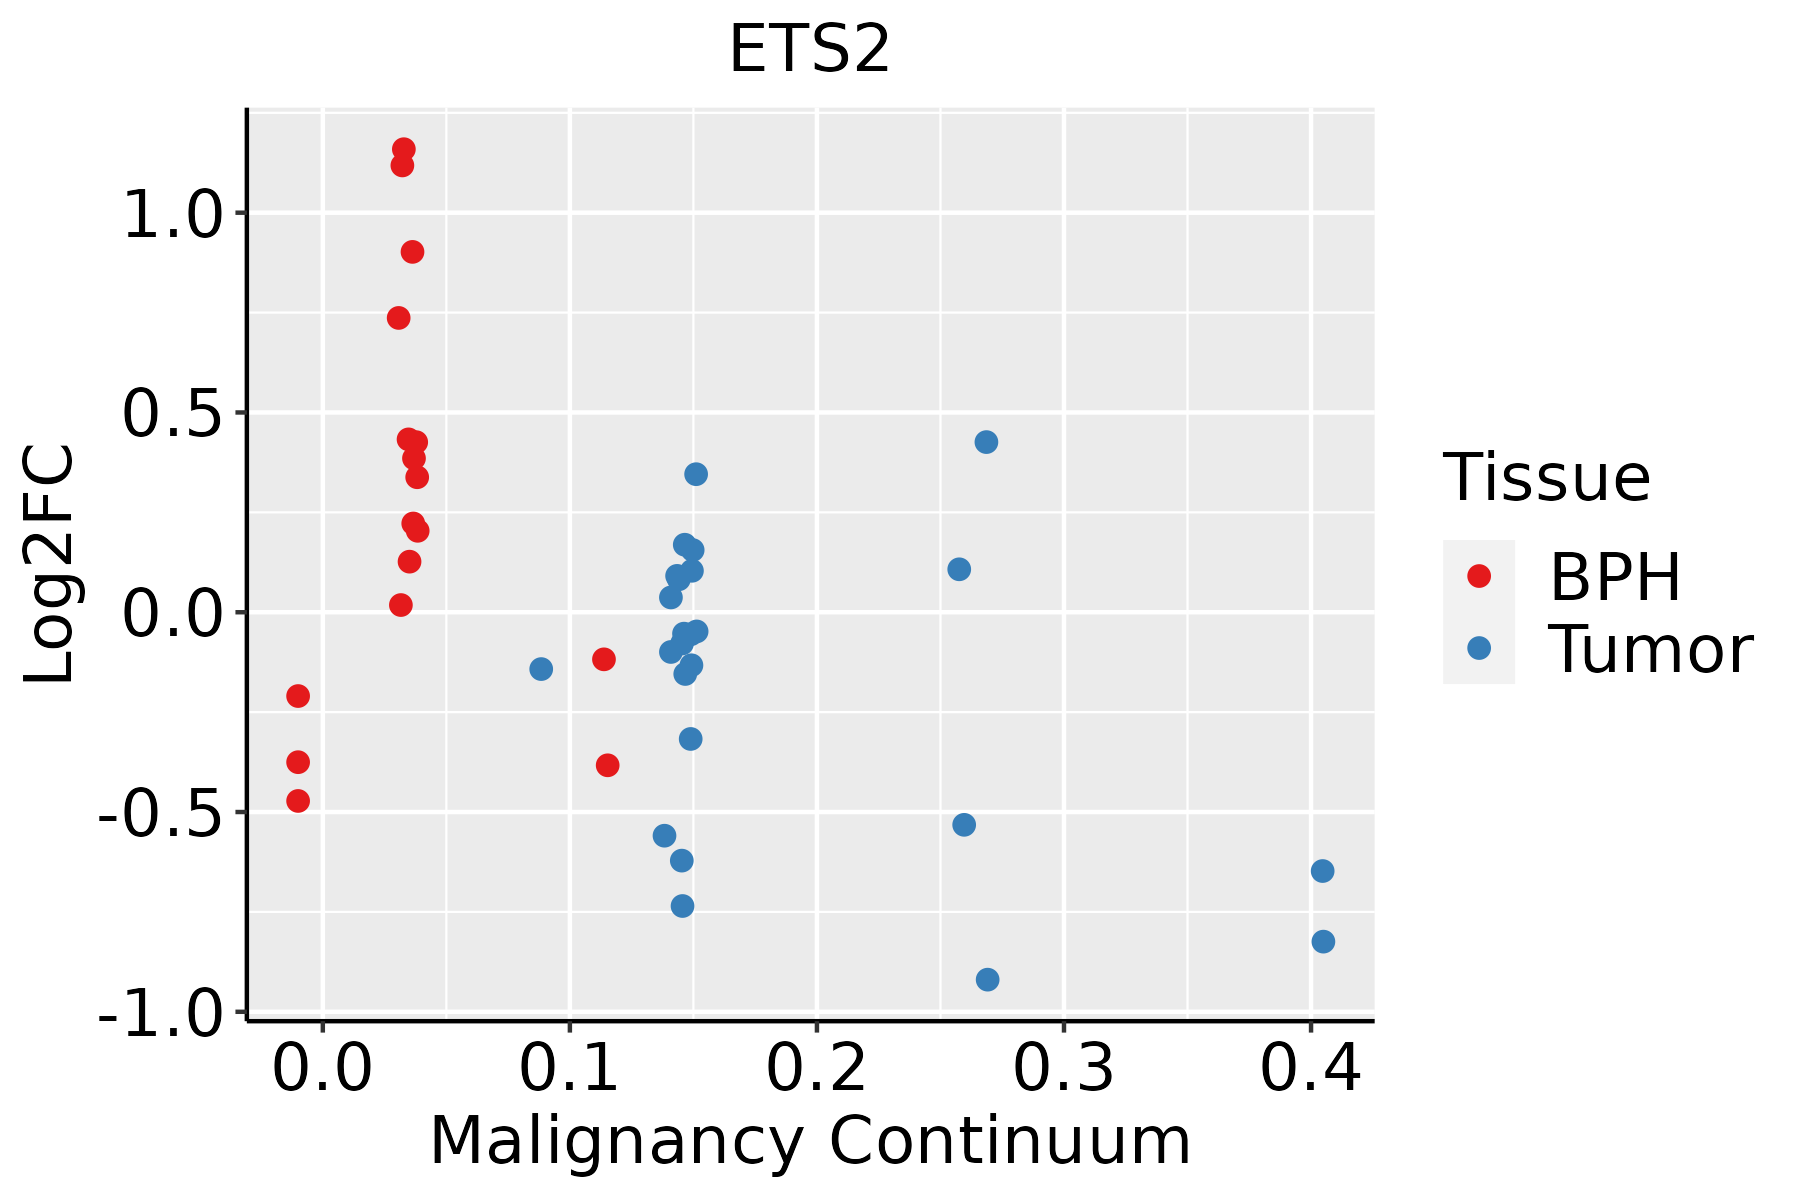 | BPH: Benign Prostatic Hyperplasia |
| Skin |  | AK: Actinic keratosis |
| cSCC: Cutaneous squamous cell carcinoma | ||
| SCCIS:squamous cell carcinoma in situ | ||
| Thyroid | 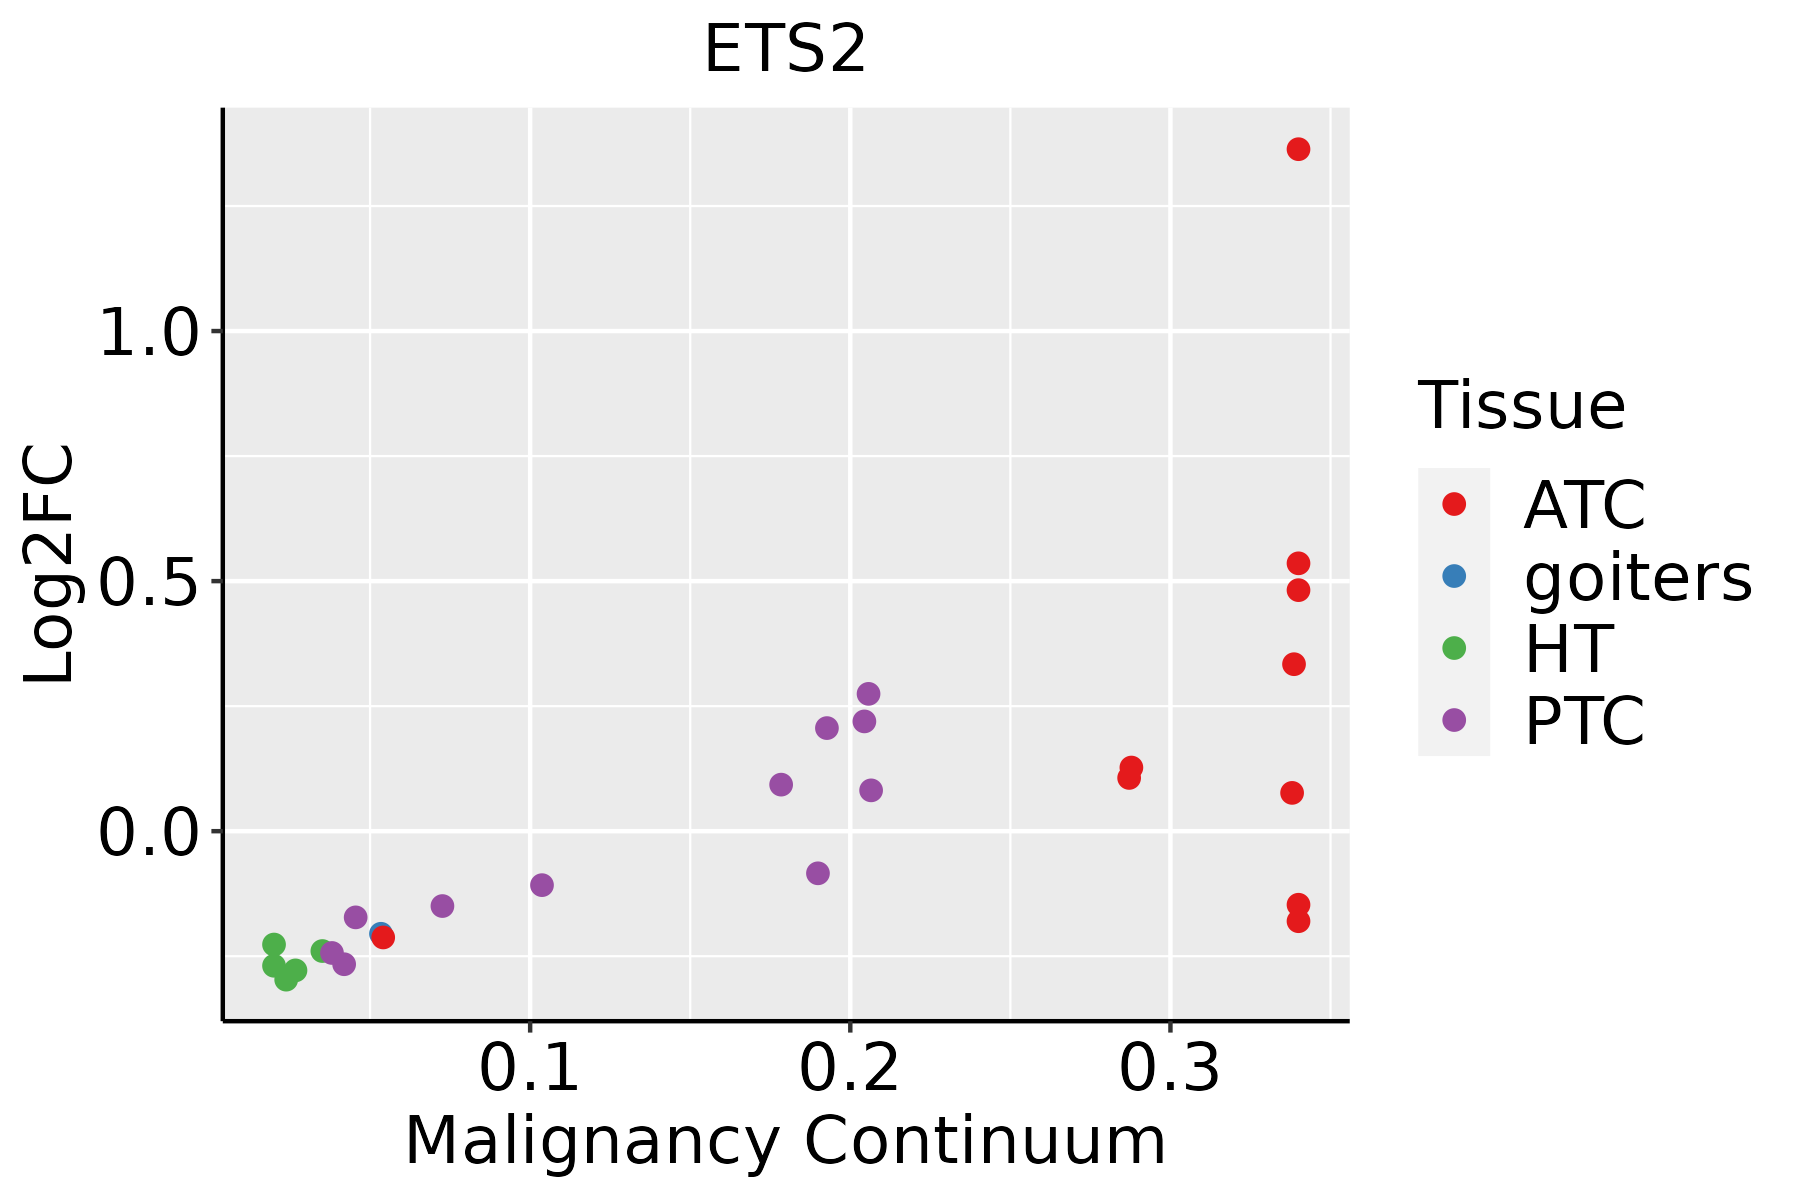 | ATC: Anaplastic thyroid cancer |
| HT: Hashimoto's thyroiditis | ||
| PTC: Papillary thyroid cancer |
| ∗log2FC in expression of this searched gene in stem-like cells from each diseased tissue sample relative to stem-like cells in normal samples in each tissue plotted against the malignancy continuum. Samples are colored based on if they are from different disease stage. |
Top |
Malignant transformation related pathway analysis |
| Find out the enriched GO biological processes and KEGG pathways involved in transition from healthy to precancer to cancer |
| Tissue | Disease Stage | Enriched GO biological Processes |
| Colorectum | AD |  |
| Colorectum | SER |  |
| Colorectum | MSS |  |
| Colorectum | MSI-H |  |
| Colorectum | FAP |  |
| ∗Top 15 enriched GO BP terms are showed in the bar plot of each disease state in each tissue. Each row represents a significant GO biological process which is colored according to the -log10(p.adjust). |
| Page: 1 2 3 4 5 6 7 8 9 |
| GO ID | Tissue | Disease Stage | Description | Gene Ratio | Bg Ratio | pvalue | p.adjust | Count |
| GO:00073695 | Cervix | CC | gastrulation | 42/2311 | 185/18723 | 5.83e-05 | 8.46e-04 | 42 |
| GO:0001704 | Cervix | CC | formation of primary germ layer | 27/2311 | 121/18723 | 1.49e-03 | 1.16e-02 | 27 |
| GO:0007369 | Colorectum | AD | gastrulation | 53/3918 | 185/18723 | 7.60e-03 | 4.60e-02 | 53 |
| GO:00073691 | Colorectum | SER | gastrulation | 43/2897 | 185/18723 | 3.44e-03 | 2.92e-02 | 43 |
| GO:00073692 | Colorectum | FAP | gastrulation | 42/2622 | 185/18723 | 8.97e-04 | 9.10e-03 | 42 |
| GO:0009952 | Colorectum | FAP | anterior/posterior pattern specification | 41/2622 | 201/18723 | 7.82e-03 | 4.63e-02 | 41 |
| GO:00073693 | Colorectum | CRC | gastrulation | 36/2078 | 185/18723 | 5.54e-04 | 7.70e-03 | 36 |
| GO:00099521 | Colorectum | CRC | anterior/posterior pattern specification | 36/2078 | 201/18723 | 2.56e-03 | 2.40e-02 | 36 |
| GO:00073698 | Esophagus | ESCC | gastrulation | 115/8552 | 185/18723 | 4.35e-06 | 4.64e-05 | 115 |
| GO:00017044 | Esophagus | ESCC | formation of primary germ layer | 75/8552 | 121/18723 | 2.17e-04 | 1.36e-03 | 75 |
| GO:00073697 | Oral cavity | OSCC | gastrulation | 95/7305 | 185/18723 | 4.17e-04 | 2.54e-03 | 95 |
| GO:00017043 | Oral cavity | OSCC | formation of primary germ layer | 65/7305 | 121/18723 | 7.08e-04 | 3.90e-03 | 65 |
| GO:000736913 | Oral cavity | EOLP | gastrulation | 39/2218 | 185/18723 | 2.29e-04 | 2.25e-03 | 39 |
| GO:000170412 | Oral cavity | EOLP | formation of primary germ layer | 24/2218 | 121/18723 | 7.53e-03 | 3.62e-02 | 24 |
| GO:00073696 | Prostate | BPH | gastrulation | 50/3107 | 185/18723 | 2.20e-04 | 1.78e-03 | 50 |
| GO:00017042 | Prostate | BPH | formation of primary germ layer | 35/3107 | 121/18723 | 4.80e-04 | 3.42e-03 | 35 |
| GO:000736912 | Prostate | Tumor | gastrulation | 52/3246 | 185/18723 | 1.76e-04 | 1.55e-03 | 52 |
| GO:000170411 | Prostate | Tumor | formation of primary germ layer | 36/3246 | 121/18723 | 5.22e-04 | 3.82e-03 | 36 |
| GO:00073699 | Skin | AK | gastrulation | 41/1910 | 185/18723 | 1.32e-06 | 4.13e-05 | 41 |
| GO:00017045 | Skin | AK | formation of primary germ layer | 30/1910 | 121/18723 | 3.12e-06 | 8.17e-05 | 30 |
| Page: 1 2 |
| Pathway ID | Tissue | Disease Stage | Description | Gene Ratio | Bg Ratio | pvalue | p.adjust | qvalue | Count |
| hsa0516620 | Cervix | CC | Human T-cell leukemia virus 1 infection | 61/1267 | 222/8465 | 8.13e-07 | 7.98e-06 | 4.72e-06 | 61 |
| hsa040142 | Cervix | CC | Ras signaling pathway | 51/1267 | 236/8465 | 3.55e-03 | 1.34e-02 | 7.91e-03 | 51 |
| hsa05166110 | Cervix | CC | Human T-cell leukemia virus 1 infection | 61/1267 | 222/8465 | 8.13e-07 | 7.98e-06 | 4.72e-06 | 61 |
| hsa0401411 | Cervix | CC | Ras signaling pathway | 51/1267 | 236/8465 | 3.55e-03 | 1.34e-02 | 7.91e-03 | 51 |
| hsa0516643 | Cervix | N_HPV | Human T-cell leukemia virus 1 infection | 22/349 | 222/8465 | 1.17e-04 | 1.18e-03 | 9.23e-04 | 22 |
| hsa0516653 | Cervix | N_HPV | Human T-cell leukemia virus 1 infection | 22/349 | 222/8465 | 1.17e-04 | 1.18e-03 | 9.23e-04 | 22 |
| hsa05166 | Colorectum | AD | Human T-cell leukemia virus 1 infection | 72/2092 | 222/8465 | 5.24e-03 | 2.44e-02 | 1.55e-02 | 72 |
| hsa051661 | Colorectum | AD | Human T-cell leukemia virus 1 infection | 72/2092 | 222/8465 | 5.24e-03 | 2.44e-02 | 1.55e-02 | 72 |
| hsa051662 | Colorectum | MSS | Human T-cell leukemia virus 1 infection | 68/1875 | 222/8465 | 1.84e-03 | 9.61e-03 | 5.89e-03 | 68 |
| hsa051663 | Colorectum | MSS | Human T-cell leukemia virus 1 infection | 68/1875 | 222/8465 | 1.84e-03 | 9.61e-03 | 5.89e-03 | 68 |
| hsa04014 | Colorectum | CRC | Ras signaling pathway | 49/1091 | 236/8465 | 4.04e-04 | 4.50e-03 | 3.05e-03 | 49 |
| hsa040141 | Colorectum | CRC | Ras signaling pathway | 49/1091 | 236/8465 | 4.04e-04 | 4.50e-03 | 3.05e-03 | 49 |
| hsa05166211 | Esophagus | ESCC | Human T-cell leukemia virus 1 infection | 164/4205 | 222/8465 | 8.13e-14 | 2.09e-12 | 1.07e-12 | 164 |
| hsa05166310 | Esophagus | ESCC | Human T-cell leukemia virus 1 infection | 164/4205 | 222/8465 | 8.13e-14 | 2.09e-12 | 1.07e-12 | 164 |
| hsa0516614 | Liver | Cirrhotic | Human T-cell leukemia virus 1 infection | 87/2530 | 222/8465 | 1.69e-03 | 8.01e-03 | 4.94e-03 | 87 |
| hsa0516615 | Liver | Cirrhotic | Human T-cell leukemia virus 1 infection | 87/2530 | 222/8465 | 1.69e-03 | 8.01e-03 | 4.94e-03 | 87 |
| hsa0516622 | Liver | HCC | Human T-cell leukemia virus 1 infection | 139/4020 | 222/8465 | 3.17e-06 | 2.79e-05 | 1.55e-05 | 139 |
| hsa0516632 | Liver | HCC | Human T-cell leukemia virus 1 infection | 139/4020 | 222/8465 | 3.17e-06 | 2.79e-05 | 1.55e-05 | 139 |
| hsa0516630 | Oral cavity | OSCC | Human T-cell leukemia virus 1 infection | 150/3704 | 222/8465 | 3.68e-13 | 7.26e-12 | 3.70e-12 | 150 |
| hsa05166113 | Oral cavity | OSCC | Human T-cell leukemia virus 1 infection | 150/3704 | 222/8465 | 3.68e-13 | 7.26e-12 | 3.70e-12 | 150 |
| Page: 1 2 |
Top |
Cell-cell communication analysis |
| Identification of potential cell-cell interactions between two cell types and their ligand-receptor pairs for different disease states |
| Ligand | Receptor | LRpair | Pathway | Tissue | Disease Stage |
| Page: 1 |
Top |
Single-cell gene regulatory network inference analysis |
| Find out the significant the regulons (TFs) and the target genes of each regulon across cell types for different disease states |
| TF | Cell Type | Tissue | Disease Stage | Target Gene | RSS | Regulon Activity |
| ETS2 | MYOEPI | Breast | ADJ | PGF,CEBPD,VEGFA, etc. | 6.14e-01 |  |
| ETS2 | MYOEPI | Breast | Precancer | PGF,CEBPD,VEGFA, etc. | 5.89e-01 |  |
| ETS2 | MES | Cervix | Healthy | TM4SF1,KLF10,TGIF1, etc. | 4.30e-01 |  |
| ETS2 | STM | Colorectum | AD | SLC12A2,ASCL2,CD44, etc. | 1.49e-01 |  |
| ETS2 | STM | Colorectum | MSS | SLC12A2,ASCL2,CD44, etc. | 2.68e-01 |  |
| ETS2 | STM | Colorectum | SER | SLC12A2,ASCL2,CD44, etc. | 8.14e-02 |  |
| ETS2 | DIFF | Esophagus | Healthy | PHLDA1,MIR205HG,KLF6, etc. | 8.29e-02 |  |
| ETS2 | STM | Esophagus | Healthy | PHLDA1,MIR205HG,KLF6, etc. | 4.52e-01 | |
| ETS2 | INMON | Lung | ADJ | NAMPT,VCAN,S100A8, etc. | 1.78e-01 |  |
| ETS2 | INMON | Pancreas | PanIN | NLRP3,HBEGF,CSF2RA, etc. | 6.56e-01 |  |
| ∗The dot plots of a searched regulon are shown for all cell subpopulations in each disease state of each tissue based on the regulon specific score inferred using pySCENIC and by calculating the average expression. |
| Page: 1 2 |
Top |
Somatic mutation of malignant transformation related genes |
| Annotation of somatic variants for genes involved in malignant transformation |
| Hugo Symbol | Variant Class | Variant Classification | dbSNP RS | HGVSc | HGVSp | HGVSp Short | SWISSPROT | BIOTYPE | SIFT | PolyPhen | Tumor Sample Barcode | Tissue | Histology | Sex | Age | Stage | Therapy Types | Drugs | Outcome |
| ETS2 | SNV | Missense_Mutation | novel | c.13N>A | p.Gly5Arg | p.G5R | P15036 | protein_coding | tolerated_low_confidence(0.13) | probably_damaging(0.999) | TCGA-QK-A6IH-01 | Oral cavity | head & neck squamous cell carcinoma | Female | >=65 | I/II | Chemotherapy | carboplatin | PD |
| ETS2 | deletion | Frame_Shift_Del | novel | c.809_810delCT | p.Ser270TrpfsTer10 | p.S270Wfs*10 | P15036 | protein_coding | TCGA-CQ-7071-01 | Oral cavity | head & neck squamous cell carcinoma | Female | >=65 | III/IV | Unknown | Unknown | SD | ||
| ETS2 | SNV | Missense_Mutation | c.441T>A | p.Phe147Leu | p.F147L | P15036 | protein_coding | deleterious(0) | probably_damaging(0.99) | TCGA-BR-6705-01 | Stomach | stomach adenocarcinoma | Female | >=65 | III/IV | Unknown | Unknown | PD | |
| ETS2 | SNV | Missense_Mutation | c.575N>G | p.Asn192Ser | p.N192S | P15036 | protein_coding | tolerated(1) | benign(0) | TCGA-BR-8680-01 | Stomach | stomach adenocarcinoma | Male | <65 | III/IV | Chemotherapy | oxaliplatin | CR | |
| ETS2 | SNV | Missense_Mutation | rs753854772 | c.343N>T | p.Leu115Phe | p.L115F | P15036 | protein_coding | deleterious(0.01) | probably_damaging(0.999) | TCGA-CD-A4MI-01 | Stomach | stomach adenocarcinoma | Male | <65 | III/IV | Unknown | Unknown | PD |
| ETS2 | insertion | Frame_Shift_Ins | novel | c.554_555insCT | p.Val187ProfsTer11 | p.V187Pfs*11 | P15036 | protein_coding | TCGA-BR-4279-01 | Stomach | stomach adenocarcinoma | Male | <65 | I/II | Chemotherapy | docetaxel | SD |
| Page: 1 2 3 4 5 |
Top |
Related drugs of malignant transformation related genes |
| Identification of chemicals and drugs interact with genes involved in malignant transfromation |
| (DGIdb 4.0) |
| Entrez ID | Symbol | Category | Interaction Types | Drug Claim Name | Drug Name | PMIDs |
| 2114 | ETS2 | CLINICALLY ACTIONABLE, TRANSCRIPTION FACTOR | TK216 | |||
| 2114 | ETS2 | CLINICALLY ACTIONABLE, TRANSCRIPTION FACTOR | carboplatin | CARBOPLATIN | 31616045 | |
| 2114 | ETS2 | CLINICALLY ACTIONABLE, TRANSCRIPTION FACTOR | gemcitabine | GEMCITABINE | 31616045 |
| Page: 1 |

Copyright 2023-Present -The University of Texas Health Science Center at Houston |