
|
|||||
|
 | |
| |
| |
| |
| |
| |
|
Gene: ETNK1 |
Gene summary for ETNK1 |
| Gene information | Species | Human | Gene symbol | ETNK1 | Gene ID | 55500 |
| Gene name | ethanolamine kinase 1 | |
| Gene Alias | EKI | |
| Cytomap | 12p12.1 | |
| Gene Type | protein-coding | GO ID | GO:0006629 | UniProtAcc | Q9HBU6 |
Top |
Malignant transformation analysis |
| Identification of the aberrant gene expression in precancerous and cancerous lesions by comparing the gene expression of stem-like cells in diseased tissues with normal stem cells |
| Entrez ID | Symbol | Replicates | Species | Organ | Tissue | Adj P-value | Log2FC | Malignancy |
| 55500 | ETNK1 | CCI_2 | Human | Cervix | CC | 3.97e-06 | 1.23e+00 | 0.5249 |
| 55500 | ETNK1 | CCI_3 | Human | Cervix | CC | 8.71e-08 | 8.94e-01 | 0.516 |
| 55500 | ETNK1 | HTA11_3410_2000001011 | Human | Colorectum | AD | 3.34e-27 | -7.09e-01 | 0.0155 |
| 55500 | ETNK1 | HTA11_2951_2000001011 | Human | Colorectum | AD | 6.97e-03 | -7.26e-01 | 0.0216 |
| 55500 | ETNK1 | HTA11_3361_2000001011 | Human | Colorectum | AD | 2.44e-02 | -4.68e-01 | -0.1207 |
| 55500 | ETNK1 | HTA11_696_2000001011 | Human | Colorectum | AD | 5.34e-24 | -6.97e-01 | -0.1464 |
| 55500 | ETNK1 | HTA11_866_2000001011 | Human | Colorectum | AD | 3.61e-12 | -5.64e-01 | -0.1001 |
| 55500 | ETNK1 | HTA11_2992_2000001011 | Human | Colorectum | SER | 1.85e-02 | -6.50e-01 | -0.1706 |
| 55500 | ETNK1 | HTA11_546_2000001011 | Human | Colorectum | AD | 3.17e-09 | -7.31e-01 | -0.0842 |
| 55500 | ETNK1 | HTA11_866_3004761011 | Human | Colorectum | AD | 3.10e-13 | -6.30e-01 | 0.096 |
| 55500 | ETNK1 | HTA11_9408_2000001011 | Human | Colorectum | AD | 1.32e-04 | -9.64e-01 | 0.0451 |
| 55500 | ETNK1 | HTA11_8622_2000001021 | Human | Colorectum | SER | 8.26e-07 | -7.59e-01 | 0.0528 |
| 55500 | ETNK1 | HTA11_10623_2000001011 | Human | Colorectum | AD | 4.30e-02 | -5.85e-01 | -0.0177 |
| 55500 | ETNK1 | HTA11_10711_2000001011 | Human | Colorectum | AD | 6.33e-11 | -7.04e-01 | 0.0338 |
| 55500 | ETNK1 | HTA11_7696_3000711011 | Human | Colorectum | AD | 3.54e-28 | -7.48e-01 | 0.0674 |
| 55500 | ETNK1 | HTA11_6818_2000001011 | Human | Colorectum | AD | 5.68e-10 | -9.02e-01 | 0.0112 |
| 55500 | ETNK1 | HTA11_11156_2000001011 | Human | Colorectum | AD | 3.52e-02 | -8.64e-01 | 0.0397 |
| 55500 | ETNK1 | HTA11_6818_2000001021 | Human | Colorectum | AD | 4.46e-06 | -6.19e-01 | 0.0588 |
| 55500 | ETNK1 | HTA11_99999971662_82457 | Human | Colorectum | MSS | 2.30e-07 | -4.77e-01 | 0.3859 |
| 55500 | ETNK1 | HTA11_99999973899_84307 | Human | Colorectum | MSS | 1.15e-11 | -7.93e-01 | 0.2585 |
| Page: 1 2 3 4 5 6 7 8 9 10 |
| Tissue | Expression Dynamics | Abbreviation |
| Cervix |  | CC: Cervix cancer |
| HSIL_HPV: HPV-infected high-grade squamous intraepithelial lesions | ||
| N_HPV: HPV-infected normal cervix | ||
| Colorectum (GSE201348) |  | FAP: Familial adenomatous polyposis |
| CRC: Colorectal cancer | ||
| Colorectum (HTA11) |  | AD: Adenomas |
| SER: Sessile serrated lesions | ||
| MSI-H: Microsatellite-high colorectal cancer | ||
| MSS: Microsatellite stable colorectal cancer | ||
| Esophagus |  | ESCC: Esophageal squamous cell carcinoma |
| HGIN: High-grade intraepithelial neoplasias | ||
| LGIN: Low-grade intraepithelial neoplasias | ||
| GC | 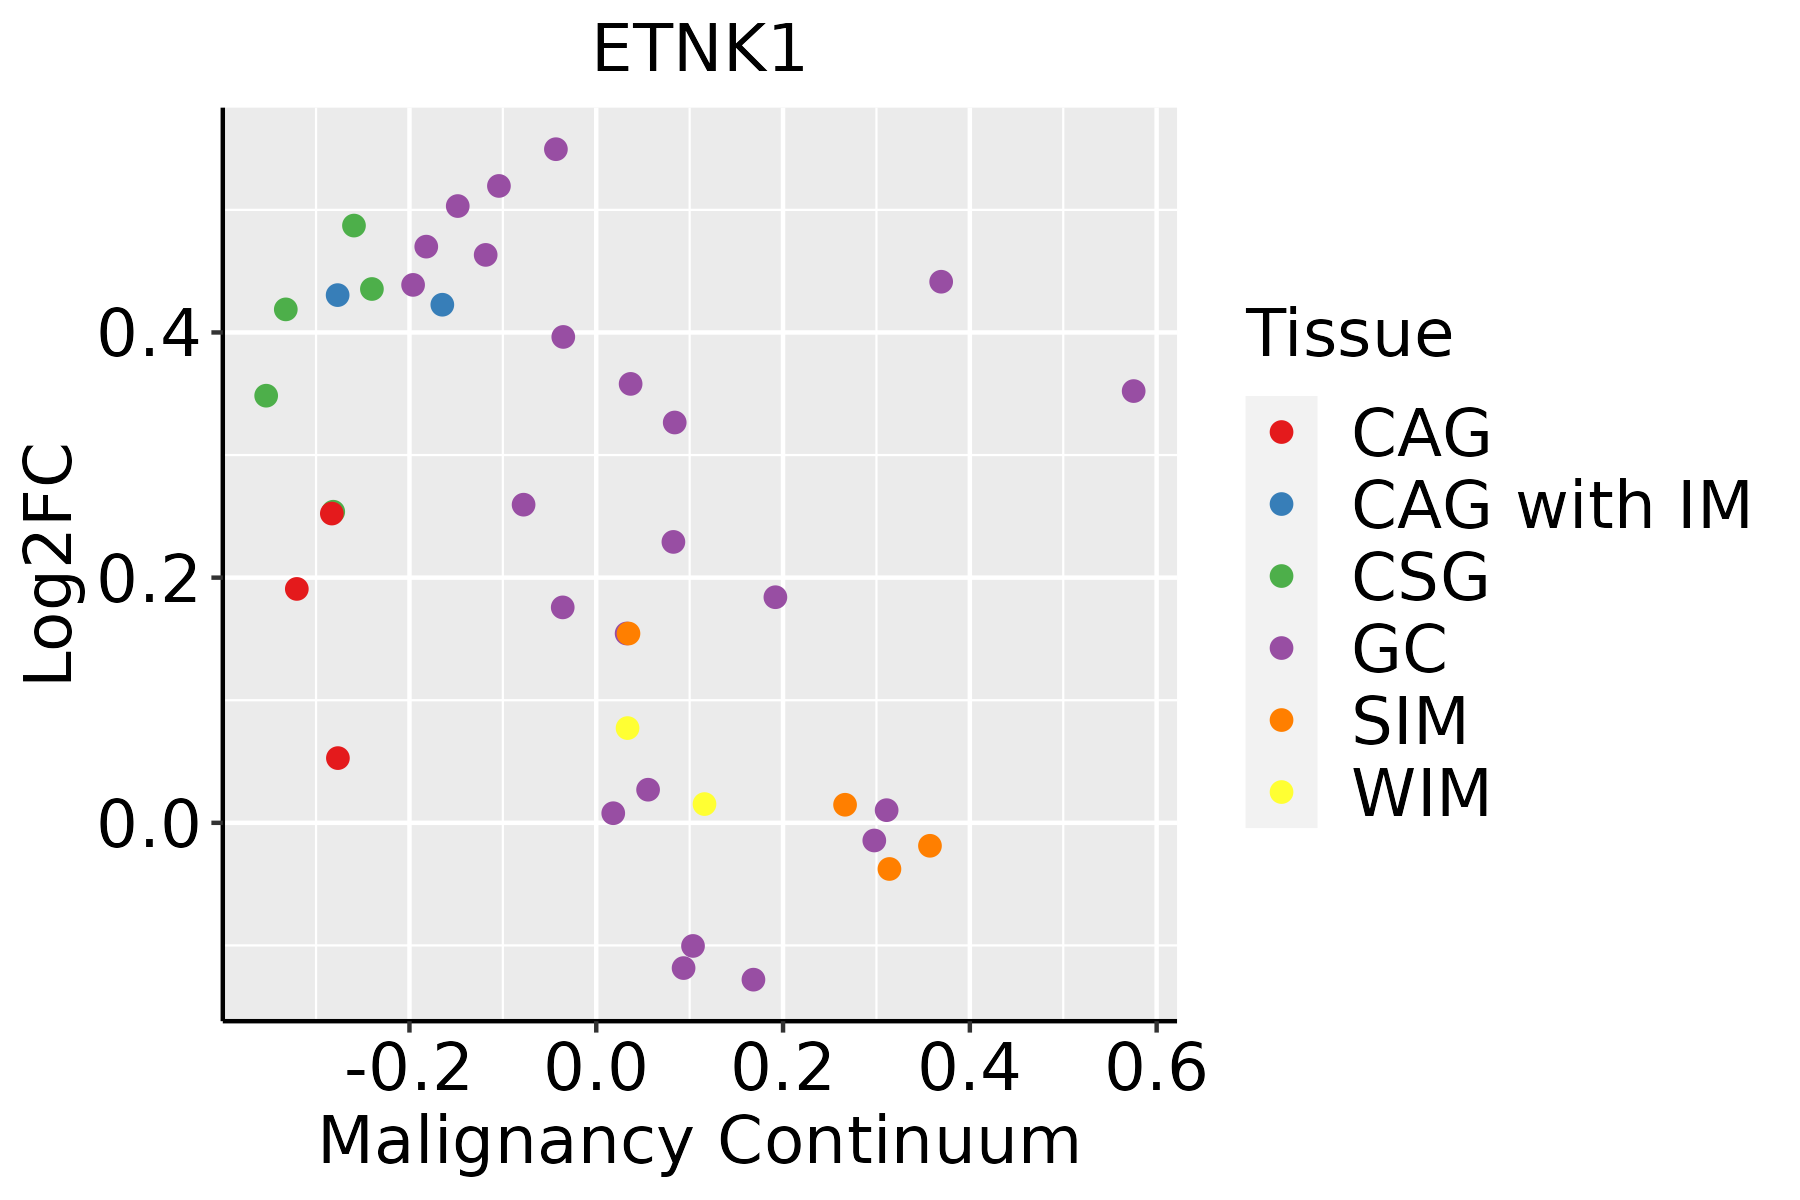 | CAG: Chronic atrophic gastritis |
| CAG with IM: Chronic atrophic gastritis with intestinal metaplasia | ||
| CSG: Chronic superficial gastritis | ||
| GC: Gastric cancer | ||
| SIM: Severe intestinal metaplasia | ||
| WIM: Wild intestinal metaplasia | ||
| Liver | 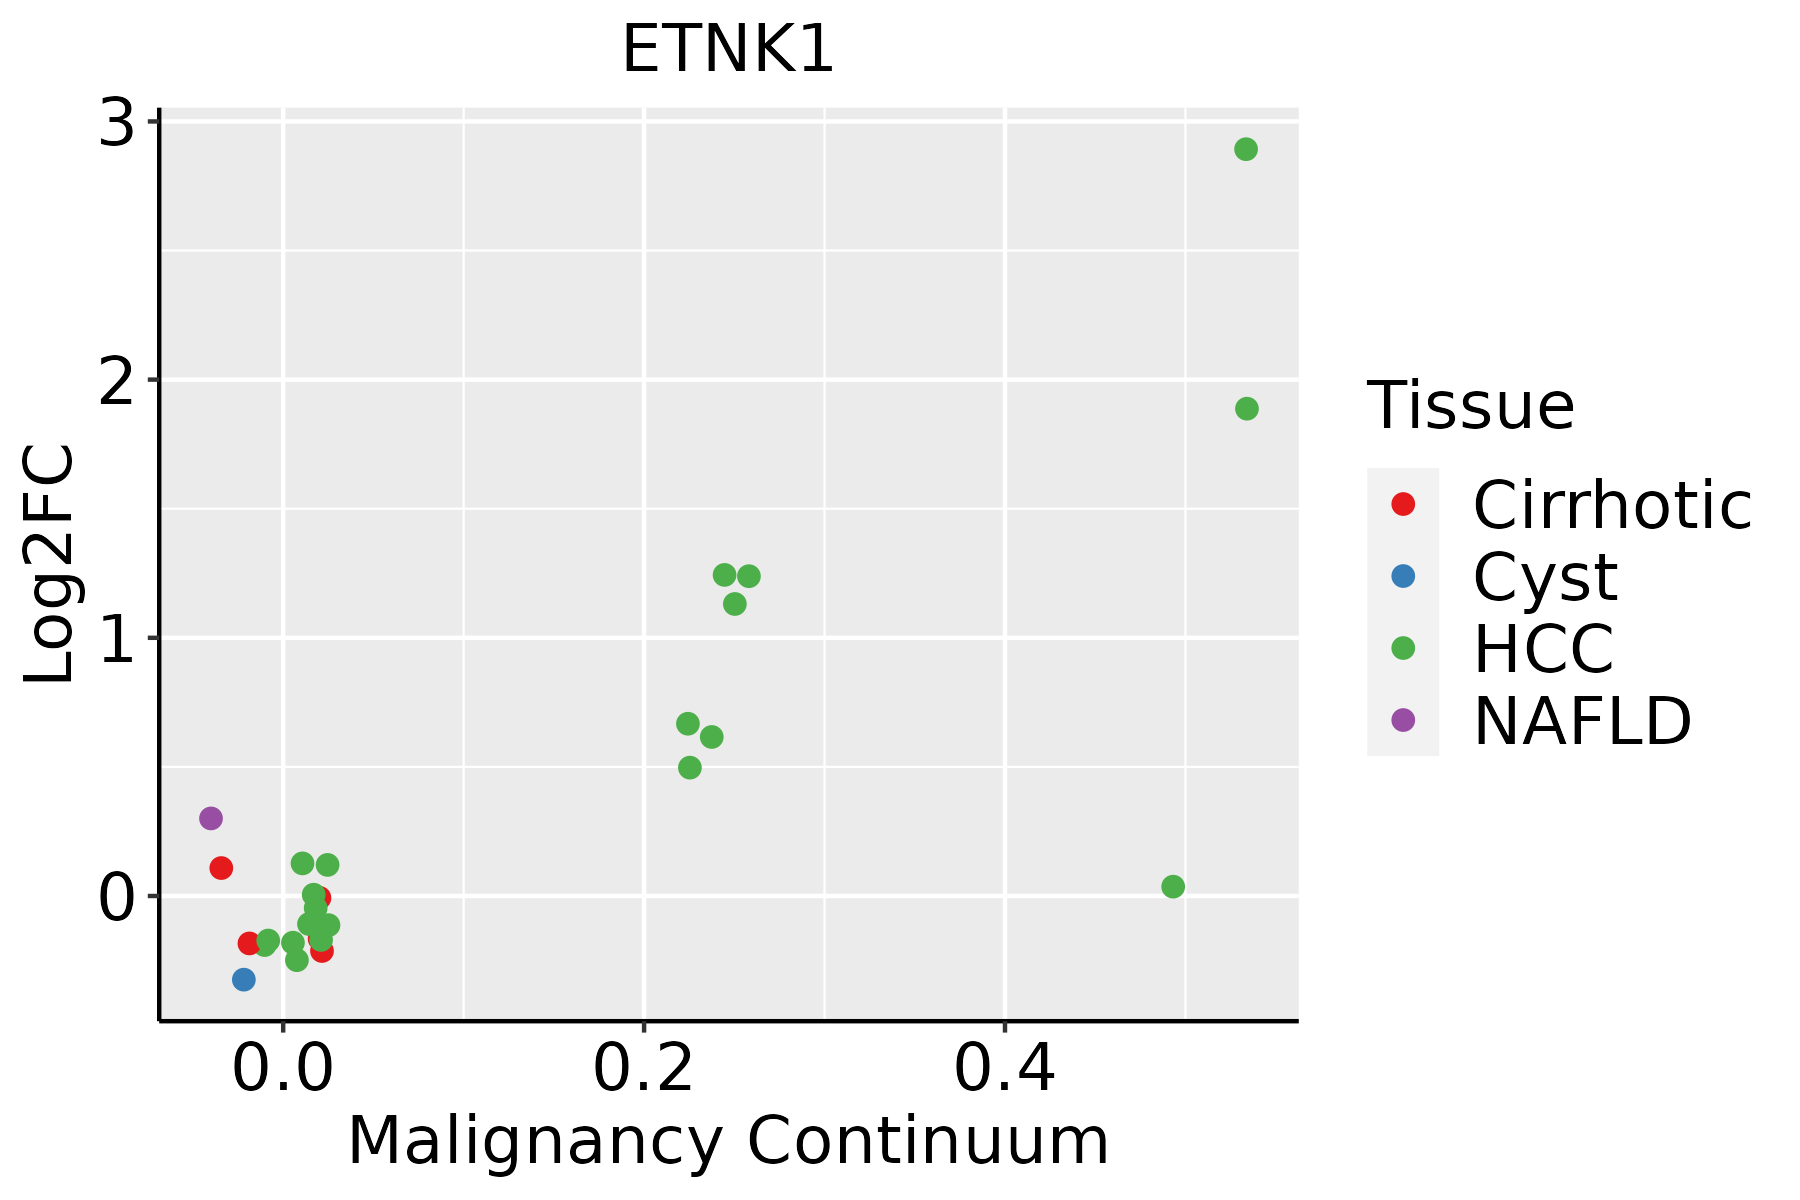 | HCC: Hepatocellular carcinoma |
| NAFLD: Non-alcoholic fatty liver disease | ||
| Lung | 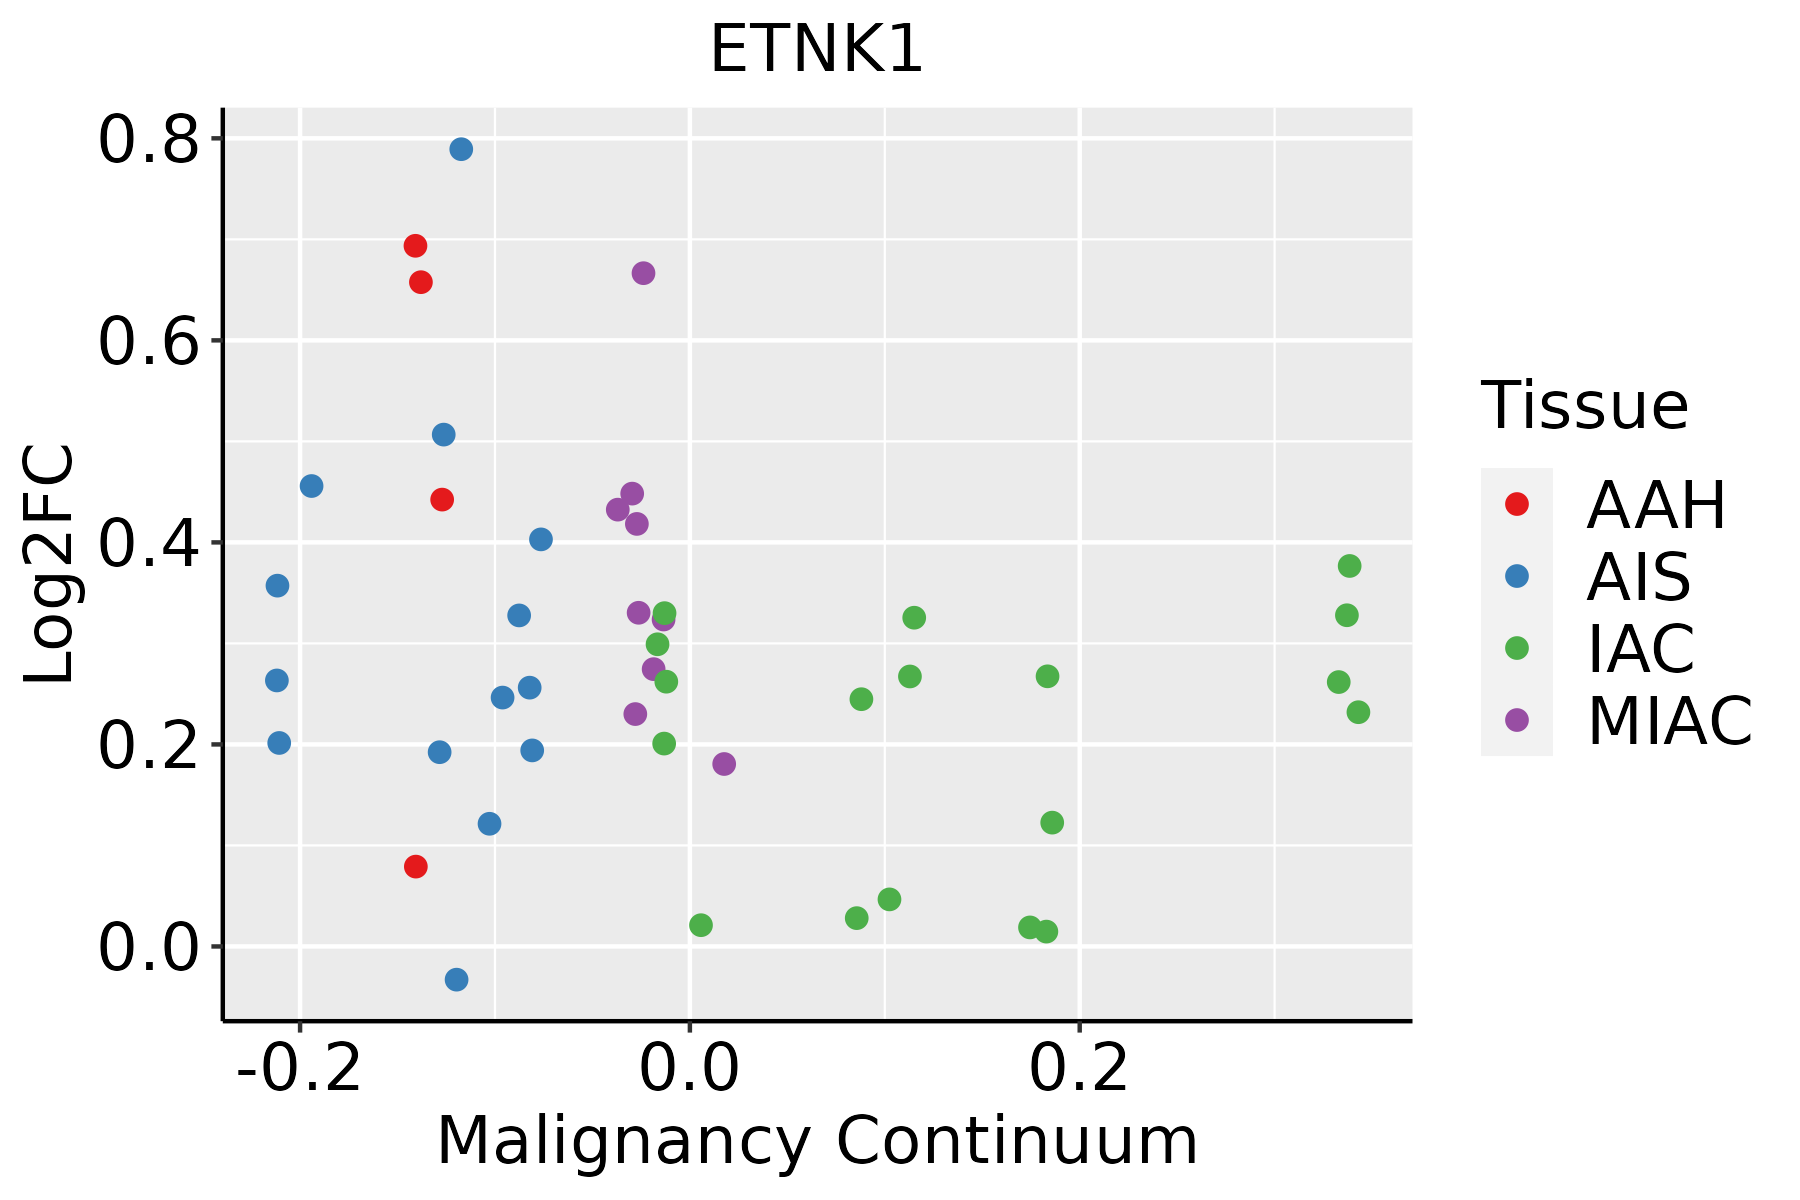 | AAH: Atypical adenomatous hyperplasia |
| AIS: Adenocarcinoma in situ | ||
| IAC: Invasive lung adenocarcinoma | ||
| MIA: Minimally invasive adenocarcinoma | ||
| Oral Cavity |  | EOLP: Erosive Oral lichen planus |
| LP: leukoplakia | ||
| NEOLP: Non-erosive oral lichen planus | ||
| OSCC: Oral squamous cell carcinoma | ||
| Thyroid |  | ATC: Anaplastic thyroid cancer |
| HT: Hashimoto's thyroiditis | ||
| PTC: Papillary thyroid cancer |
| ∗log2FC in expression of this searched gene in stem-like cells from each diseased tissue sample relative to stem-like cells in normal samples in each tissue plotted against the malignancy continuum. Samples are colored based on if they are from different disease stage. |
Top |
Malignant transformation related pathway analysis |
| Find out the enriched GO biological processes and KEGG pathways involved in transition from healthy to precancer to cancer |
| Tissue | Disease Stage | Enriched GO biological Processes |
| Colorectum | AD |  |
| Colorectum | SER |  |
| Colorectum | MSS |  |
| Colorectum | MSI-H |  |
| Colorectum | FAP |  |
| ∗Top 15 enriched GO BP terms are showed in the bar plot of each disease state in each tissue. Each row represents a significant GO biological process which is colored according to the -log10(p.adjust). |
| Page: 1 2 3 4 5 6 7 8 9 |
| GO ID | Tissue | Disease Stage | Description | Gene Ratio | Bg Ratio | pvalue | p.adjust | Count |
| GO:0006650 | Colorectum | AD | glycerophospholipid metabolic process | 83/3918 | 306/18723 | 5.40e-03 | 3.55e-02 | 83 |
| GO:0006644 | Colorectum | AD | phospholipid metabolic process | 101/3918 | 383/18723 | 5.80e-03 | 3.67e-02 | 101 |
| GO:0045017 | Colorectum | AD | glycerolipid biosynthetic process | 69/3918 | 252/18723 | 8.33e-03 | 4.88e-02 | 69 |
| GO:0046486 | Colorectum | SER | glycerolipid metabolic process | 82/2897 | 392/18723 | 2.26e-03 | 2.17e-02 | 82 |
| GO:00066441 | Colorectum | SER | phospholipid metabolic process | 79/2897 | 383/18723 | 3.94e-03 | 3.24e-02 | 79 |
| GO:00450171 | Colorectum | SER | glycerolipid biosynthetic process | 55/2897 | 252/18723 | 4.47e-03 | 3.56e-02 | 55 |
| GO:00066501 | Colorectum | SER | glycerophospholipid metabolic process | 64/2897 | 306/18723 | 6.41e-03 | 4.60e-02 | 64 |
| GO:0008654 | Colorectum | FAP | phospholipid biosynthetic process | 54/2622 | 253/18723 | 8.88e-04 | 9.08e-03 | 54 |
| GO:00066502 | Colorectum | FAP | glycerophospholipid metabolic process | 62/2622 | 306/18723 | 1.54e-03 | 1.38e-02 | 62 |
| GO:00066442 | Colorectum | FAP | phospholipid metabolic process | 74/2622 | 383/18723 | 2.24e-03 | 1.83e-02 | 74 |
| GO:0046474 | Colorectum | FAP | glycerophospholipid biosynthetic process | 44/2622 | 211/18723 | 3.98e-03 | 2.76e-02 | 44 |
| GO:00450172 | Colorectum | FAP | glycerolipid biosynthetic process | 50/2622 | 252/18723 | 6.32e-03 | 3.95e-02 | 50 |
| GO:00086541 | Colorectum | CRC | phospholipid biosynthetic process | 49/2078 | 253/18723 | 7.07e-05 | 1.51e-03 | 49 |
| GO:00066503 | Colorectum | CRC | glycerophospholipid metabolic process | 55/2078 | 306/18723 | 2.10e-04 | 3.55e-03 | 55 |
| GO:00450173 | Colorectum | CRC | glycerolipid biosynthetic process | 47/2078 | 252/18723 | 2.47e-04 | 4.06e-03 | 47 |
| GO:00066443 | Colorectum | CRC | phospholipid metabolic process | 65/2078 | 383/18723 | 3.21e-04 | 4.95e-03 | 65 |
| GO:00464741 | Colorectum | CRC | glycerophospholipid biosynthetic process | 40/2078 | 211/18723 | 4.91e-04 | 7.02e-03 | 40 |
| GO:00464861 | Colorectum | CRC | glycerolipid metabolic process | 64/2078 | 392/18723 | 1.01e-03 | 1.19e-02 | 64 |
| GO:00086544 | Esophagus | ESCC | phospholipid biosynthetic process | 162/8552 | 253/18723 | 2.59e-09 | 5.73e-08 | 162 |
| GO:00464744 | Esophagus | ESCC | glycerophospholipid biosynthetic process | 135/8552 | 211/18723 | 5.75e-08 | 1.02e-06 | 135 |
| Page: 1 2 |
| Pathway ID | Tissue | Disease Stage | Description | Gene Ratio | Bg Ratio | pvalue | p.adjust | qvalue | Count |
| Page: 1 |
Top |
Cell-cell communication analysis |
| Identification of potential cell-cell interactions between two cell types and their ligand-receptor pairs for different disease states |
| Ligand | Receptor | LRpair | Pathway | Tissue | Disease Stage |
| Page: 1 |
Top |
Single-cell gene regulatory network inference analysis |
| Find out the significant the regulons (TFs) and the target genes of each regulon across cell types for different disease states |
| TF | Cell Type | Tissue | Disease Stage | Target Gene | RSS | Regulon Activity |
| ∗The dot plots of a searched regulon are shown for all cell subpopulations in each disease state of each tissue based on the regulon specific score inferred using pySCENIC and by calculating the average expression. |
| Page: 1 |
Top |
Somatic mutation of malignant transformation related genes |
| Annotation of somatic variants for genes involved in malignant transformation |
| Hugo Symbol | Variant Class | Variant Classification | dbSNP RS | HGVSc | HGVSp | HGVSp Short | SWISSPROT | BIOTYPE | SIFT | PolyPhen | Tumor Sample Barcode | Tissue | Histology | Sex | Age | Stage | Therapy Types | Drugs | Outcome |
| ETNK1 | SNV | Missense_Mutation | c.614N>A | p.Gly205Glu | p.G205E | Q9HBU6 | protein_coding | deleterious(0) | probably_damaging(0.999) | TCGA-G9-6498-01 | Prostate | prostate adenocarcinoma | Male | <65 | 7 | Unknown | Unknown | PD | |
| ETNK1 | SNV | Missense_Mutation | rs749131482 | c.1112N>A | p.Arg371His | p.R371H | Q9HBU6 | protein_coding | tolerated(0.09) | benign(0.015) | TCGA-BR-8487-01 | Stomach | stomach adenocarcinoma | Female | <65 | I/II | Unknown | Unknown | SD |
| ETNK1 | SNV | Missense_Mutation | c.632N>C | p.Ile211Thr | p.I211T | Q9HBU6 | protein_coding | tolerated(0.05) | benign(0.292) | TCGA-CD-8532-01 | Stomach | stomach adenocarcinoma | Male | <65 | I/II | Unknown | Unknown | PD | |
| ETNK1 | SNV | Missense_Mutation | novel | c.560N>A | p.Arg187Gln | p.R187Q | Q9HBU6 | protein_coding | tolerated(0.92) | benign(0.091) | TCGA-VQ-A8P2-01 | Stomach | stomach adenocarcinoma | Male | >=65 | III/IV | Unspecific | Complete Response | |
| ETNK1 | insertion | Frame_Shift_Ins | novel | c.639_640insCTACATCCTCCAT | p.Glu214LeufsTer5 | p.E214Lfs*5 | Q9HBU6 | protein_coding | TCGA-DJ-A3VL-01 | Thyroid | thyroid carcinoma | Male | <65 | I/II | Unknown | Unknown | PD |
| Page: 1 2 3 4 5 |
Top |
Related drugs of malignant transformation related genes |
| Identification of chemicals and drugs interact with genes involved in malignant transfromation |
| (DGIdb 4.0) |
| Entrez ID | Symbol | Category | Interaction Types | Drug Claim Name | Drug Name | PMIDs |
| Page: 1 |

Copyright 2023-Present -The University of Texas Health Science Center at Houston |