
|
|||||
|
 | |
| |
| |
| |
| |
| |
|
Gene: EPRS |
Gene summary for EPRS |
| Gene information | Species | Human | Gene symbol | EPRS | Gene ID | 2058 |
| Gene name | glutamyl-prolyl-tRNA synthetase 1 | |
| Gene Alias | EARS | |
| Cytomap | 1q41 | |
| Gene Type | protein-coding | GO ID | GO:0002376 | UniProtAcc | P07814 |
Top |
Malignant transformation analysis |
| Identification of the aberrant gene expression in precancerous and cancerous lesions by comparing the gene expression of stem-like cells in diseased tissues with normal stem cells |
| Entrez ID | Symbol | Replicates | Species | Organ | Tissue | Adj P-value | Log2FC | Malignancy |
| 2058 | EPRS | LZE2T | Human | Esophagus | ESCC | 1.82e-13 | 1.72e+00 | 0.082 |
| 2058 | EPRS | LZE4T | Human | Esophagus | ESCC | 1.03e-23 | 7.70e-01 | 0.0811 |
| 2058 | EPRS | LZE7T | Human | Esophagus | ESCC | 1.22e-10 | 1.08e+00 | 0.0667 |
| 2058 | EPRS | LZE20T | Human | Esophagus | ESCC | 8.00e-04 | 2.37e-01 | 0.0662 |
| 2058 | EPRS | LZE22T | Human | Esophagus | ESCC | 2.75e-05 | 3.43e-01 | 0.068 |
| 2058 | EPRS | LZE24T | Human | Esophagus | ESCC | 1.20e-15 | 5.46e-01 | 0.0596 |
| 2058 | EPRS | LZE21T | Human | Esophagus | ESCC | 3.93e-03 | 5.03e-01 | 0.0655 |
| 2058 | EPRS | LZE6T | Human | Esophagus | ESCC | 4.15e-07 | 1.68e-01 | 0.0845 |
| 2058 | EPRS | P1T-E | Human | Esophagus | ESCC | 3.62e-10 | 7.72e-01 | 0.0875 |
| 2058 | EPRS | P2T-E | Human | Esophagus | ESCC | 3.61e-49 | 1.05e+00 | 0.1177 |
| 2058 | EPRS | P4T-E | Human | Esophagus | ESCC | 4.64e-23 | 7.07e-01 | 0.1323 |
| 2058 | EPRS | P5T-E | Human | Esophagus | ESCC | 3.16e-28 | 9.08e-01 | 0.1327 |
| 2058 | EPRS | P8T-E | Human | Esophagus | ESCC | 2.18e-21 | 4.36e-01 | 0.0889 |
| 2058 | EPRS | P9T-E | Human | Esophagus | ESCC | 5.72e-26 | 7.36e-01 | 0.1131 |
| 2058 | EPRS | P10T-E | Human | Esophagus | ESCC | 6.53e-37 | 8.16e-01 | 0.116 |
| 2058 | EPRS | P11T-E | Human | Esophagus | ESCC | 3.75e-20 | 9.36e-01 | 0.1426 |
| 2058 | EPRS | P12T-E | Human | Esophagus | ESCC | 4.39e-33 | 6.33e-01 | 0.1122 |
| 2058 | EPRS | P15T-E | Human | Esophagus | ESCC | 8.23e-37 | 9.42e-01 | 0.1149 |
| 2058 | EPRS | P16T-E | Human | Esophagus | ESCC | 2.60e-48 | 9.07e-01 | 0.1153 |
| 2058 | EPRS | P17T-E | Human | Esophagus | ESCC | 9.31e-11 | 7.42e-01 | 0.1278 |
| Page: 1 2 3 4 5 6 7 |
| Tissue | Expression Dynamics | Abbreviation |
| Esophagus | 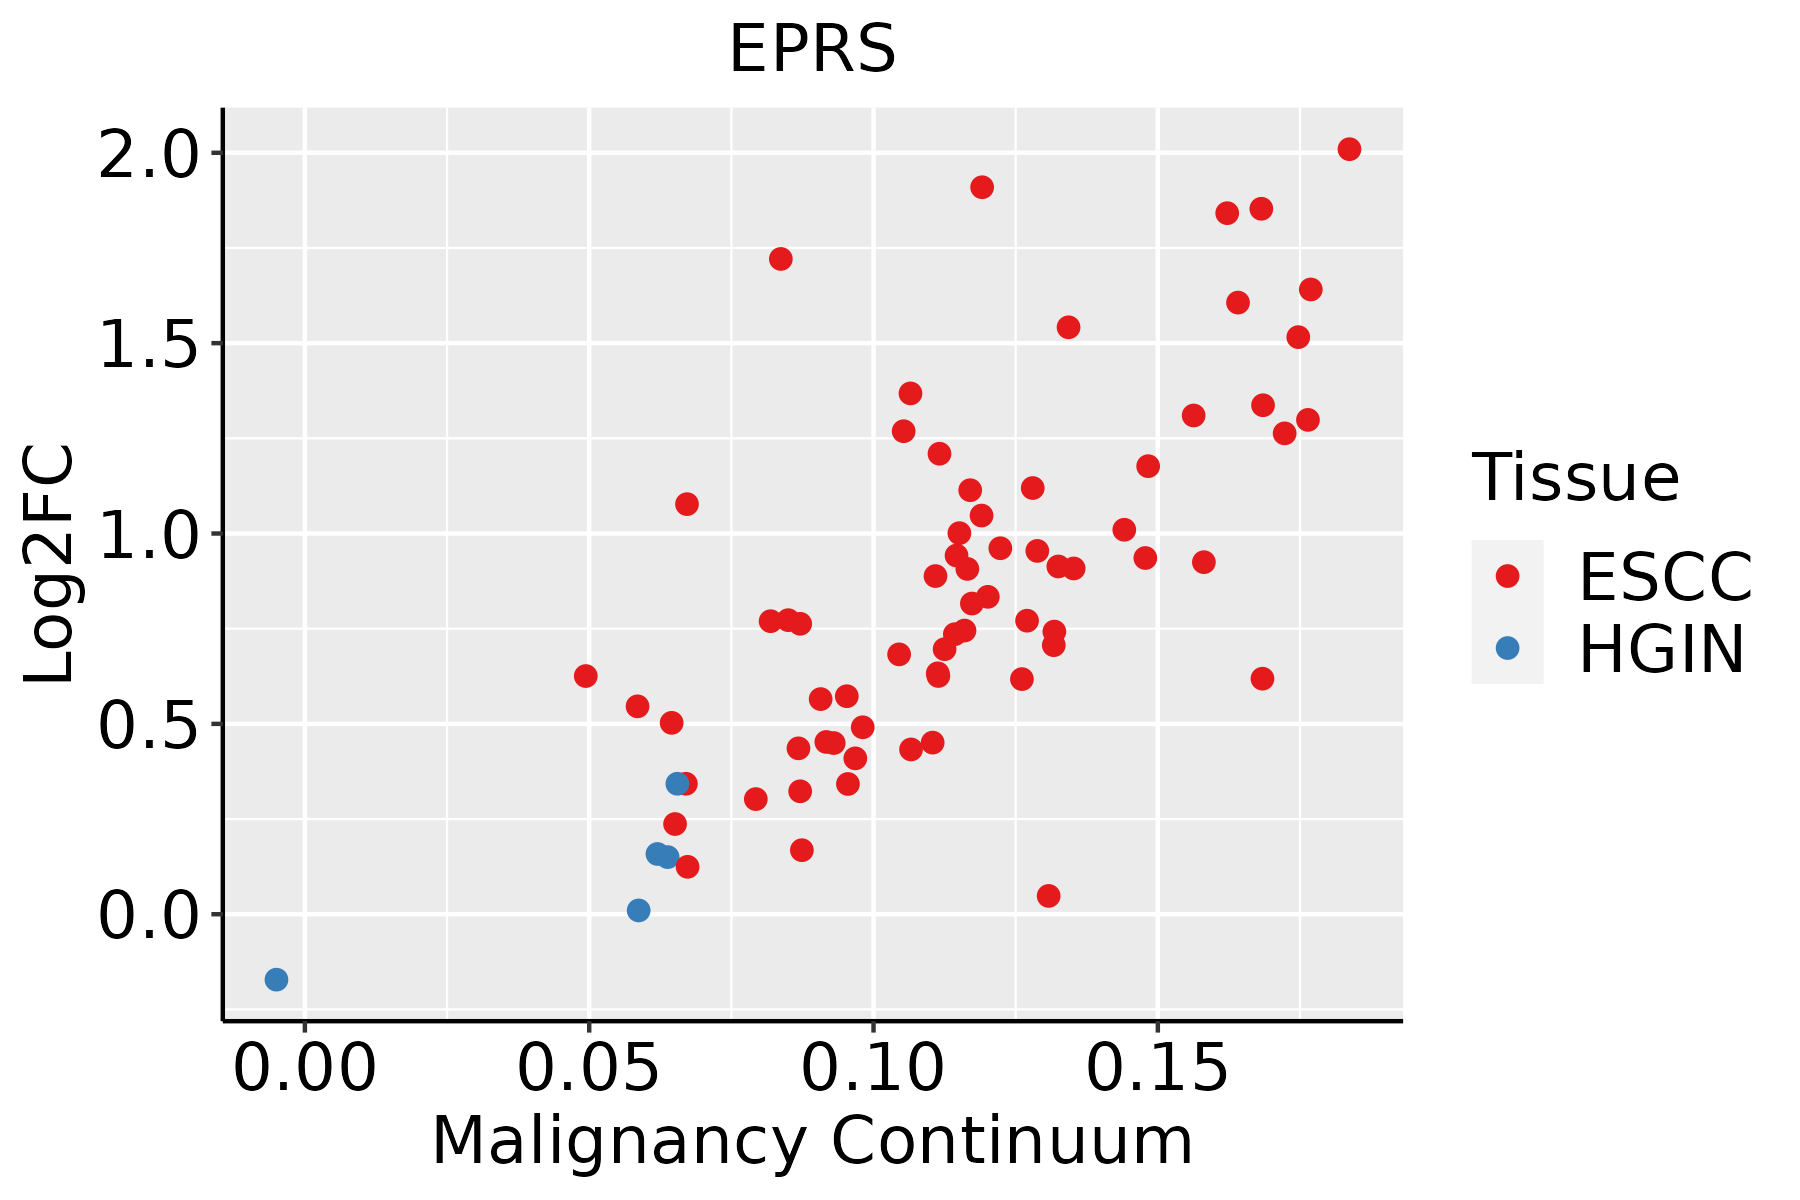 | ESCC: Esophageal squamous cell carcinoma |
| HGIN: High-grade intraepithelial neoplasias | ||
| LGIN: Low-grade intraepithelial neoplasias | ||
| Liver | 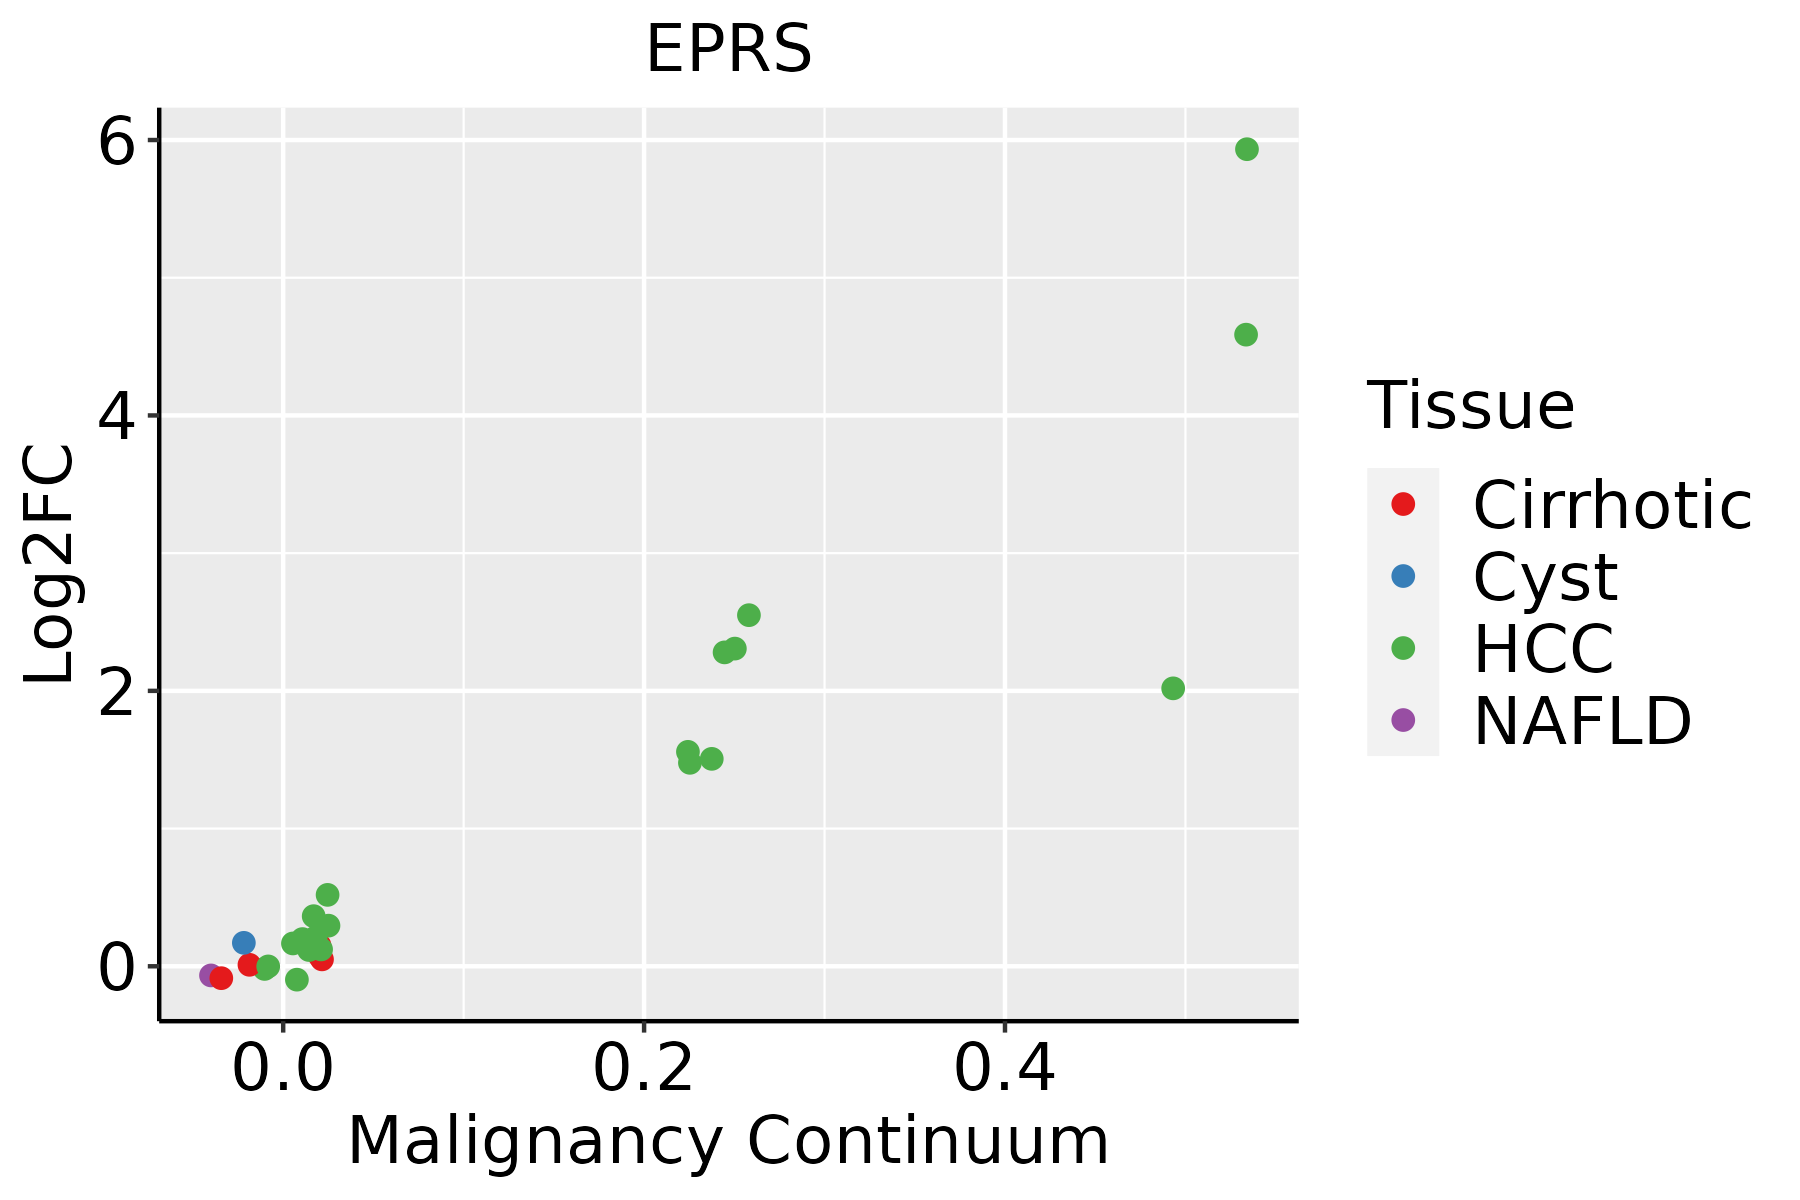 | HCC: Hepatocellular carcinoma |
| NAFLD: Non-alcoholic fatty liver disease | ||
| Oral Cavity |  | EOLP: Erosive Oral lichen planus |
| LP: leukoplakia | ||
| NEOLP: Non-erosive oral lichen planus | ||
| OSCC: Oral squamous cell carcinoma | ||
| Prostate | 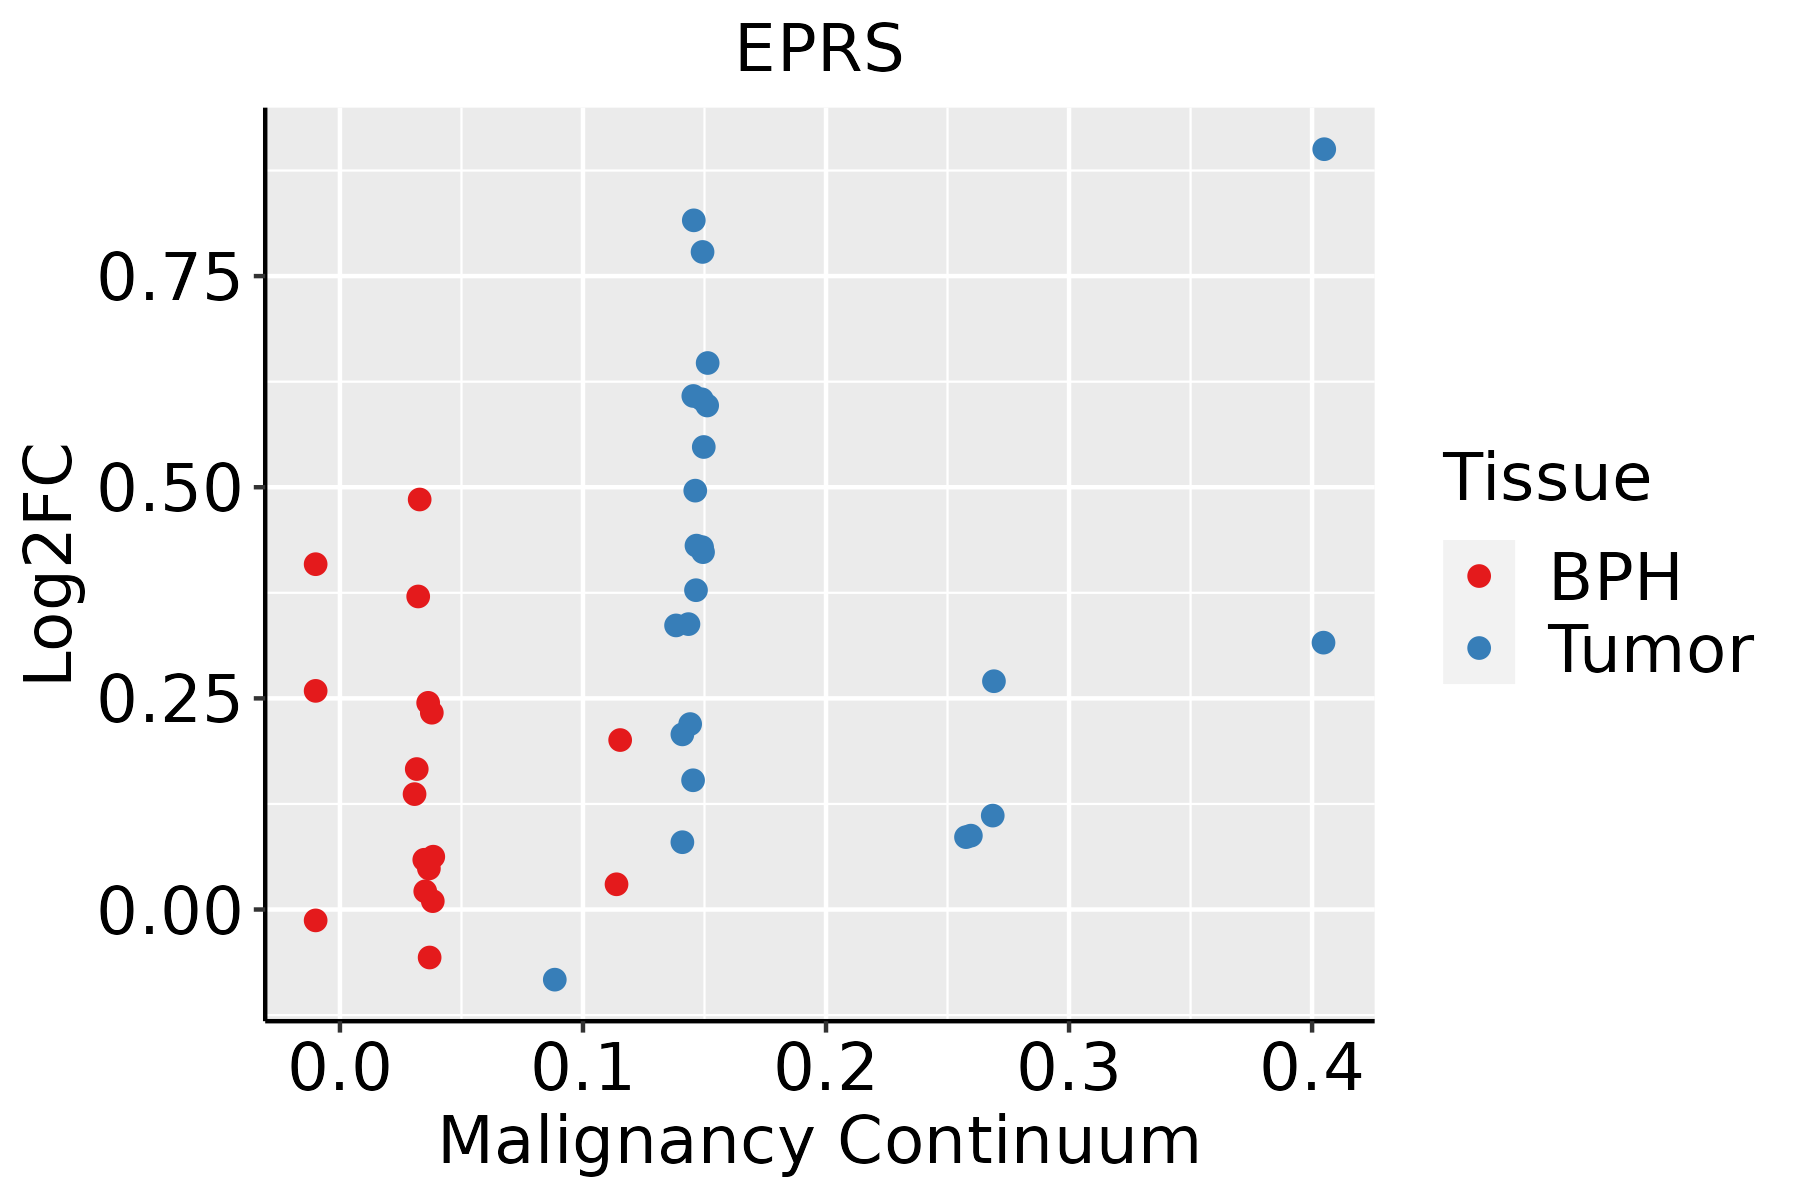 | BPH: Benign Prostatic Hyperplasia |
| Skin | 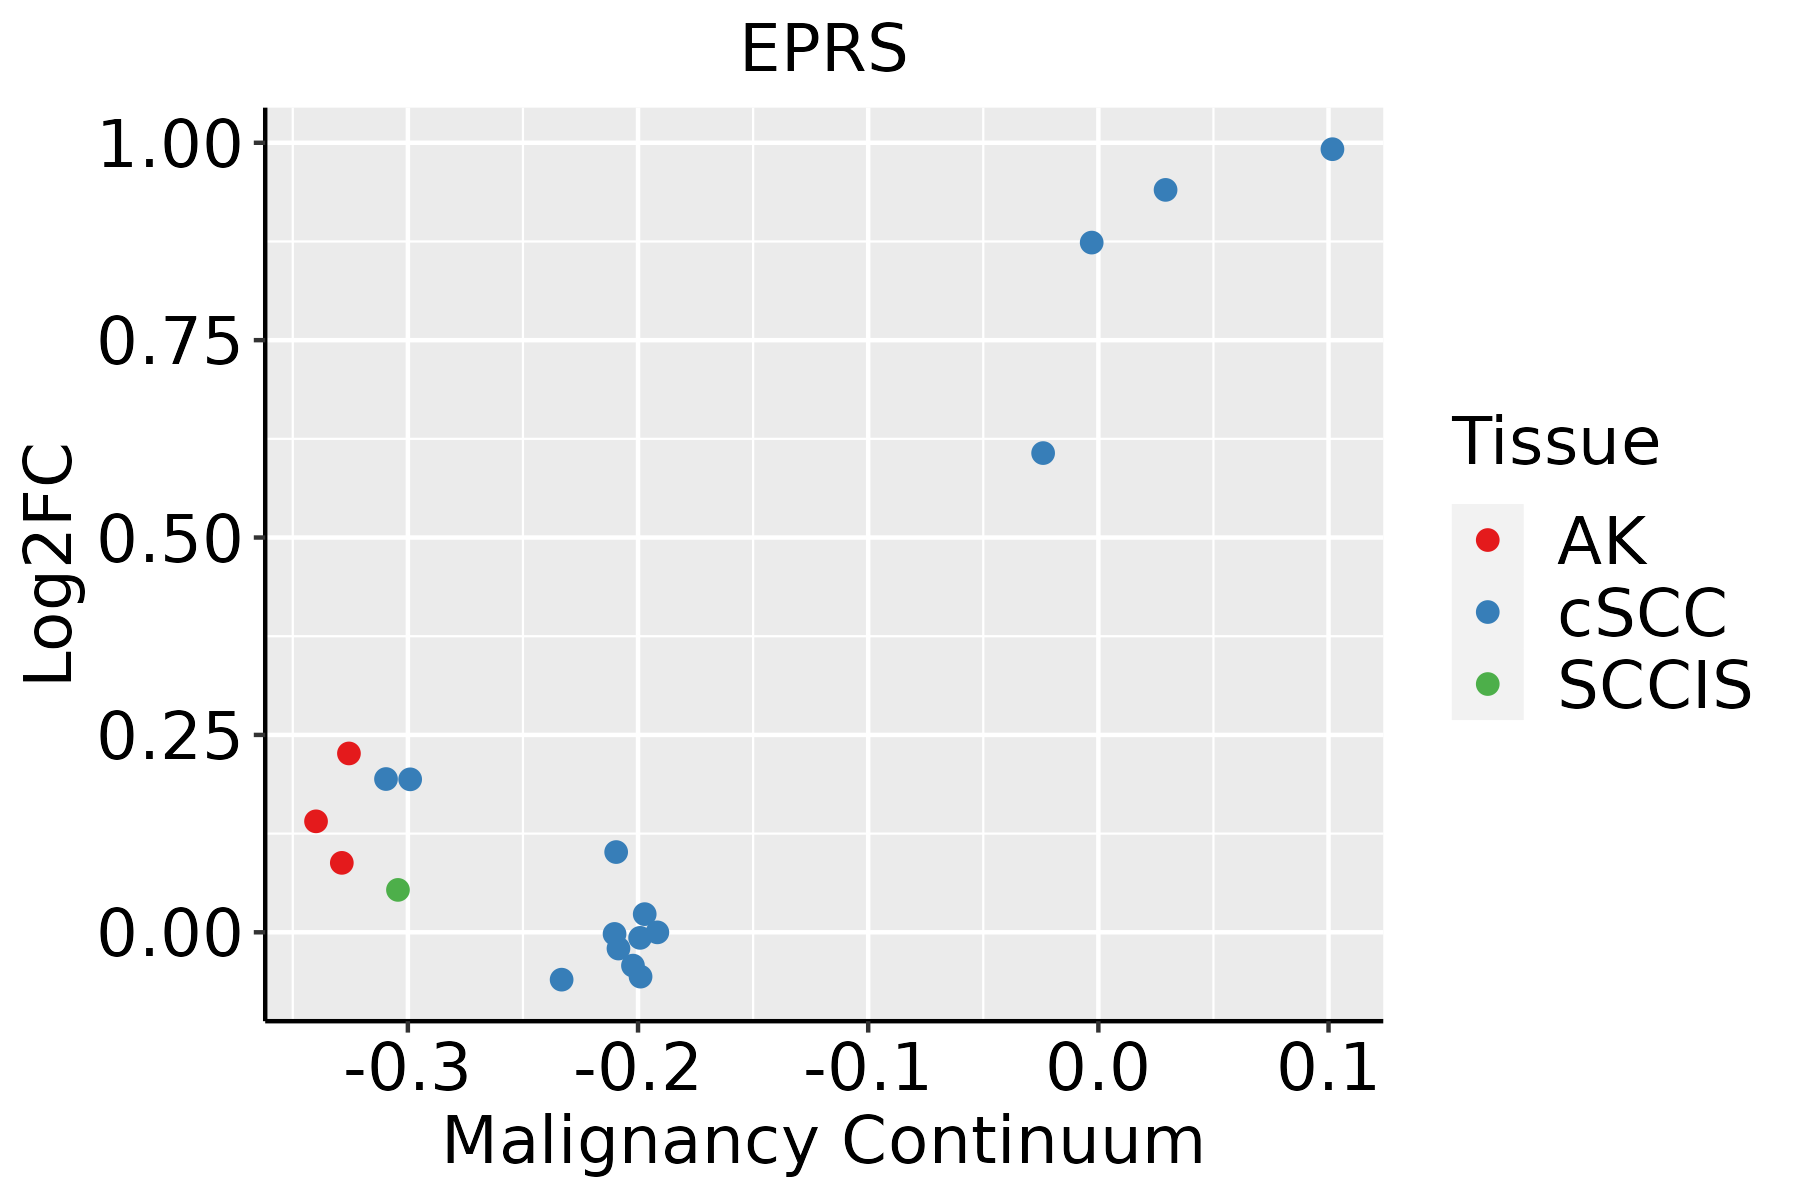 | AK: Actinic keratosis |
| cSCC: Cutaneous squamous cell carcinoma | ||
| SCCIS:squamous cell carcinoma in situ | ||
| Thyroid | 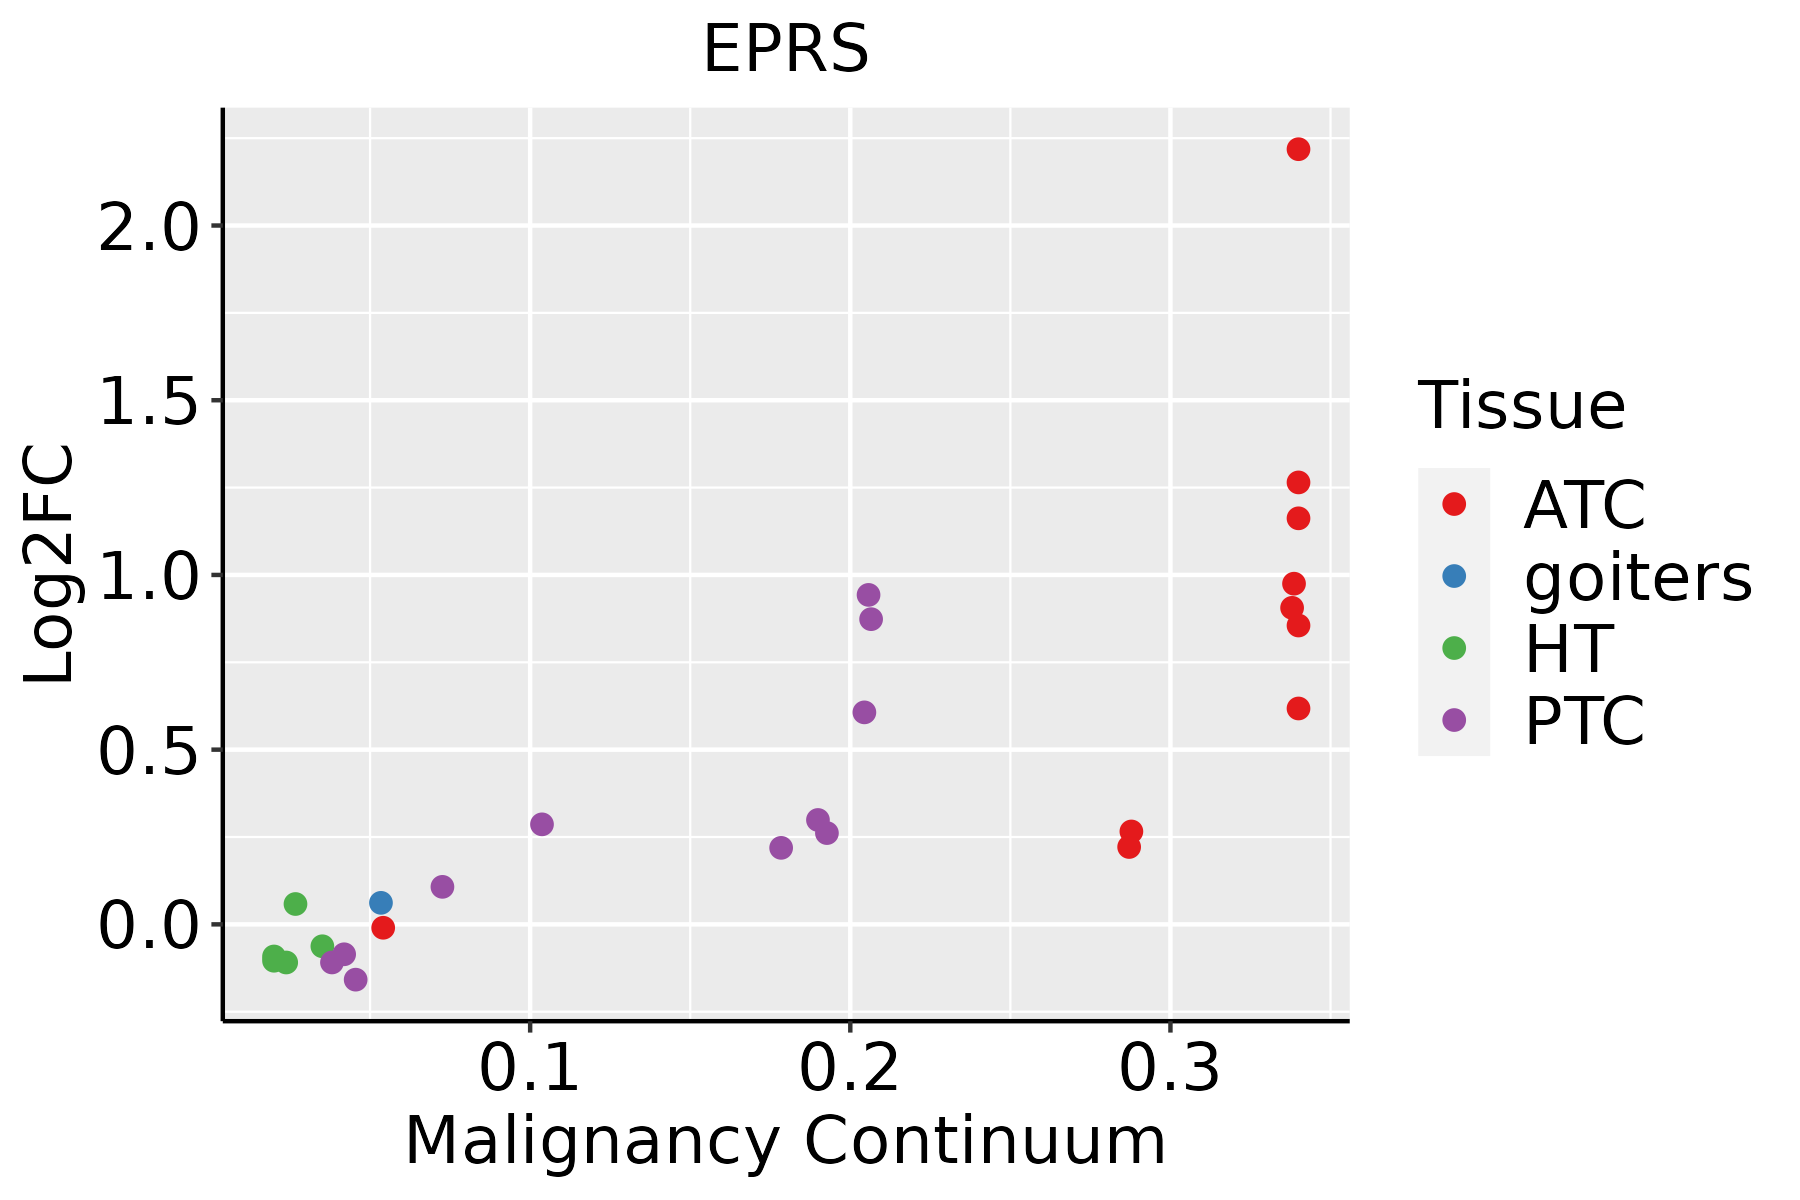 | ATC: Anaplastic thyroid cancer |
| HT: Hashimoto's thyroiditis | ||
| PTC: Papillary thyroid cancer |
| ∗log2FC in expression of this searched gene in stem-like cells from each diseased tissue sample relative to stem-like cells in normal samples in each tissue plotted against the malignancy continuum. Samples are colored based on if they are from different disease stage. |
Top |
Malignant transformation related pathway analysis |
| Find out the enriched GO biological processes and KEGG pathways involved in transition from healthy to precancer to cancer |
| Tissue | Disease Stage | Enriched GO biological Processes |
| Colorectum | AD |  |
| Colorectum | SER |  |
| Colorectum | MSS |  |
| Colorectum | MSI-H |  |
| Colorectum | FAP |  |
| ∗Top 15 enriched GO BP terms are showed in the bar plot of each disease state in each tissue. Each row represents a significant GO biological process which is colored according to the -log10(p.adjust). |
| Page: 1 2 3 4 5 6 7 8 9 |
| GO ID | Tissue | Disease Stage | Description | Gene Ratio | Bg Ratio | pvalue | p.adjust | Count |
| GO:0032868 | Colorectum | AD | response to insulin | 91/3918 | 264/18723 | 2.02e-07 | 8.48e-06 | 91 |
| GO:1901653 | Colorectum | AD | cellular response to peptide | 114/3918 | 359/18723 | 8.32e-07 | 2.88e-05 | 114 |
| GO:0032869 | Colorectum | AD | cellular response to insulin stimulus | 72/3918 | 203/18723 | 1.10e-06 | 3.68e-05 | 72 |
| GO:0006417 | Colorectum | AD | regulation of translation | 141/3918 | 468/18723 | 1.32e-06 | 4.22e-05 | 141 |
| GO:0071375 | Colorectum | AD | cellular response to peptide hormone stimulus | 95/3918 | 290/18723 | 1.50e-06 | 4.66e-05 | 95 |
| GO:0043434 | Colorectum | AD | response to peptide hormone | 126/3918 | 414/18723 | 2.70e-06 | 7.86e-05 | 126 |
| GO:0006418 | Colorectum | AD | tRNA aminoacylation for protein translation | 19/3918 | 41/18723 | 2.37e-04 | 3.03e-03 | 19 |
| GO:0043039 | Colorectum | AD | tRNA aminoacylation | 19/3918 | 44/18723 | 7.13e-04 | 7.21e-03 | 19 |
| GO:0043038 | Colorectum | AD | amino acid activation | 19/3918 | 45/18723 | 9.94e-04 | 9.28e-03 | 19 |
| GO:0006520 | Colorectum | AD | cellular amino acid metabolic process | 81/3918 | 284/18723 | 1.37e-03 | 1.19e-02 | 81 |
| GO:0010876 | Colorectum | AD | lipid localization | 120/3918 | 448/18723 | 1.59e-03 | 1.33e-02 | 120 |
| GO:0006869 | Colorectum | AD | lipid transport | 108/3918 | 398/18723 | 1.67e-03 | 1.39e-02 | 108 |
| GO:2000191 | Colorectum | AD | regulation of fatty acid transport | 14/3918 | 32/18723 | 3.03e-03 | 2.25e-02 | 14 |
| GO:00064181 | Colorectum | SER | tRNA aminoacylation for protein translation | 17/2897 | 41/18723 | 5.75e-05 | 1.35e-03 | 17 |
| GO:00328681 | Colorectum | SER | response to insulin | 65/2897 | 264/18723 | 6.70e-05 | 1.53e-03 | 65 |
| GO:19016531 | Colorectum | SER | cellular response to peptide | 83/2897 | 359/18723 | 8.03e-05 | 1.77e-03 | 83 |
| GO:00434341 | Colorectum | SER | response to peptide hormone | 93/2897 | 414/18723 | 9.61e-05 | 2.04e-03 | 93 |
| GO:00430391 | Colorectum | SER | tRNA aminoacylation | 17/2897 | 44/18723 | 1.64e-04 | 3.12e-03 | 17 |
| GO:00713751 | Colorectum | SER | cellular response to peptide hormone stimulus | 68/2897 | 290/18723 | 2.20e-04 | 3.89e-03 | 68 |
| GO:00430381 | Colorectum | SER | amino acid activation | 17/2897 | 45/18723 | 2.25e-04 | 3.91e-03 | 17 |
| Page: 1 2 |
| Pathway ID | Tissue | Disease Stage | Description | Gene Ratio | Bg Ratio | pvalue | p.adjust | qvalue | Count |
| Page: 1 |
Top |
Cell-cell communication analysis |
| Identification of potential cell-cell interactions between two cell types and their ligand-receptor pairs for different disease states |
| Ligand | Receptor | LRpair | Pathway | Tissue | Disease Stage |
| Page: 1 |
Top |
Single-cell gene regulatory network inference analysis |
| Find out the significant the regulons (TFs) and the target genes of each regulon across cell types for different disease states |
| TF | Cell Type | Tissue | Disease Stage | Target Gene | RSS | Regulon Activity |
| ∗The dot plots of a searched regulon are shown for all cell subpopulations in each disease state of each tissue based on the regulon specific score inferred using pySCENIC and by calculating the average expression. |
| Page: 1 |
Top |
Somatic mutation of malignant transformation related genes |
| Annotation of somatic variants for genes involved in malignant transformation |
| Hugo Symbol | Variant Class | Variant Classification | dbSNP RS | HGVSc | HGVSp | HGVSp Short | SWISSPROT | BIOTYPE | SIFT | PolyPhen | Tumor Sample Barcode | Tissue | Histology | Sex | Age | Stage | Therapy Types | Drugs | Outcome |
| EPRS | SNV | Missense_Mutation | rs761087757 | c.1370N>T | p.Thr457Met | p.T457M | P07814 | protein_coding | deleterious(0) | probably_damaging(0.993) | TCGA-G4-6298-01 | Colorectum | colon adenocarcinoma | Male | >=65 | III/IV | Chemotherapy | irinotecan | PD |
| EPRS | SNV | Missense_Mutation | novel | c.4449C>A | p.Phe1483Leu | p.F1483L | P07814 | protein_coding | tolerated(0.11) | possibly_damaging(0.649) | TCGA-AG-A002-01 | Colorectum | rectum adenocarcinoma | Male | <65 | I/II | Unknown | Unknown | SD |
| EPRS | insertion | Frame_Shift_Ins | novel | c.1127_1128insTATATTCCCAAAT | p.Tyr377IlefsTer6 | p.Y377Ifs*6 | P07814 | protein_coding | TCGA-AM-5820-01 | Colorectum | colon adenocarcinoma | Female | <65 | I/II | Unknown | Unknown | SD | ||
| EPRS | deletion | Frame_Shift_Del | c.3060delN | p.Glu1021LysfsTer17 | p.E1021Kfs*17 | P07814 | protein_coding | TCGA-CK-6746-01 | Colorectum | colon adenocarcinoma | Female | >=65 | I/II | Unknown | Unknown | SD | |||
| EPRS | insertion | Frame_Shift_Ins | novel | c.3060_3061insA | p.Glu1021ArgfsTer6 | p.E1021Rfs*6 | P07814 | protein_coding | TCGA-G4-6302-01 | Colorectum | colon adenocarcinoma | Female | >=65 | I/II | Unknown | Unknown | SD | ||
| EPRS | SNV | Missense_Mutation | c.3378N>A | p.Met1126Ile | p.M1126I | P07814 | protein_coding | deleterious(0.03) | possibly_damaging(0.895) | TCGA-A5-A0G1-01 | Endometrium | uterine corpus endometrioid carcinoma | Female | >=65 | I/II | Unknown | Unknown | SD | |
| EPRS | SNV | Missense_Mutation | rs372832109 | c.2648N>T | p.Ser883Leu | p.S883L | P07814 | protein_coding | tolerated(0.07) | benign(0.003) | TCGA-A5-A0G2-01 | Endometrium | uterine corpus endometrioid carcinoma | Female | <65 | III/IV | Unknown | Unknown | SD |
| EPRS | SNV | Missense_Mutation | c.4099N>T | p.Leu1367Phe | p.L1367F | P07814 | protein_coding | deleterious(0.04) | benign(0.139) | TCGA-A5-A0G9-01 | Endometrium | uterine corpus endometrioid carcinoma | Female | >=65 | I/II | Unknown | Unknown | SD | |
| EPRS | SNV | Missense_Mutation | novel | c.1112A>G | p.Tyr371Cys | p.Y371C | P07814 | protein_coding | deleterious(0) | probably_damaging(0.992) | TCGA-A5-A1OF-01 | Endometrium | uterine corpus endometrioid carcinoma | Female | <65 | I/II | Unknown | Unknown | SD |
| EPRS | SNV | Missense_Mutation | novel | c.973G>A | p.Glu325Lys | p.E325K | P07814 | protein_coding | deleterious(0.03) | possibly_damaging(0.874) | TCGA-A5-A1OF-01 | Endometrium | uterine corpus endometrioid carcinoma | Female | <65 | I/II | Unknown | Unknown | SD |
| Page: 1 2 3 4 5 6 7 8 9 10 11 12 13 14 15 16 17 18 |
Top |
Related drugs of malignant transformation related genes |
| Identification of chemicals and drugs interact with genes involved in malignant transfromation |
| (DGIdb 4.0) |
| Entrez ID | Symbol | Category | Interaction Types | Drug Claim Name | Drug Name | PMIDs |
| Page: 1 |

Copyright 2023-Present -The University of Texas Health Science Center at Houston |