
|
|||||
|
 | |
| |
| |
| |
| |
| |
|
Gene: DEGS1 |
Gene summary for DEGS1 |
| Gene information | Species | Human | Gene symbol | DEGS1 | Gene ID | 8560 |
| Gene name | delta 4-desaturase, sphingolipid 1 | |
| Gene Alias | DEGS | |
| Cytomap | 1q42.11 | |
| Gene Type | protein-coding | GO ID | GO:0006082 | UniProtAcc | A0A024R3P1 |
Top |
Malignant transformation analysis |
| Identification of the aberrant gene expression in precancerous and cancerous lesions by comparing the gene expression of stem-like cells in diseased tissues with normal stem cells |
| Entrez ID | Symbol | Replicates | Species | Organ | Tissue | Adj P-value | Log2FC | Malignancy |
| 8560 | DEGS1 | LZE4T | Human | Esophagus | ESCC | 7.88e-21 | 9.54e-01 | 0.0811 |
| 8560 | DEGS1 | LZE7T | Human | Esophagus | ESCC | 1.08e-06 | 7.94e-01 | 0.0667 |
| 8560 | DEGS1 | LZE8T | Human | Esophagus | ESCC | 6.08e-06 | -9.21e-02 | 0.067 |
| 8560 | DEGS1 | LZE24T | Human | Esophagus | ESCC | 6.61e-04 | 3.33e-01 | 0.0596 |
| 8560 | DEGS1 | LZE6T | Human | Esophagus | ESCC | 2.38e-02 | 5.00e-01 | 0.0845 |
| 8560 | DEGS1 | P1T-E | Human | Esophagus | ESCC | 4.00e-03 | 5.50e-01 | 0.0875 |
| 8560 | DEGS1 | P2T-E | Human | Esophagus | ESCC | 1.04e-45 | 1.06e+00 | 0.1177 |
| 8560 | DEGS1 | P4T-E | Human | Esophagus | ESCC | 4.34e-36 | 1.17e+00 | 0.1323 |
| 8560 | DEGS1 | P5T-E | Human | Esophagus | ESCC | 2.35e-24 | 7.76e-01 | 0.1327 |
| 8560 | DEGS1 | P8T-E | Human | Esophagus | ESCC | 1.48e-21 | 2.65e-01 | 0.0889 |
| 8560 | DEGS1 | P9T-E | Human | Esophagus | ESCC | 1.09e-29 | 8.53e-01 | 0.1131 |
| 8560 | DEGS1 | P10T-E | Human | Esophagus | ESCC | 1.23e-58 | 1.29e+00 | 0.116 |
| 8560 | DEGS1 | P11T-E | Human | Esophagus | ESCC | 1.00e-28 | 1.58e+00 | 0.1426 |
| 8560 | DEGS1 | P12T-E | Human | Esophagus | ESCC | 1.42e-45 | 1.10e+00 | 0.1122 |
| 8560 | DEGS1 | P15T-E | Human | Esophagus | ESCC | 2.19e-33 | 1.07e+00 | 0.1149 |
| 8560 | DEGS1 | P16T-E | Human | Esophagus | ESCC | 3.91e-34 | 8.25e-01 | 0.1153 |
| 8560 | DEGS1 | P17T-E | Human | Esophagus | ESCC | 3.76e-07 | 3.56e-01 | 0.1278 |
| 8560 | DEGS1 | P19T-E | Human | Esophagus | ESCC | 9.12e-15 | 1.49e+00 | 0.1662 |
| 8560 | DEGS1 | P20T-E | Human | Esophagus | ESCC | 1.11e-57 | 1.50e+00 | 0.1124 |
| 8560 | DEGS1 | P21T-E | Human | Esophagus | ESCC | 1.03e-55 | 1.67e+00 | 0.1617 |
| Page: 1 2 3 4 5 6 |
| Tissue | Expression Dynamics | Abbreviation |
| Esophagus |  | ESCC: Esophageal squamous cell carcinoma |
| HGIN: High-grade intraepithelial neoplasias | ||
| LGIN: Low-grade intraepithelial neoplasias | ||
| Liver | 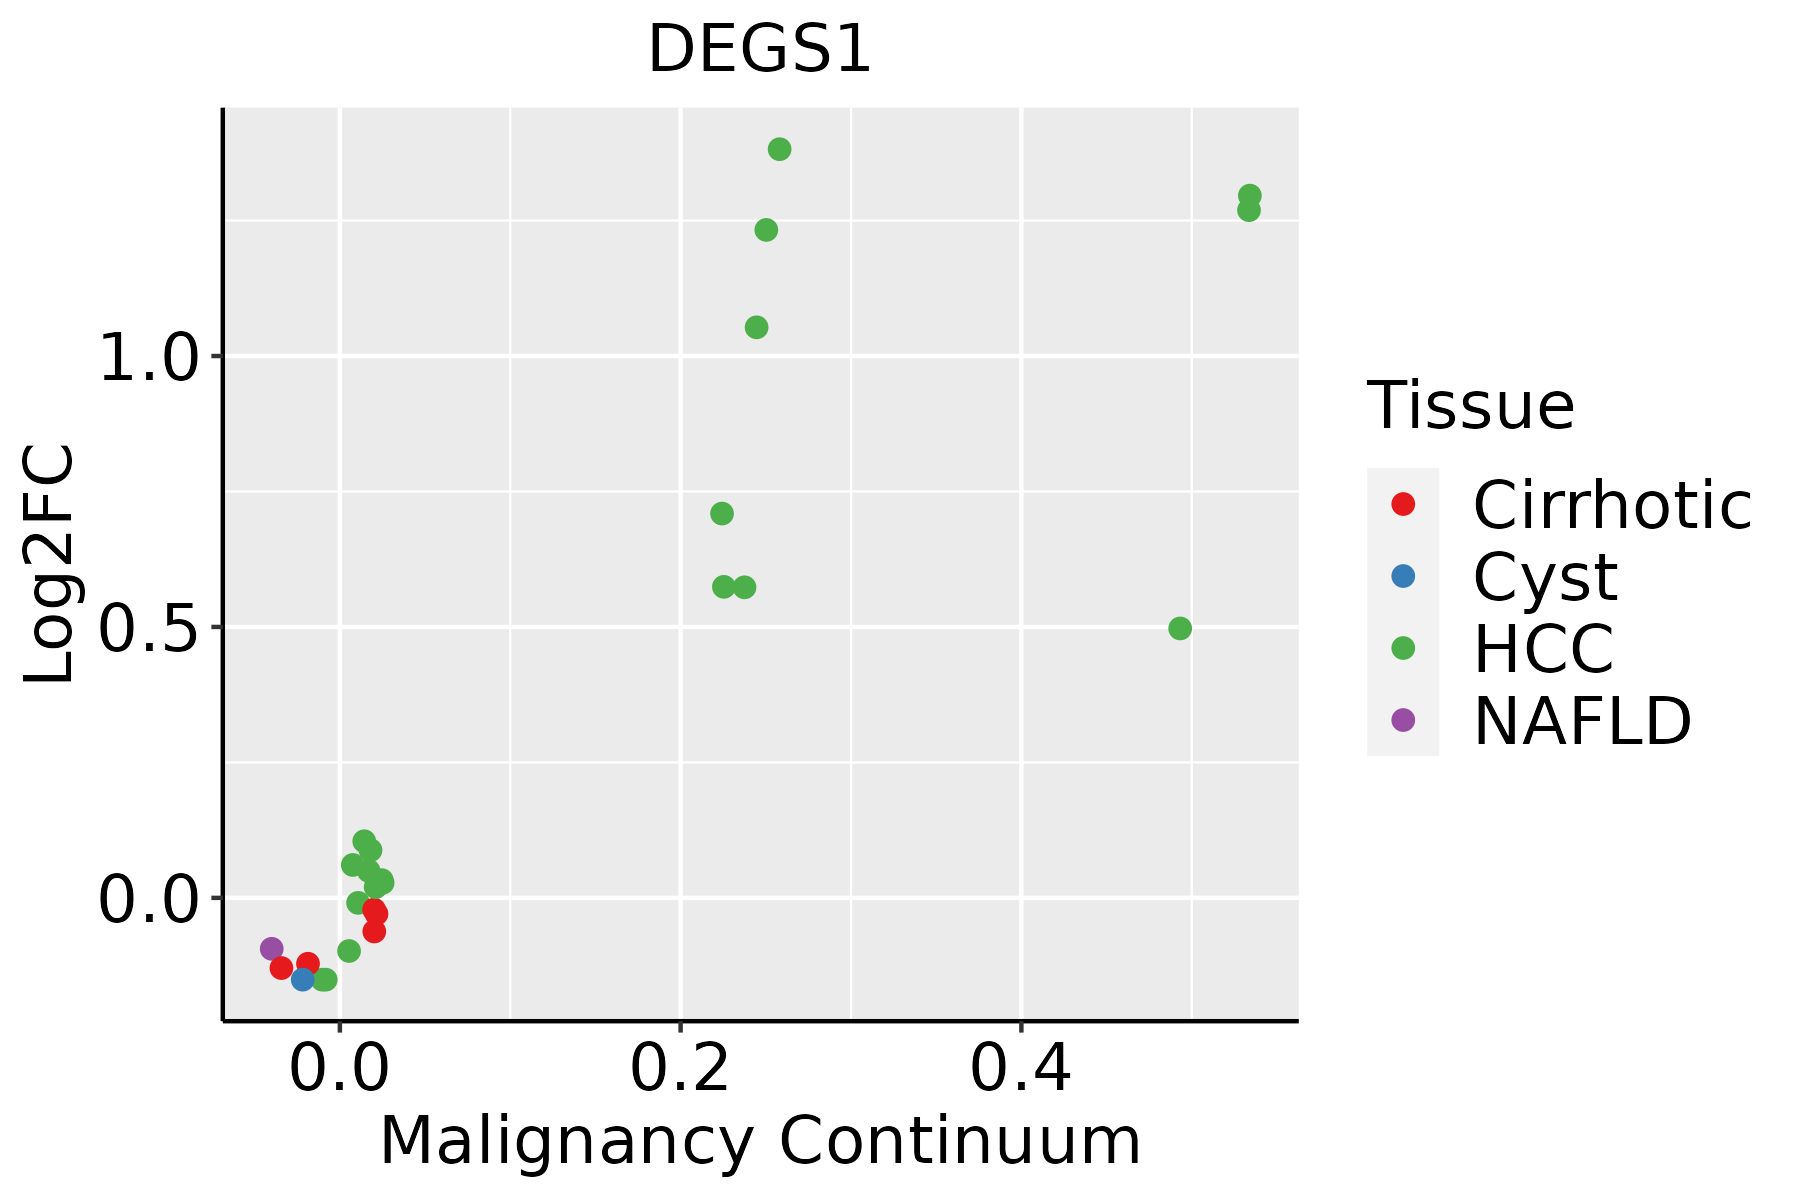 | HCC: Hepatocellular carcinoma |
| NAFLD: Non-alcoholic fatty liver disease | ||
| Oral Cavity | 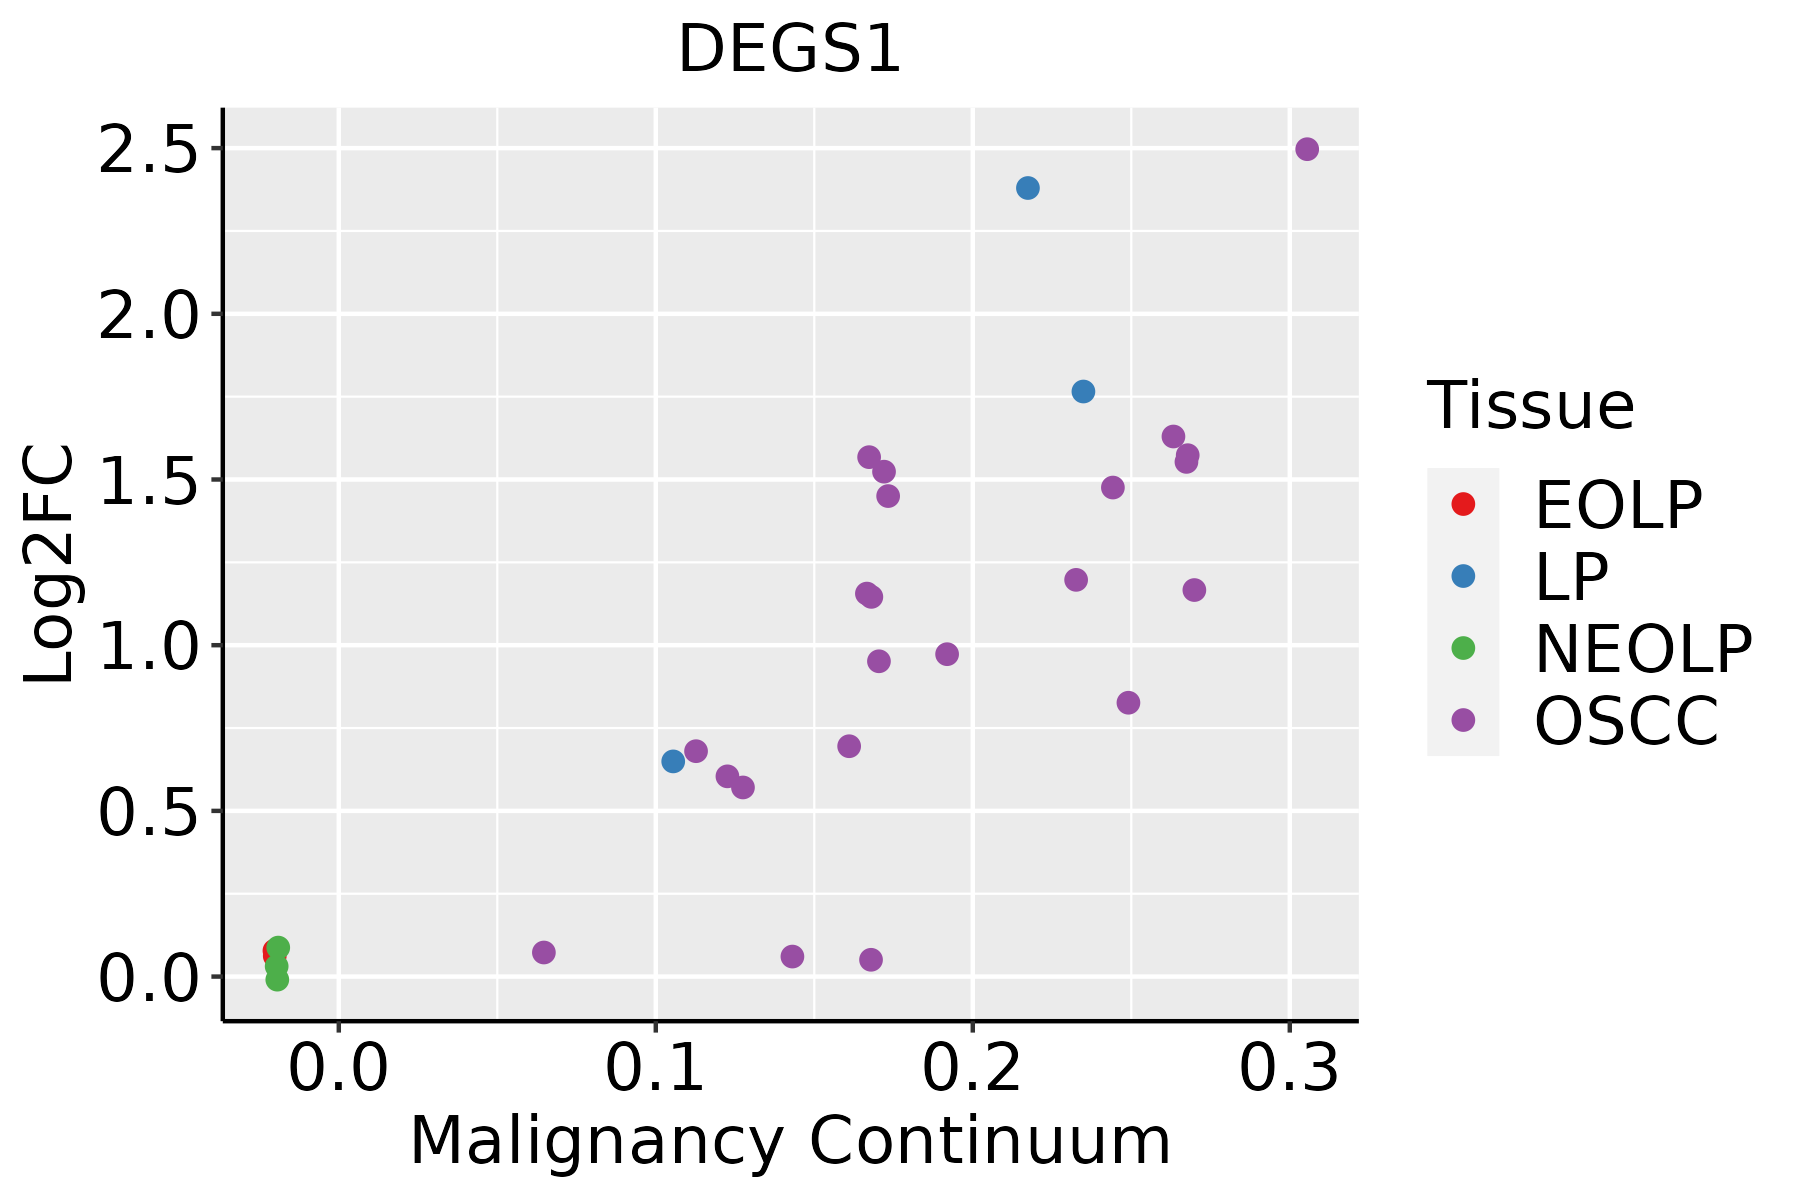 | EOLP: Erosive Oral lichen planus |
| LP: leukoplakia | ||
| NEOLP: Non-erosive oral lichen planus | ||
| OSCC: Oral squamous cell carcinoma | ||
| Prostate | 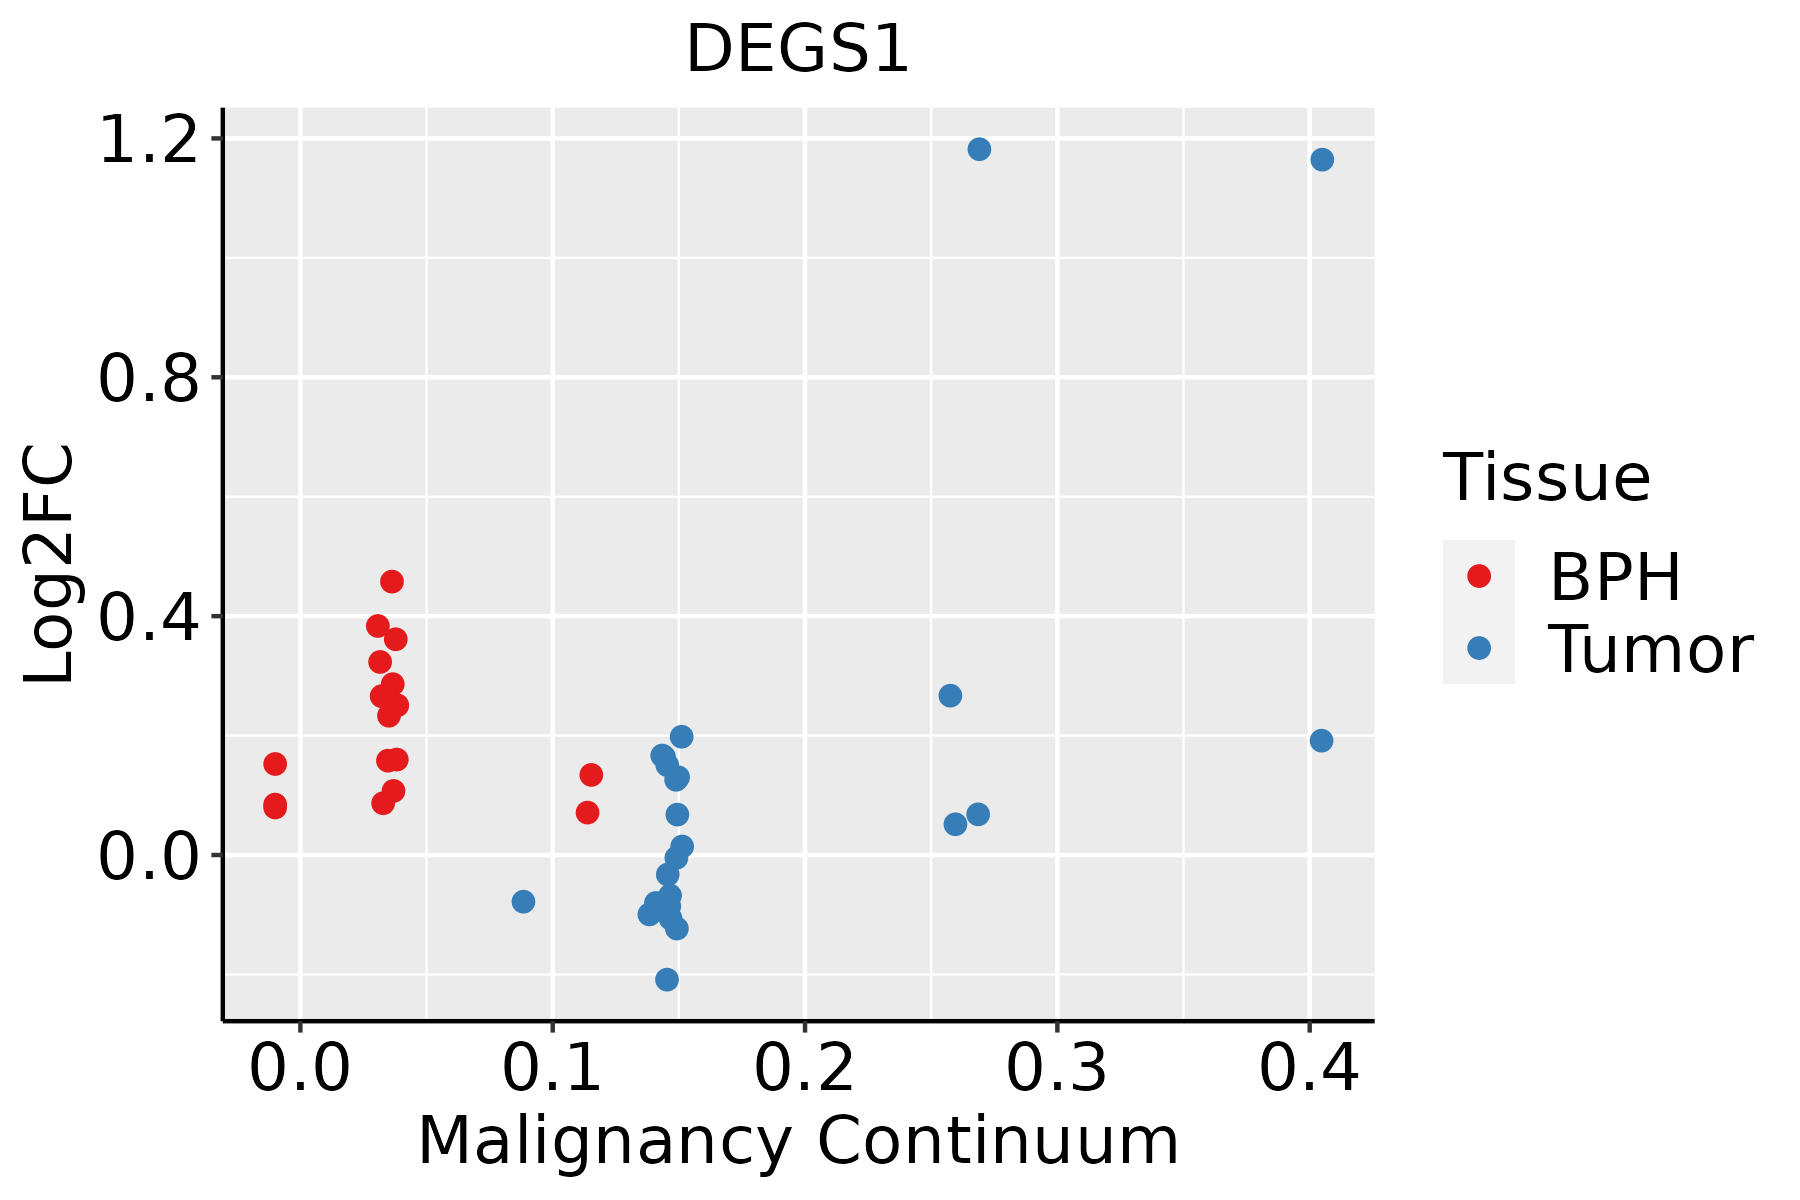 | BPH: Benign Prostatic Hyperplasia |
| Skin | 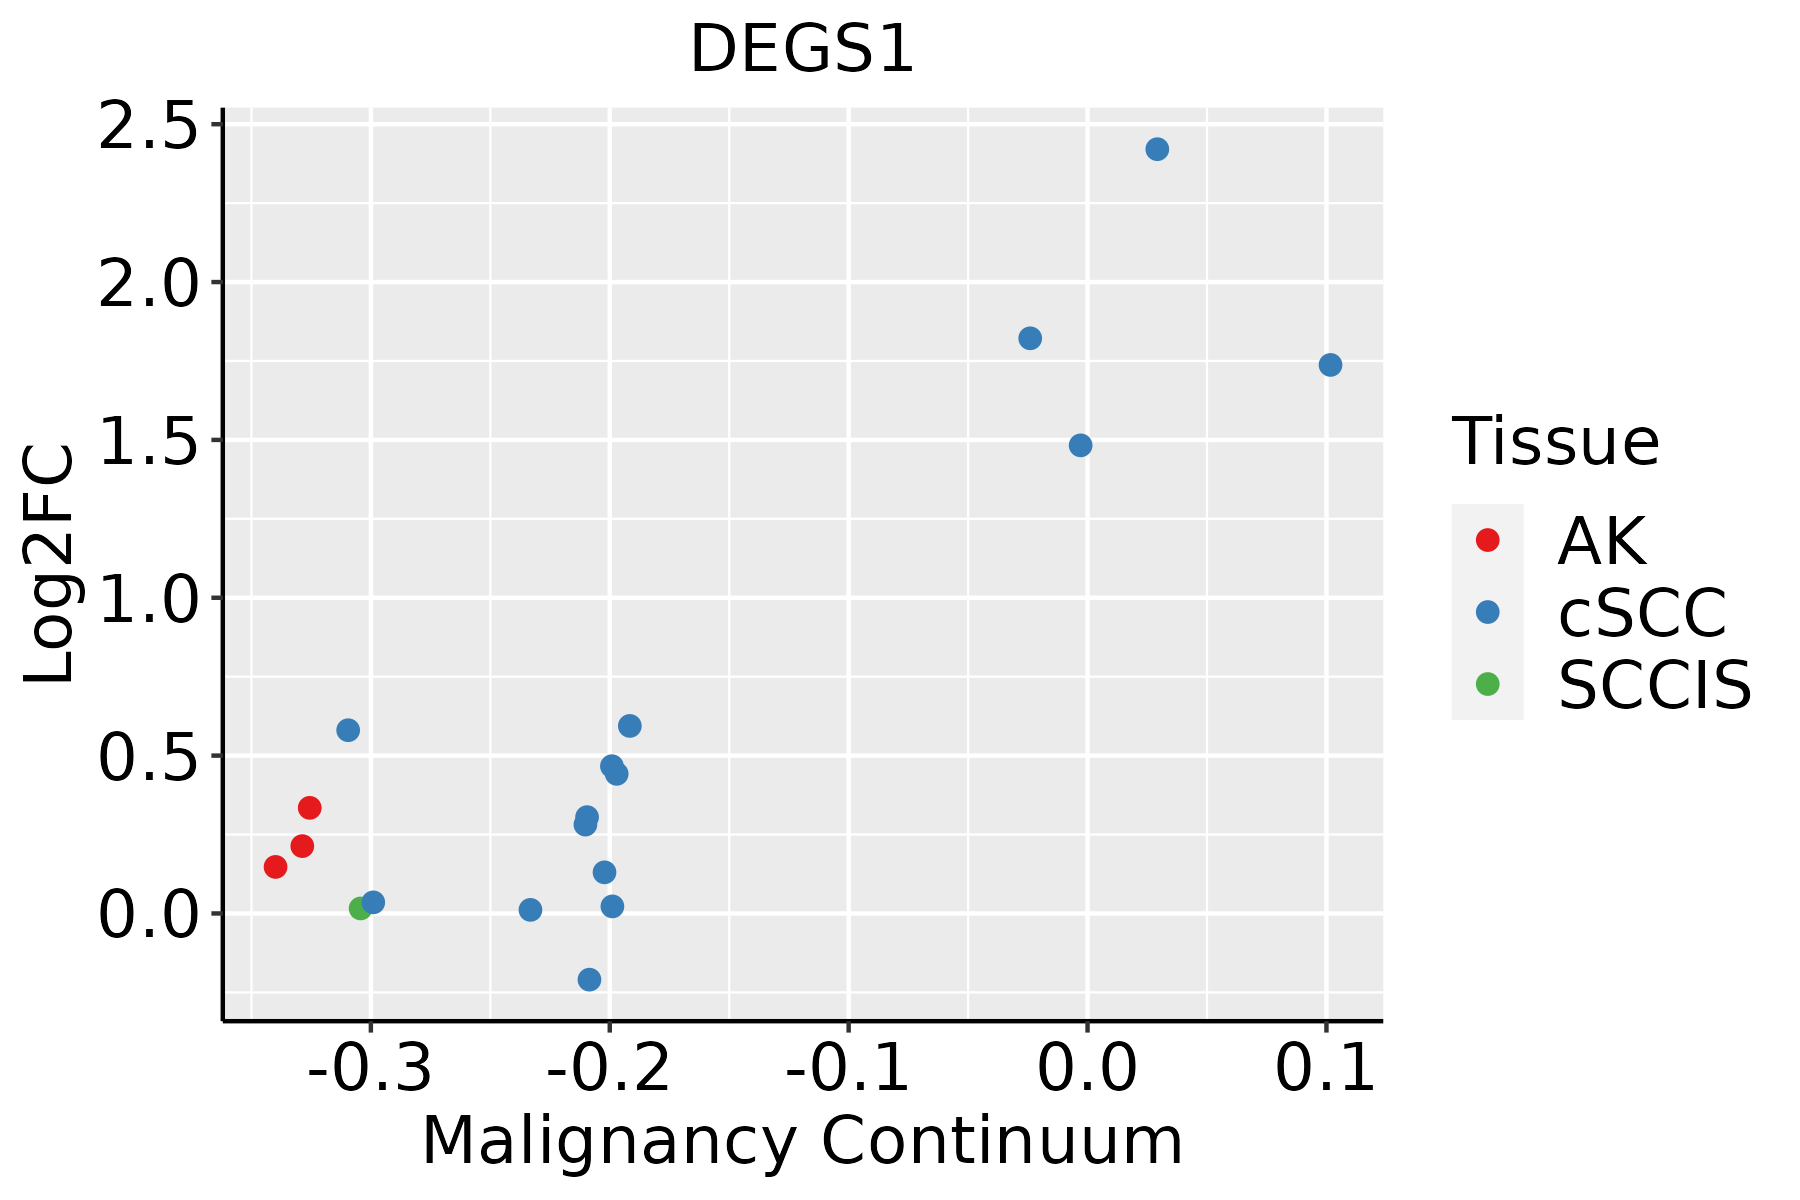 | AK: Actinic keratosis |
| cSCC: Cutaneous squamous cell carcinoma | ||
| SCCIS:squamous cell carcinoma in situ | ||
| Thyroid | 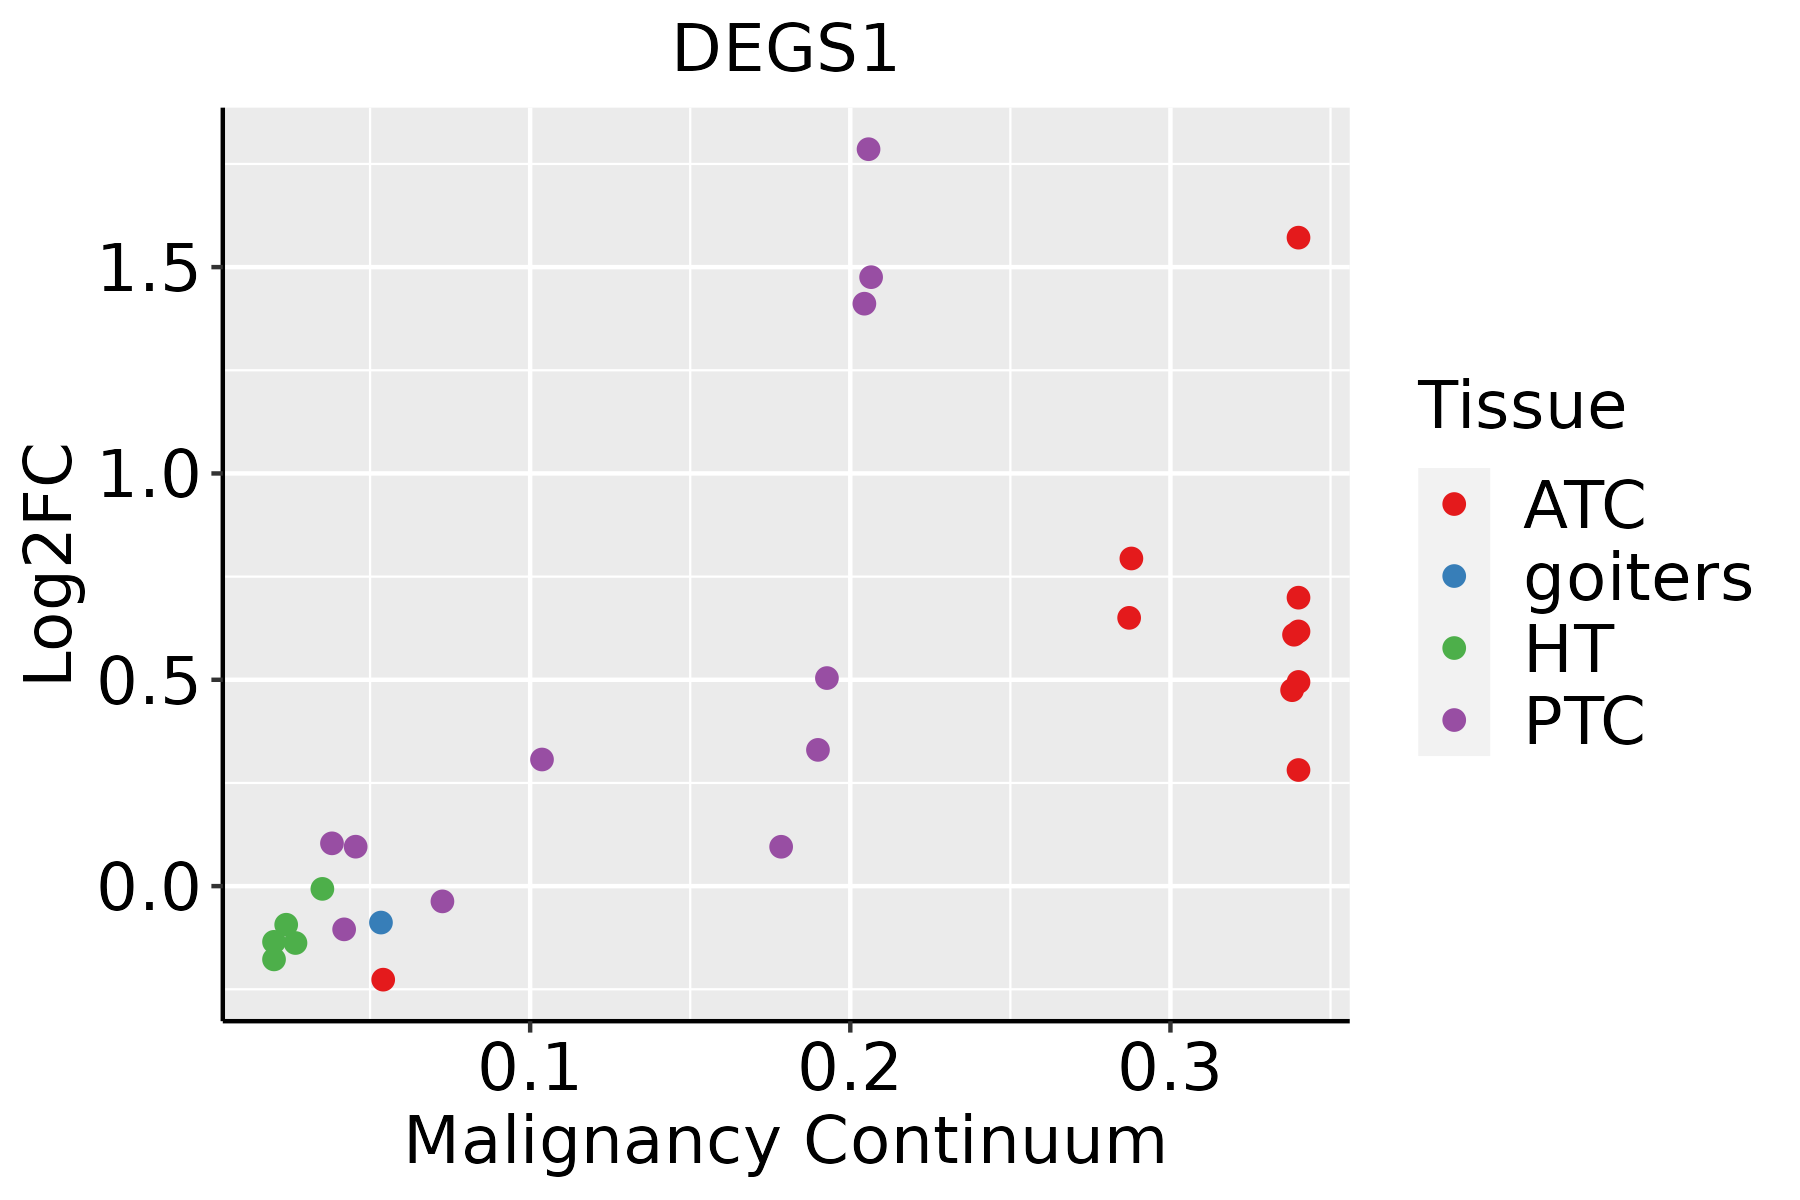 | ATC: Anaplastic thyroid cancer |
| HT: Hashimoto's thyroiditis | ||
| PTC: Papillary thyroid cancer |
| ∗log2FC in expression of this searched gene in stem-like cells from each diseased tissue sample relative to stem-like cells in normal samples in each tissue plotted against the malignancy continuum. Samples are colored based on if they are from different disease stage. |
Top |
Malignant transformation related pathway analysis |
| Find out the enriched GO biological processes and KEGG pathways involved in transition from healthy to precancer to cancer |
| Tissue | Disease Stage | Enriched GO biological Processes |
| Colorectum | AD |  |
| Colorectum | SER |  |
| Colorectum | MSS |  |
| Colorectum | MSI-H |  |
| Colorectum | FAP |  |
| ∗Top 15 enriched GO BP terms are showed in the bar plot of each disease state in each tissue. Each row represents a significant GO biological process which is colored according to the -log10(p.adjust). |
| Page: 1 2 3 4 5 6 7 8 9 |
| GO ID | Tissue | Disease Stage | Description | Gene Ratio | Bg Ratio | pvalue | p.adjust | Count |
| GO:0006091110 | Esophagus | ESCC | generation of precursor metabolites and energy | 331/8552 | 490/18723 | 3.86e-23 | 8.45e-21 | 331 |
| GO:0022900110 | Esophagus | ESCC | electron transport chain | 133/8552 | 175/18723 | 2.18e-16 | 1.67e-14 | 133 |
| GO:00066433 | Esophagus | ESCC | membrane lipid metabolic process | 130/8552 | 203/18723 | 9.29e-08 | 1.54e-06 | 130 |
| GO:00464673 | Esophagus | ESCC | membrane lipid biosynthetic process | 91/8552 | 142/18723 | 7.19e-06 | 7.19e-05 | 91 |
| GO:00425524 | Esophagus | ESCC | myelination | 85/8552 | 134/18723 | 2.51e-05 | 2.13e-04 | 85 |
| GO:00072724 | Esophagus | ESCC | ensheathment of neurons | 86/8552 | 136/18723 | 2.68e-05 | 2.24e-04 | 86 |
| GO:00083664 | Esophagus | ESCC | axon ensheathment | 86/8552 | 136/18723 | 2.68e-05 | 2.24e-04 | 86 |
| GO:00066652 | Esophagus | ESCC | sphingolipid metabolic process | 96/8552 | 155/18723 | 3.21e-05 | 2.66e-04 | 96 |
| GO:00066318 | Esophagus | ESCC | fatty acid metabolic process | 217/8552 | 390/18723 | 4.21e-05 | 3.39e-04 | 217 |
| GO:00463948 | Esophagus | ESCC | carboxylic acid biosynthetic process | 175/8552 | 314/18723 | 1.98e-04 | 1.26e-03 | 175 |
| GO:00160538 | Esophagus | ESCC | organic acid biosynthetic process | 175/8552 | 316/18723 | 3.04e-04 | 1.82e-03 | 175 |
| GO:00301481 | Esophagus | ESCC | sphingolipid biosynthetic process | 62/8552 | 103/18723 | 2.10e-03 | 9.38e-03 | 62 |
| GO:00066721 | Esophagus | ESCC | ceramide metabolic process | 61/8552 | 102/18723 | 2.82e-03 | 1.19e-02 | 61 |
| GO:0046513 | Esophagus | ESCC | ceramide biosynthetic process | 40/8552 | 65/18723 | 7.25e-03 | 2.63e-02 | 40 |
| GO:000609122 | Liver | HCC | generation of precursor metabolites and energy | 340/7958 | 490/18723 | 4.04e-34 | 2.85e-31 | 340 |
| GO:002290022 | Liver | HCC | electron transport chain | 134/7958 | 175/18723 | 3.32e-20 | 4.68e-18 | 134 |
| GO:001605321 | Liver | HCC | organic acid biosynthetic process | 200/7958 | 316/18723 | 5.24e-14 | 3.22e-12 | 200 |
| GO:000663122 | Liver | HCC | fatty acid metabolic process | 238/7958 | 390/18723 | 8.24e-14 | 4.84e-12 | 238 |
| GO:004639421 | Liver | HCC | carboxylic acid biosynthetic process | 198/7958 | 314/18723 | 1.19e-13 | 6.78e-12 | 198 |
| GO:007233021 | Liver | HCC | monocarboxylic acid biosynthetic process | 129/7958 | 214/18723 | 1.08e-07 | 2.09e-06 | 129 |
| Page: 1 2 3 4 |
| Pathway ID | Tissue | Disease Stage | Description | Gene Ratio | Bg Ratio | pvalue | p.adjust | qvalue | Count |
| hsa0407116 | Esophagus | ESCC | Sphingolipid signaling pathway | 85/4205 | 121/8465 | 3.04e-06 | 1.73e-05 | 8.84e-06 | 85 |
| hsa006003 | Esophagus | ESCC | Sphingolipid metabolism | 36/4205 | 53/8465 | 5.41e-03 | 1.36e-02 | 6.99e-03 | 36 |
| hsa0407117 | Esophagus | ESCC | Sphingolipid signaling pathway | 85/4205 | 121/8465 | 3.04e-06 | 1.73e-05 | 8.84e-06 | 85 |
| hsa0060012 | Esophagus | ESCC | Sphingolipid metabolism | 36/4205 | 53/8465 | 5.41e-03 | 1.36e-02 | 6.99e-03 | 36 |
| hsa040718 | Liver | HCC | Sphingolipid signaling pathway | 72/4020 | 121/8465 | 5.01e-03 | 1.47e-02 | 8.18e-03 | 72 |
| hsa00600 | Liver | HCC | Sphingolipid metabolism | 34/4020 | 53/8465 | 1.06e-02 | 2.71e-02 | 1.51e-02 | 34 |
| hsa0407111 | Liver | HCC | Sphingolipid signaling pathway | 72/4020 | 121/8465 | 5.01e-03 | 1.47e-02 | 8.18e-03 | 72 |
| hsa006001 | Liver | HCC | Sphingolipid metabolism | 34/4020 | 53/8465 | 1.06e-02 | 2.71e-02 | 1.51e-02 | 34 |
| hsa0407114 | Oral cavity | OSCC | Sphingolipid signaling pathway | 82/3704 | 121/8465 | 6.97e-08 | 5.08e-07 | 2.58e-07 | 82 |
| hsa006002 | Oral cavity | OSCC | Sphingolipid metabolism | 33/3704 | 53/8465 | 5.00e-03 | 1.20e-02 | 6.13e-03 | 33 |
| hsa0407115 | Oral cavity | OSCC | Sphingolipid signaling pathway | 82/3704 | 121/8465 | 6.97e-08 | 5.08e-07 | 2.58e-07 | 82 |
| hsa0060011 | Oral cavity | OSCC | Sphingolipid metabolism | 33/3704 | 53/8465 | 5.00e-03 | 1.20e-02 | 6.13e-03 | 33 |
| hsa0407122 | Oral cavity | LP | Sphingolipid signaling pathway | 48/2418 | 121/8465 | 5.30e-03 | 2.15e-02 | 1.39e-02 | 48 |
| hsa0407132 | Oral cavity | LP | Sphingolipid signaling pathway | 48/2418 | 121/8465 | 5.30e-03 | 2.15e-02 | 1.39e-02 | 48 |
| Page: 1 |
Top |
Cell-cell communication analysis |
| Identification of potential cell-cell interactions between two cell types and their ligand-receptor pairs for different disease states |
| Ligand | Receptor | LRpair | Pathway | Tissue | Disease Stage |
| Page: 1 |
Top |
Single-cell gene regulatory network inference analysis |
| Find out the significant the regulons (TFs) and the target genes of each regulon across cell types for different disease states |
| TF | Cell Type | Tissue | Disease Stage | Target Gene | RSS | Regulon Activity |
| ∗The dot plots of a searched regulon are shown for all cell subpopulations in each disease state of each tissue based on the regulon specific score inferred using pySCENIC and by calculating the average expression. |
| Page: 1 |
Top |
Somatic mutation of malignant transformation related genes |
| Annotation of somatic variants for genes involved in malignant transformation |
| Hugo Symbol | Variant Class | Variant Classification | dbSNP RS | HGVSc | HGVSp | HGVSp Short | SWISSPROT | BIOTYPE | SIFT | PolyPhen | Tumor Sample Barcode | Tissue | Histology | Sex | Age | Stage | Therapy Types | Drugs | Outcome |
| DEGS1 | SNV | Missense_Mutation | novel | c.155N>A | p.Leu52His | p.L52H | O15121 | protein_coding | deleterious(0.01) | possibly_damaging(0.708) | TCGA-CG-4460-01 | Stomach | stomach adenocarcinoma | Female | >=65 | III/IV | Chemotherapy | capecitabine | PD |
| DEGS1 | SNV | Missense_Mutation | novel | c.769N>T | p.Gly257Cys | p.G257C | O15121 | protein_coding | deleterious(0) | probably_damaging(1) | TCGA-FY-A3YR-01 | Thyroid | thyroid carcinoma | Female | <65 | III/IV | Hormone Therapy | synthroid | SD |
| DEGS1 | insertion | Frame_Shift_Ins | rs771660755 | c.916_917insACAC | p.Ile306AsnfsTer35 | p.I306Nfs*35 | O15121 | protein_coding | TCGA-E8-A436-01 | Thyroid | thyroid carcinoma | Female | <65 | I/II | Unknown | Unknown | SD | ||
| DEGS1 | insertion | In_Frame_Ins | novel | c.917_918insGAG | p.Ile306delinsMetArg | p.I306delinsMR | O15121 | protein_coding | TCGA-E8-A436-01 | Thyroid | thyroid carcinoma | Female | <65 | I/II | Unknown | Unknown | SD |
| Page: 1 2 3 4 5 |
Top |
Related drugs of malignant transformation related genes |
| Identification of chemicals and drugs interact with genes involved in malignant transfromation |
| (DGIdb 4.0) |
| Entrez ID | Symbol | Category | Interaction Types | Drug Claim Name | Drug Name | PMIDs |
| 8560 | DEGS1 | ENZYME | inhibitor | 252827536 | ||
| 8560 | DEGS1 | ENZYME | inhibitor | 178102663 |
| Page: 1 |

Copyright 2023-Present -The University of Texas Health Science Center at Houston |