
|
|||||
|
 | |
| |
| |
| |
| |
| |
|
Gene: ATL2 |
Gene summary for ATL2 |
| Gene information | Species | Human | Gene symbol | ATL2 | Gene ID | 64225 |
| Gene name | atlastin GTPase 2 | |
| Gene Alias | ARL3IP2 | |
| Cytomap | 2p22.2-p22.1 | |
| Gene Type | protein-coding | GO ID | GO:0006996 | UniProtAcc | Q8NHH9 |
Top |
Malignant transformation analysis |
| Identification of the aberrant gene expression in precancerous and cancerous lesions by comparing the gene expression of stem-like cells in diseased tissues with normal stem cells |
| Entrez ID | Symbol | Replicates | Species | Organ | Tissue | Adj P-value | Log2FC | Malignancy |
| 64225 | ATL2 | CCI_2 | Human | Cervix | CC | 4.95e-07 | 8.04e-01 | 0.5249 |
| 64225 | ATL2 | CCI_3 | Human | Cervix | CC | 6.04e-08 | 6.12e-01 | 0.516 |
| 64225 | ATL2 | HTA11_3410_2000001011 | Human | Colorectum | AD | 1.31e-29 | 8.93e-01 | 0.0155 |
| 64225 | ATL2 | HTA11_2487_2000001011 | Human | Colorectum | SER | 7.30e-04 | 4.39e-01 | -0.1808 |
| 64225 | ATL2 | HTA11_2951_2000001011 | Human | Colorectum | AD | 4.18e-03 | 5.85e-01 | 0.0216 |
| 64225 | ATL2 | HTA11_1938_2000001011 | Human | Colorectum | AD | 1.07e-22 | 1.09e+00 | -0.0811 |
| 64225 | ATL2 | HTA11_347_2000001011 | Human | Colorectum | AD | 5.74e-31 | 9.20e-01 | -0.1954 |
| 64225 | ATL2 | HTA11_411_2000001011 | Human | Colorectum | SER | 1.83e-08 | 1.13e+00 | -0.2602 |
| 64225 | ATL2 | HTA11_3361_2000001011 | Human | Colorectum | AD | 9.76e-09 | 7.20e-01 | -0.1207 |
| 64225 | ATL2 | HTA11_83_2000001011 | Human | Colorectum | SER | 1.20e-04 | 6.57e-01 | -0.1526 |
| 64225 | ATL2 | HTA11_696_2000001011 | Human | Colorectum | AD | 8.41e-26 | 1.17e+00 | -0.1464 |
| 64225 | ATL2 | HTA11_866_2000001011 | Human | Colorectum | AD | 9.65e-04 | 3.39e-01 | -0.1001 |
| 64225 | ATL2 | HTA11_1391_2000001011 | Human | Colorectum | AD | 1.59e-03 | 4.20e-01 | -0.059 |
| 64225 | ATL2 | HTA11_2992_2000001011 | Human | Colorectum | SER | 1.42e-14 | 1.31e+00 | -0.1706 |
| 64225 | ATL2 | HTA11_5212_2000001011 | Human | Colorectum | AD | 2.73e-11 | 1.04e+00 | -0.2061 |
| 64225 | ATL2 | HTA11_5216_2000001011 | Human | Colorectum | SER | 7.21e-17 | 1.42e+00 | -0.1462 |
| 64225 | ATL2 | HTA11_546_2000001011 | Human | Colorectum | AD | 9.91e-14 | 1.12e+00 | -0.0842 |
| 64225 | ATL2 | HTA11_99999965104_69814 | Human | Colorectum | MSS | 1.20e-12 | 7.95e-01 | 0.281 |
| 64225 | ATL2 | A001-C-207 | Human | Colorectum | FAP | 6.78e-04 | -2.97e-01 | 0.1278 |
| 64225 | ATL2 | A015-C-203 | Human | Colorectum | FAP | 1.67e-19 | -2.91e-01 | -0.1294 |
| Page: 1 2 3 4 5 6 7 8 9 |
| Tissue | Expression Dynamics | Abbreviation |
| Cervix |  | CC: Cervix cancer |
| HSIL_HPV: HPV-infected high-grade squamous intraepithelial lesions | ||
| N_HPV: HPV-infected normal cervix | ||
| Colorectum (GSE201348) | 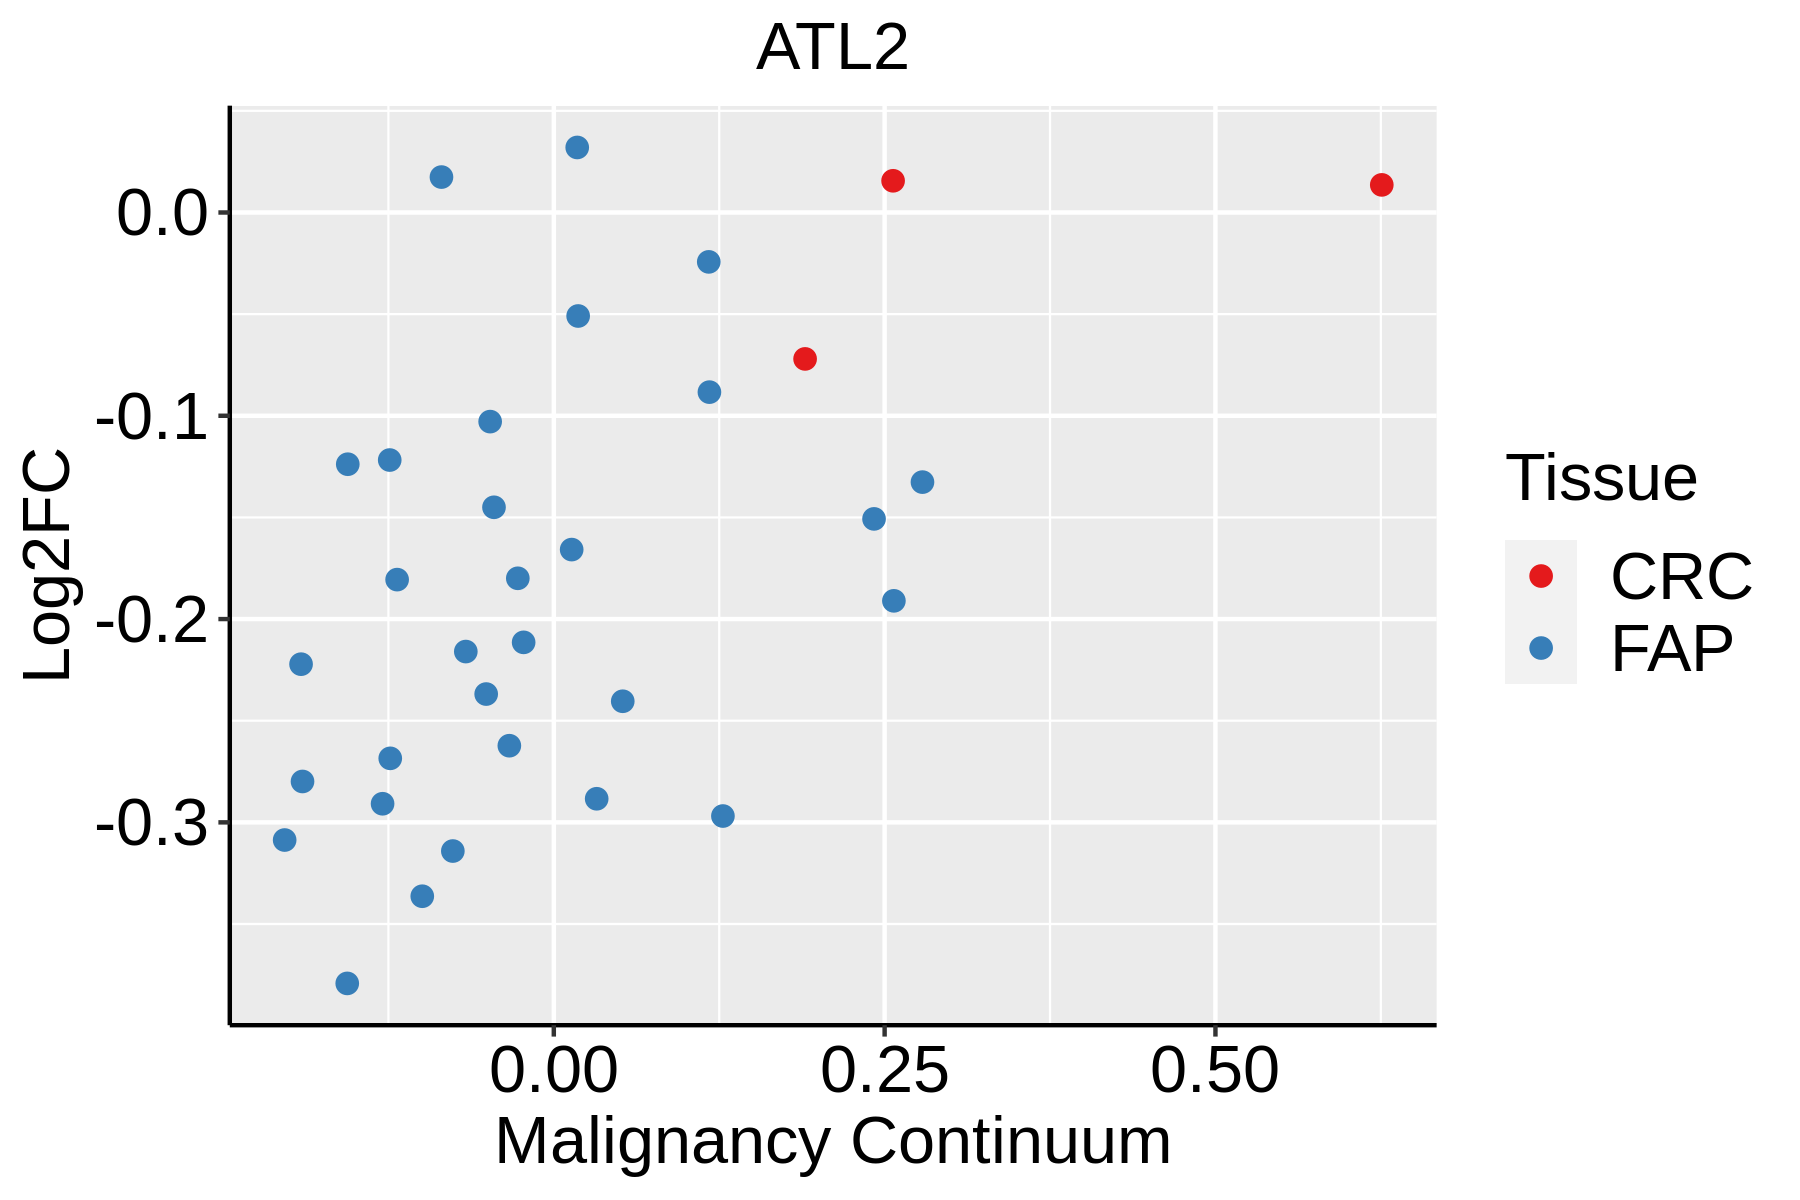 | FAP: Familial adenomatous polyposis |
| CRC: Colorectal cancer | ||
| Colorectum (HTA11) |  | AD: Adenomas |
| SER: Sessile serrated lesions | ||
| MSI-H: Microsatellite-high colorectal cancer | ||
| MSS: Microsatellite stable colorectal cancer | ||
| Endometrium | 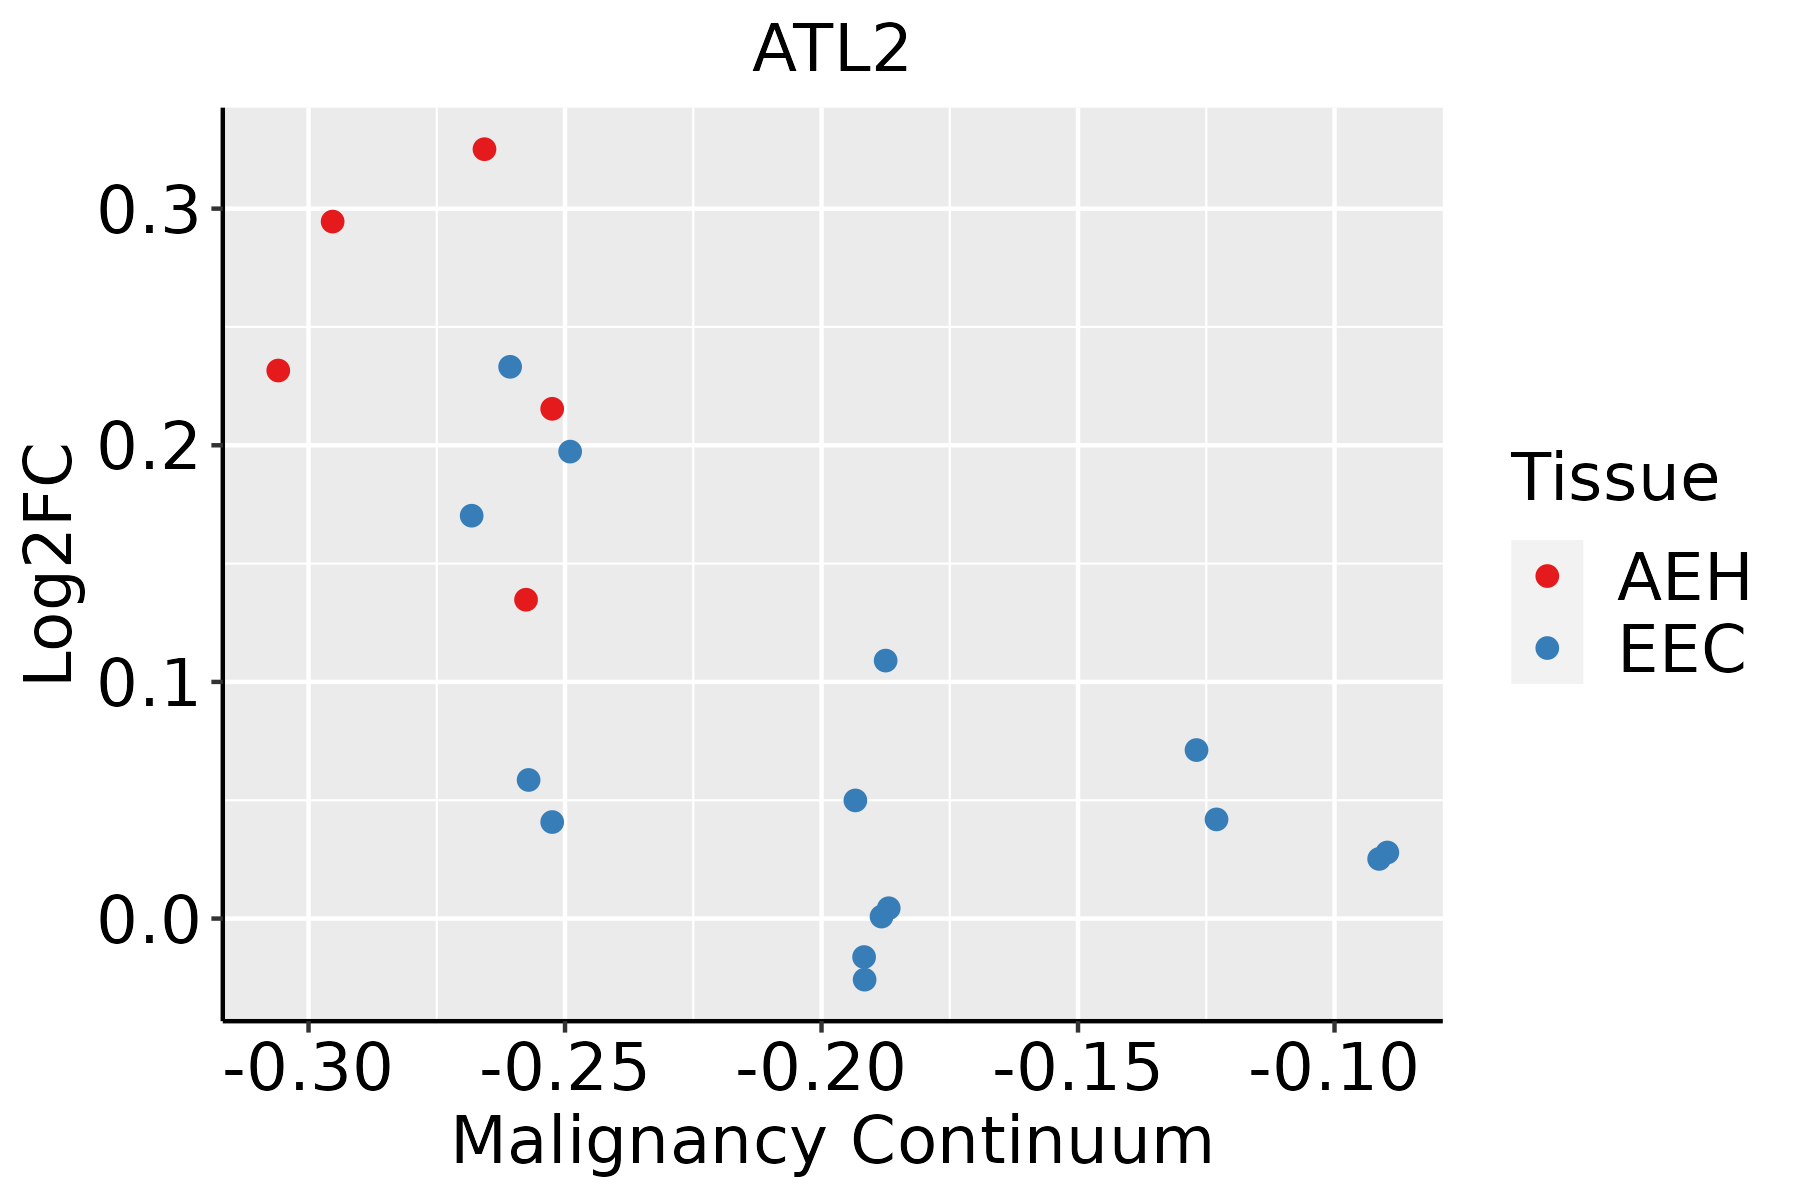 | AEH: Atypical endometrial hyperplasia |
| EEC: Endometrioid Cancer | ||
| Esophagus | 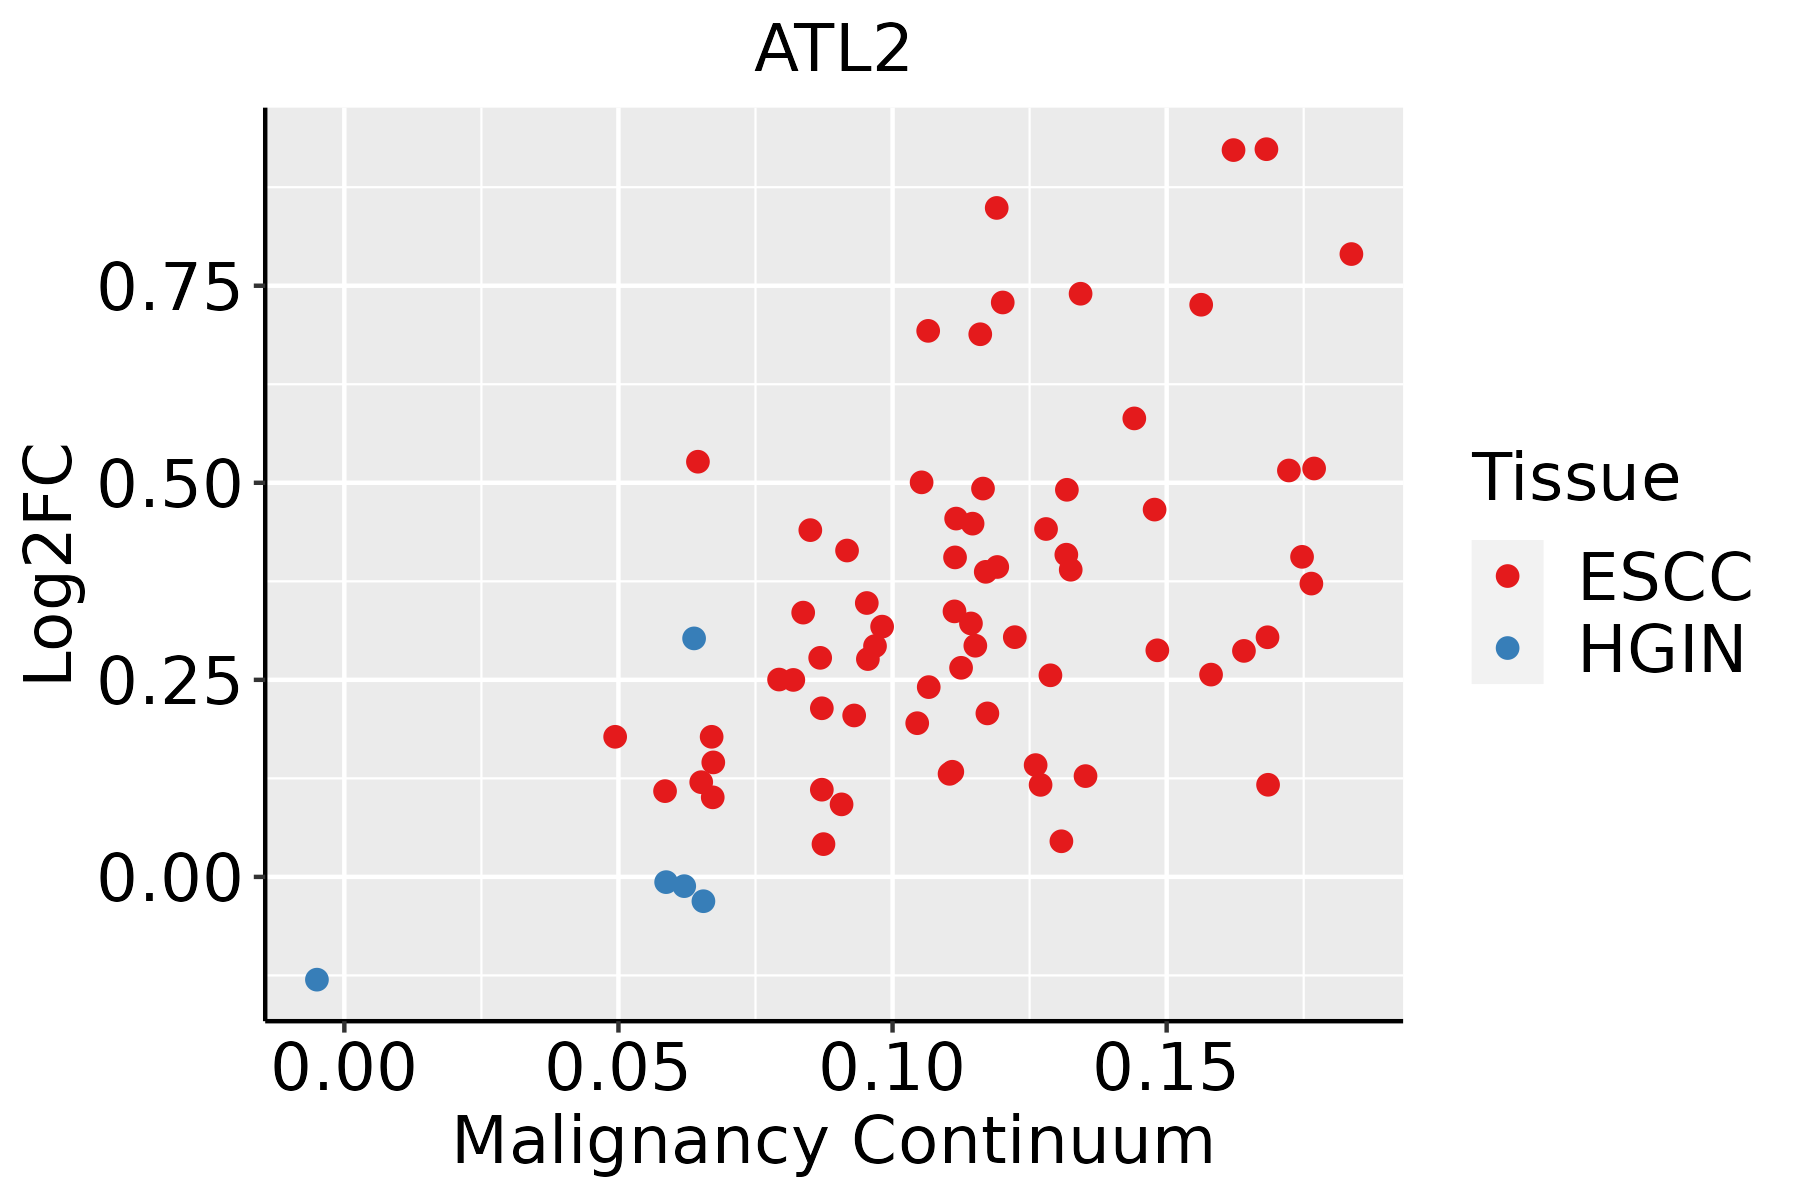 | ESCC: Esophageal squamous cell carcinoma |
| HGIN: High-grade intraepithelial neoplasias | ||
| LGIN: Low-grade intraepithelial neoplasias | ||
| Liver |  | HCC: Hepatocellular carcinoma |
| NAFLD: Non-alcoholic fatty liver disease | ||
| Lung | 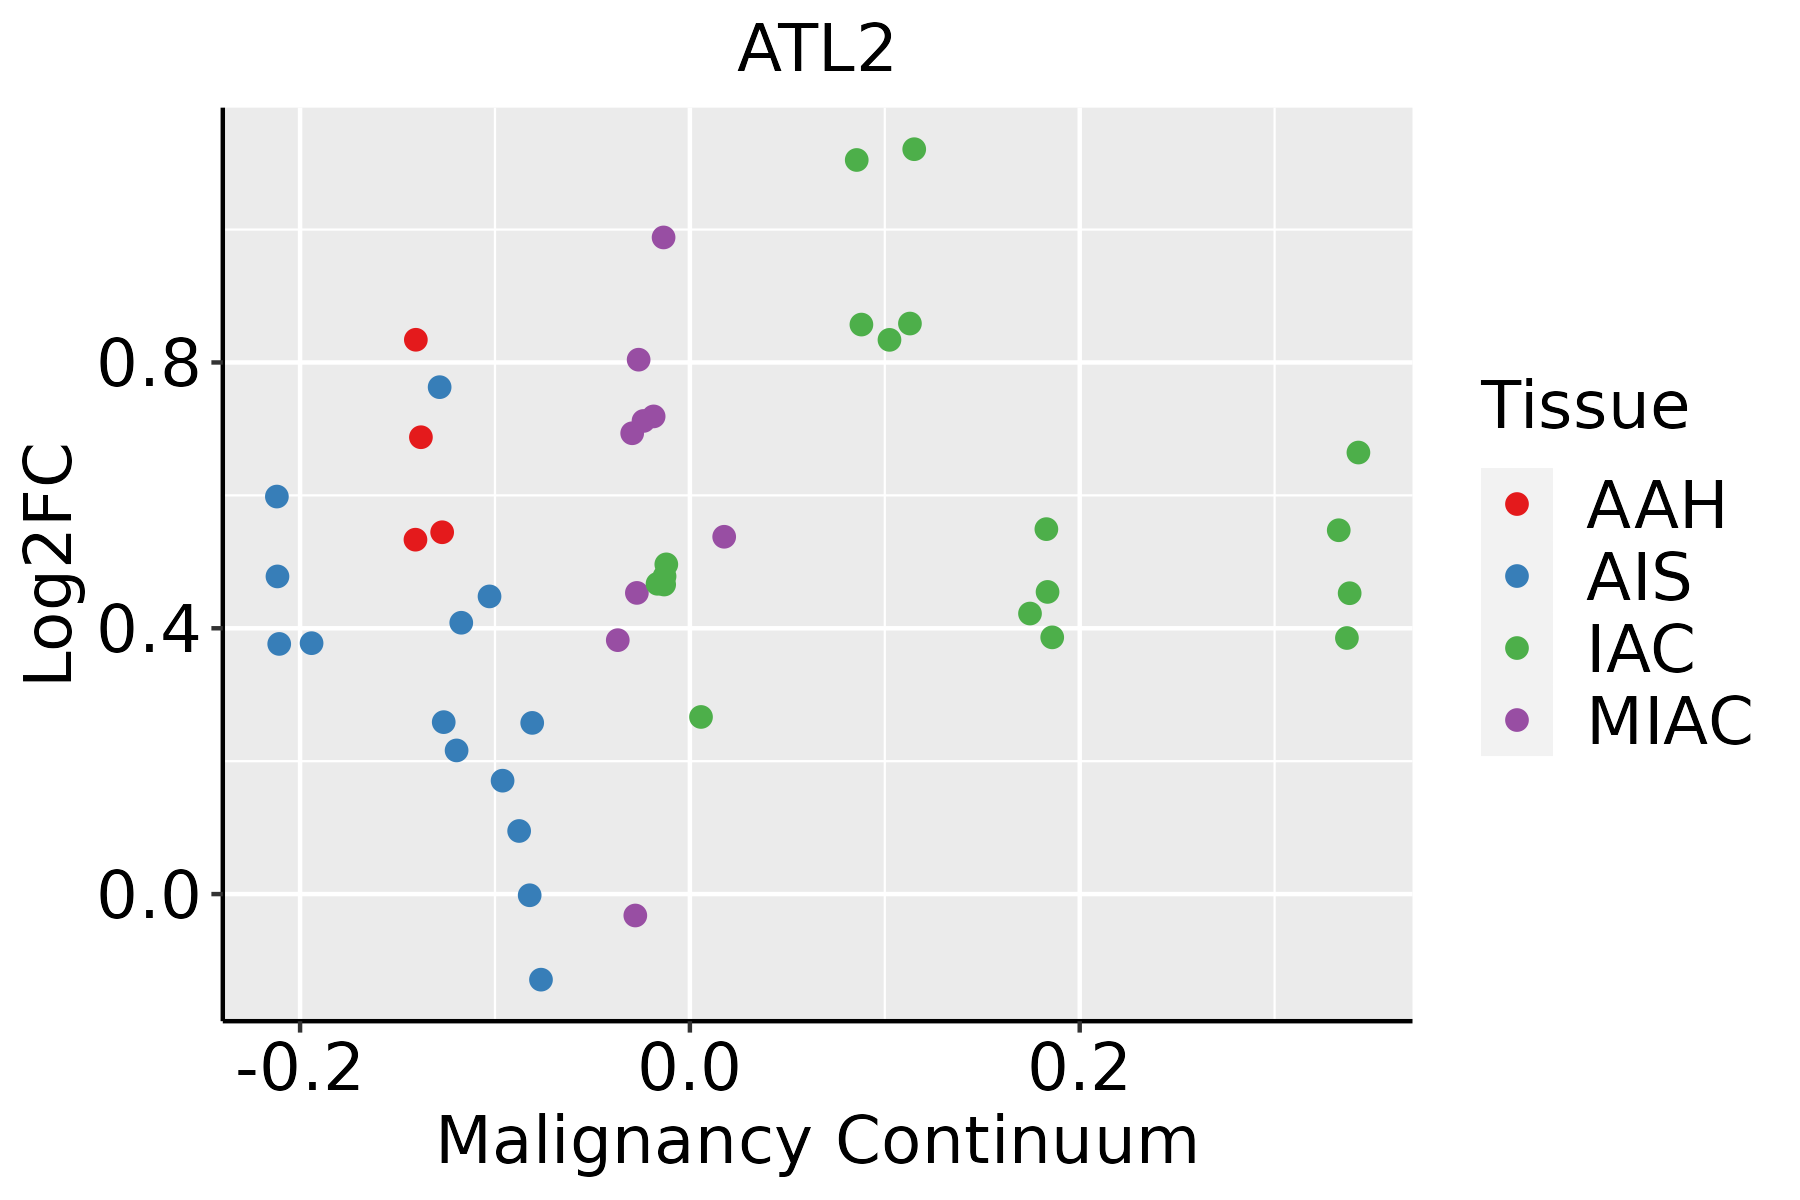 | AAH: Atypical adenomatous hyperplasia |
| AIS: Adenocarcinoma in situ | ||
| IAC: Invasive lung adenocarcinoma | ||
| MIA: Minimally invasive adenocarcinoma | ||
| Oral Cavity | 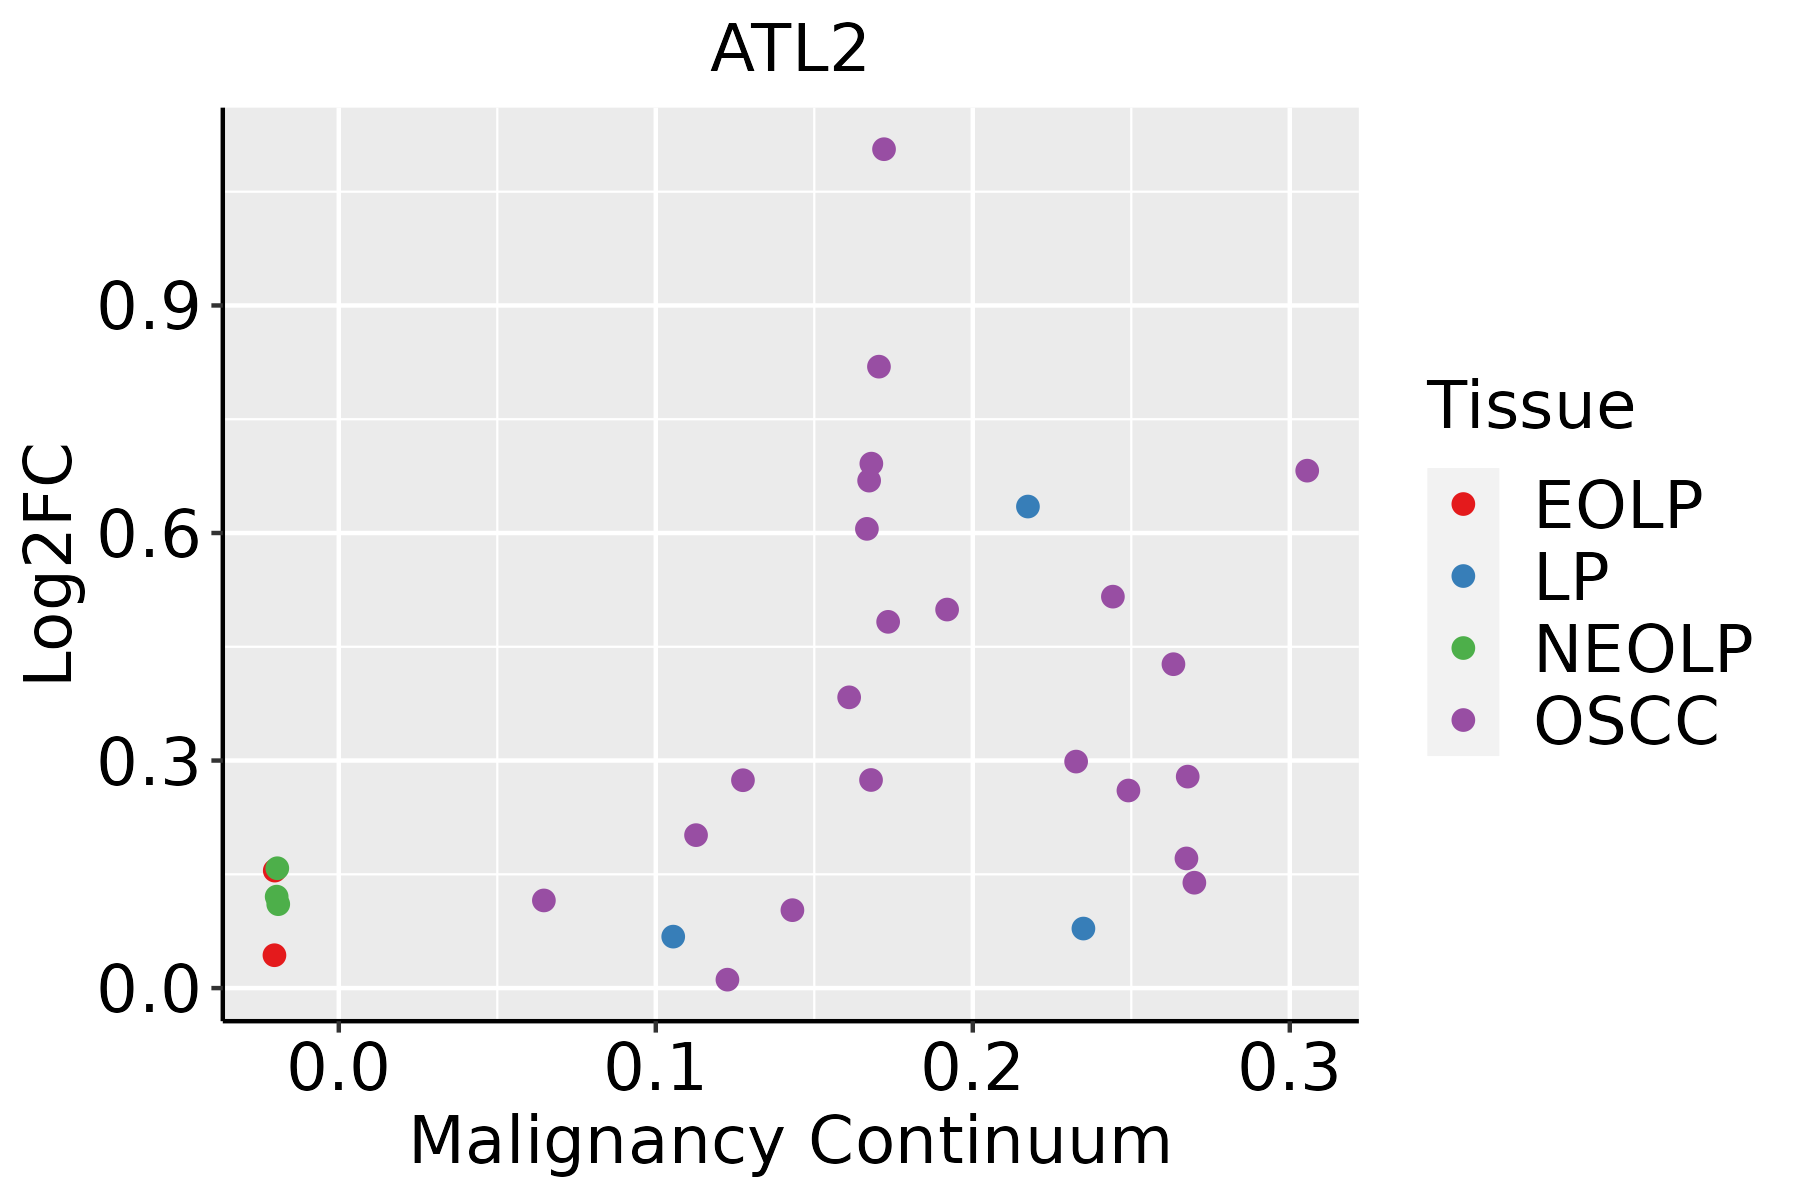 | EOLP: Erosive Oral lichen planus |
| LP: leukoplakia | ||
| NEOLP: Non-erosive oral lichen planus | ||
| OSCC: Oral squamous cell carcinoma | ||
| Skin |  | AK: Actinic keratosis |
| cSCC: Cutaneous squamous cell carcinoma | ||
| SCCIS:squamous cell carcinoma in situ | ||
| Thyroid |  | ATC: Anaplastic thyroid cancer |
| HT: Hashimoto's thyroiditis | ||
| PTC: Papillary thyroid cancer |
| ∗log2FC in expression of this searched gene in stem-like cells from each diseased tissue sample relative to stem-like cells in normal samples in each tissue plotted against the malignancy continuum. Samples are colored based on if they are from different disease stage. |
Top |
Malignant transformation related pathway analysis |
| Find out the enriched GO biological processes and KEGG pathways involved in transition from healthy to precancer to cancer |
| Tissue | Disease Stage | Enriched GO biological Processes |
| Colorectum | AD |  |
| Colorectum | SER |  |
| Colorectum | MSS |  |
| Colorectum | MSI-H |  |
| Colorectum | FAP |  |
| ∗Top 15 enriched GO BP terms are showed in the bar plot of each disease state in each tissue. Each row represents a significant GO biological process which is colored according to the -log10(p.adjust). |
| Page: 1 2 3 4 5 6 7 8 9 |
| GO ID | Tissue | Disease Stage | Description | Gene Ratio | Bg Ratio | pvalue | p.adjust | Count |
| GO:00070304 | Cervix | CC | Golgi organization | 32/2311 | 157/18723 | 2.78e-03 | 1.87e-02 | 32 |
| GO:0007029 | Colorectum | AD | endoplasmic reticulum organization | 31/3918 | 87/18723 | 1.08e-03 | 1.00e-02 | 31 |
| GO:0071786 | Colorectum | AD | endoplasmic reticulum tubular network organization | 9/3918 | 18/18723 | 5.82e-03 | 3.67e-02 | 9 |
| GO:00070291 | Colorectum | SER | endoplasmic reticulum organization | 23/2897 | 87/18723 | 5.77e-03 | 4.23e-02 | 23 |
| GO:00070305 | Endometrium | AEH | Golgi organization | 32/2100 | 157/18723 | 5.73e-04 | 5.69e-03 | 32 |
| GO:000703012 | Endometrium | EEC | Golgi organization | 32/2168 | 157/18723 | 9.87e-04 | 8.76e-03 | 32 |
| GO:00070295 | Esophagus | HGIN | endoplasmic reticulum organization | 22/2587 | 87/18723 | 3.07e-03 | 2.90e-02 | 22 |
| GO:000702914 | Esophagus | ESCC | endoplasmic reticulum organization | 65/8552 | 87/18723 | 3.28e-08 | 6.08e-07 | 65 |
| GO:00070308 | Esophagus | ESCC | Golgi organization | 101/8552 | 157/18723 | 1.78e-06 | 2.10e-05 | 101 |
| GO:00717865 | Esophagus | ESCC | endoplasmic reticulum tubular network organization | 15/8552 | 18/18723 | 1.20e-03 | 5.88e-03 | 15 |
| GO:00512592 | Esophagus | ESCC | protein complex oligomerization | 130/8552 | 238/18723 | 3.29e-03 | 1.36e-02 | 130 |
| GO:0007030 | Liver | NAFLD | Golgi organization | 36/1882 | 157/18723 | 1.76e-06 | 7.68e-05 | 36 |
| GO:00717863 | Liver | NAFLD | endoplasmic reticulum tubular network organization | 6/1882 | 18/18723 | 6.55e-03 | 4.69e-02 | 6 |
| GO:00070301 | Liver | Cirrhotic | Golgi organization | 68/4634 | 157/18723 | 2.57e-07 | 6.41e-06 | 68 |
| GO:00070292 | Liver | Cirrhotic | endoplasmic reticulum organization | 42/4634 | 87/18723 | 1.67e-06 | 3.22e-05 | 42 |
| GO:00717861 | Liver | Cirrhotic | endoplasmic reticulum tubular network organization | 11/4634 | 18/18723 | 1.13e-03 | 7.73e-03 | 11 |
| GO:000702911 | Liver | HCC | endoplasmic reticulum organization | 64/7958 | 87/18723 | 3.92e-09 | 1.04e-07 | 64 |
| GO:00070302 | Liver | HCC | Golgi organization | 99/7958 | 157/18723 | 1.54e-07 | 2.85e-06 | 99 |
| GO:00717862 | Liver | HCC | endoplasmic reticulum tubular network organization | 15/7958 | 18/18723 | 4.74e-04 | 3.12e-03 | 15 |
| GO:0090158 | Liver | HCC | endoplasmic reticulum membrane organization | 10/7958 | 13/18723 | 1.28e-02 | 4.61e-02 | 10 |
| Page: 1 2 3 |
| Pathway ID | Tissue | Disease Stage | Description | Gene Ratio | Bg Ratio | pvalue | p.adjust | qvalue | Count |
| Page: 1 |
Top |
Cell-cell communication analysis |
| Identification of potential cell-cell interactions between two cell types and their ligand-receptor pairs for different disease states |
| Ligand | Receptor | LRpair | Pathway | Tissue | Disease Stage |
| Page: 1 |
Top |
Single-cell gene regulatory network inference analysis |
| Find out the significant the regulons (TFs) and the target genes of each regulon across cell types for different disease states |
| TF | Cell Type | Tissue | Disease Stage | Target Gene | RSS | Regulon Activity |
| ∗The dot plots of a searched regulon are shown for all cell subpopulations in each disease state of each tissue based on the regulon specific score inferred using pySCENIC and by calculating the average expression. |
| Page: 1 |
Top |
Somatic mutation of malignant transformation related genes |
| Annotation of somatic variants for genes involved in malignant transformation |
| Hugo Symbol | Variant Class | Variant Classification | dbSNP RS | HGVSc | HGVSp | HGVSp Short | SWISSPROT | BIOTYPE | SIFT | PolyPhen | Tumor Sample Barcode | Tissue | Histology | Sex | Age | Stage | Therapy Types | Drugs | Outcome |
| ATL2 | SNV | Missense_Mutation | novel | c.635A>G | p.Asp212Gly | p.D212G | Q8NHH9 | protein_coding | deleterious(0) | probably_damaging(0.964) | TCGA-56-7580-01 | Lung | lung squamous cell carcinoma | Male | >=65 | I/II | Unknown | Unknown | SD |
| ATL2 | SNV | Missense_Mutation | novel | c.1592N>T | p.Gly531Val | p.G531V | Q8NHH9 | protein_coding | deleterious(0.02) | probably_damaging(0.947) | TCGA-56-8624-01 | Lung | lung squamous cell carcinoma | Male | >=65 | I/II | Chemotherapy | carboplatin | CR |
| ATL2 | SNV | Missense_Mutation | novel | c.524N>G | p.Gln175Arg | p.Q175R | Q8NHH9 | protein_coding | deleterious(0.03) | probably_damaging(1) | TCGA-60-2706-01 | Lung | lung squamous cell carcinoma | Male | <65 | I/II | Unknown | Unknown | SD |
| ATL2 | SNV | Missense_Mutation | c.311G>A | p.Arg104His | p.R104H | Q8NHH9 | protein_coding | deleterious(0) | probably_damaging(1) | TCGA-94-8490-01 | Lung | lung squamous cell carcinoma | Male | >=65 | I/II | Unknown | Unknown | SD | |
| ATL2 | deletion | Frame_Shift_Del | novel | c.1565_1577delNNNNNNNNNNNNN | p.Lys522SerfsTer8 | p.K522Sfs*8 | Q8NHH9 | protein_coding | TCGA-NJ-A55R-01 | Lung | lung adenocarcinoma | Male | >=65 | I/II | Unknown | Unknown | SD | ||
| ATL2 | SNV | Missense_Mutation | novel | c.823N>A | p.Glu275Lys | p.E275K | Q8NHH9 | protein_coding | tolerated(0.19) | benign(0.039) | TCGA-CR-6484-01 | Oral cavity | head & neck squamous cell carcinoma | Female | >=65 | I/II | Chemotherapy | carboplatin | SD |
| ATL2 | SNV | Missense_Mutation | c.424N>A | p.Gly142Ser | p.G142S | Q8NHH9 | protein_coding | deleterious(0) | probably_damaging(0.998) | TCGA-EJ-7321-01 | Prostate | prostate adenocarcinoma | Male | <65 | 6 | Unknown | Unknown | SD | |
| ATL2 | SNV | Missense_Mutation | novel | c.1487N>A | p.Gly496Asp | p.G496D | Q8NHH9 | protein_coding | deleterious(0) | probably_damaging(0.932) | TCGA-XK-AAIW-01 | Prostate | prostate adenocarcinoma | Male | >=65 | 9 | Unknown | Unknown | PD |
| ATL2 | SNV | Missense_Mutation | c.1549A>G | p.Thr517Ala | p.T517A | Q8NHH9 | protein_coding | tolerated(0.16) | benign(0.007) | TCGA-BR-8372-01 | Stomach | stomach adenocarcinoma | Male | <65 | III/IV | Chemotherapy | etoposide | CR | |
| ATL2 | SNV | Missense_Mutation | c.1135G>A | p.Ala379Thr | p.A379T | Q8NHH9 | protein_coding | deleterious(0.01) | probably_damaging(0.937) | TCGA-CD-A4MG-01 | Stomach | stomach adenocarcinoma | Male | >=65 | I/II | Unknown | Unknown | PD |
| Page: 1 2 3 4 5 6 |
Top |
Related drugs of malignant transformation related genes |
| Identification of chemicals and drugs interact with genes involved in malignant transfromation |
| (DGIdb 4.0) |
| Entrez ID | Symbol | Category | Interaction Types | Drug Claim Name | Drug Name | PMIDs |
| Page: 1 |

Copyright 2023-Present -The University of Texas Health Science Center at Houston |