
|
|||||
|
 | |
| |
| |
| |
| |
| |
|
Gene: AGPAT3 |
Gene summary for AGPAT3 |
| Gene information | Species | Human | Gene symbol | AGPAT3 | Gene ID | 56894 |
| Gene name | 1-acylglycerol-3-phosphate O-acyltransferase 3 | |
| Gene Alias | 1-AGPAT 3 | |
| Cytomap | 21q22.3 | |
| Gene Type | protein-coding | GO ID | GO:0006629 | UniProtAcc | Q9NRZ7 |
Top |
Malignant transformation analysis |
| Identification of the aberrant gene expression in precancerous and cancerous lesions by comparing the gene expression of stem-like cells in diseased tissues with normal stem cells |
| Entrez ID | Symbol | Replicates | Species | Organ | Tissue | Adj P-value | Log2FC | Malignancy |
| 56894 | AGPAT3 | HTA11_347_2000001011 | Human | Colorectum | AD | 1.16e-06 | 5.10e-01 | -0.1954 |
| 56894 | AGPAT3 | A015-C-203 | Human | Colorectum | FAP | 5.39e-13 | -8.91e-02 | -0.1294 |
| 56894 | AGPAT3 | A015-C-204 | Human | Colorectum | FAP | 3.91e-02 | -7.52e-02 | -0.0228 |
| 56894 | AGPAT3 | A002-C-201 | Human | Colorectum | FAP | 7.55e-06 | -1.03e-01 | 0.0324 |
| 56894 | AGPAT3 | A001-C-119 | Human | Colorectum | FAP | 8.79e-03 | 1.15e-01 | -0.1557 |
| 56894 | AGPAT3 | A001-C-108 | Human | Colorectum | FAP | 1.16e-05 | -7.01e-03 | -0.0272 |
| 56894 | AGPAT3 | A002-C-205 | Human | Colorectum | FAP | 1.29e-14 | -1.46e-01 | -0.1236 |
| 56894 | AGPAT3 | A015-C-006 | Human | Colorectum | FAP | 7.35e-11 | -1.19e-01 | -0.0994 |
| 56894 | AGPAT3 | A015-C-106 | Human | Colorectum | FAP | 6.07e-05 | -3.08e-03 | -0.0511 |
| 56894 | AGPAT3 | A002-C-114 | Human | Colorectum | FAP | 3.01e-10 | -3.58e-02 | -0.1561 |
| 56894 | AGPAT3 | A015-C-104 | Human | Colorectum | FAP | 6.11e-16 | -2.05e-01 | -0.1899 |
| 56894 | AGPAT3 | A001-C-014 | Human | Colorectum | FAP | 1.54e-08 | -1.27e-01 | 0.0135 |
| 56894 | AGPAT3 | A002-C-016 | Human | Colorectum | FAP | 1.27e-10 | -1.37e-01 | 0.0521 |
| 56894 | AGPAT3 | A015-C-002 | Human | Colorectum | FAP | 1.05e-06 | -2.21e-01 | -0.0763 |
| 56894 | AGPAT3 | A001-C-203 | Human | Colorectum | FAP | 6.77e-03 | 3.20e-02 | -0.0481 |
| 56894 | AGPAT3 | A002-C-116 | Human | Colorectum | FAP | 8.53e-17 | -1.03e-01 | -0.0452 |
| 56894 | AGPAT3 | A014-C-008 | Human | Colorectum | FAP | 3.02e-08 | -2.32e-01 | -0.191 |
| 56894 | AGPAT3 | A018-E-020 | Human | Colorectum | FAP | 1.07e-12 | -1.14e-01 | -0.2034 |
| 56894 | AGPAT3 | F034 | Human | Colorectum | FAP | 1.63e-09 | -6.07e-02 | -0.0665 |
| 56894 | AGPAT3 | LZE20T | Human | Esophagus | ESCC | 8.21e-03 | 1.33e-01 | 0.0662 |
| Page: 1 2 3 4 5 6 |
| Tissue | Expression Dynamics | Abbreviation |
| Colorectum (GSE201348) |  | FAP: Familial adenomatous polyposis |
| CRC: Colorectal cancer | ||
| Colorectum (HTA11) |  | AD: Adenomas |
| SER: Sessile serrated lesions | ||
| MSI-H: Microsatellite-high colorectal cancer | ||
| MSS: Microsatellite stable colorectal cancer | ||
| Esophagus | 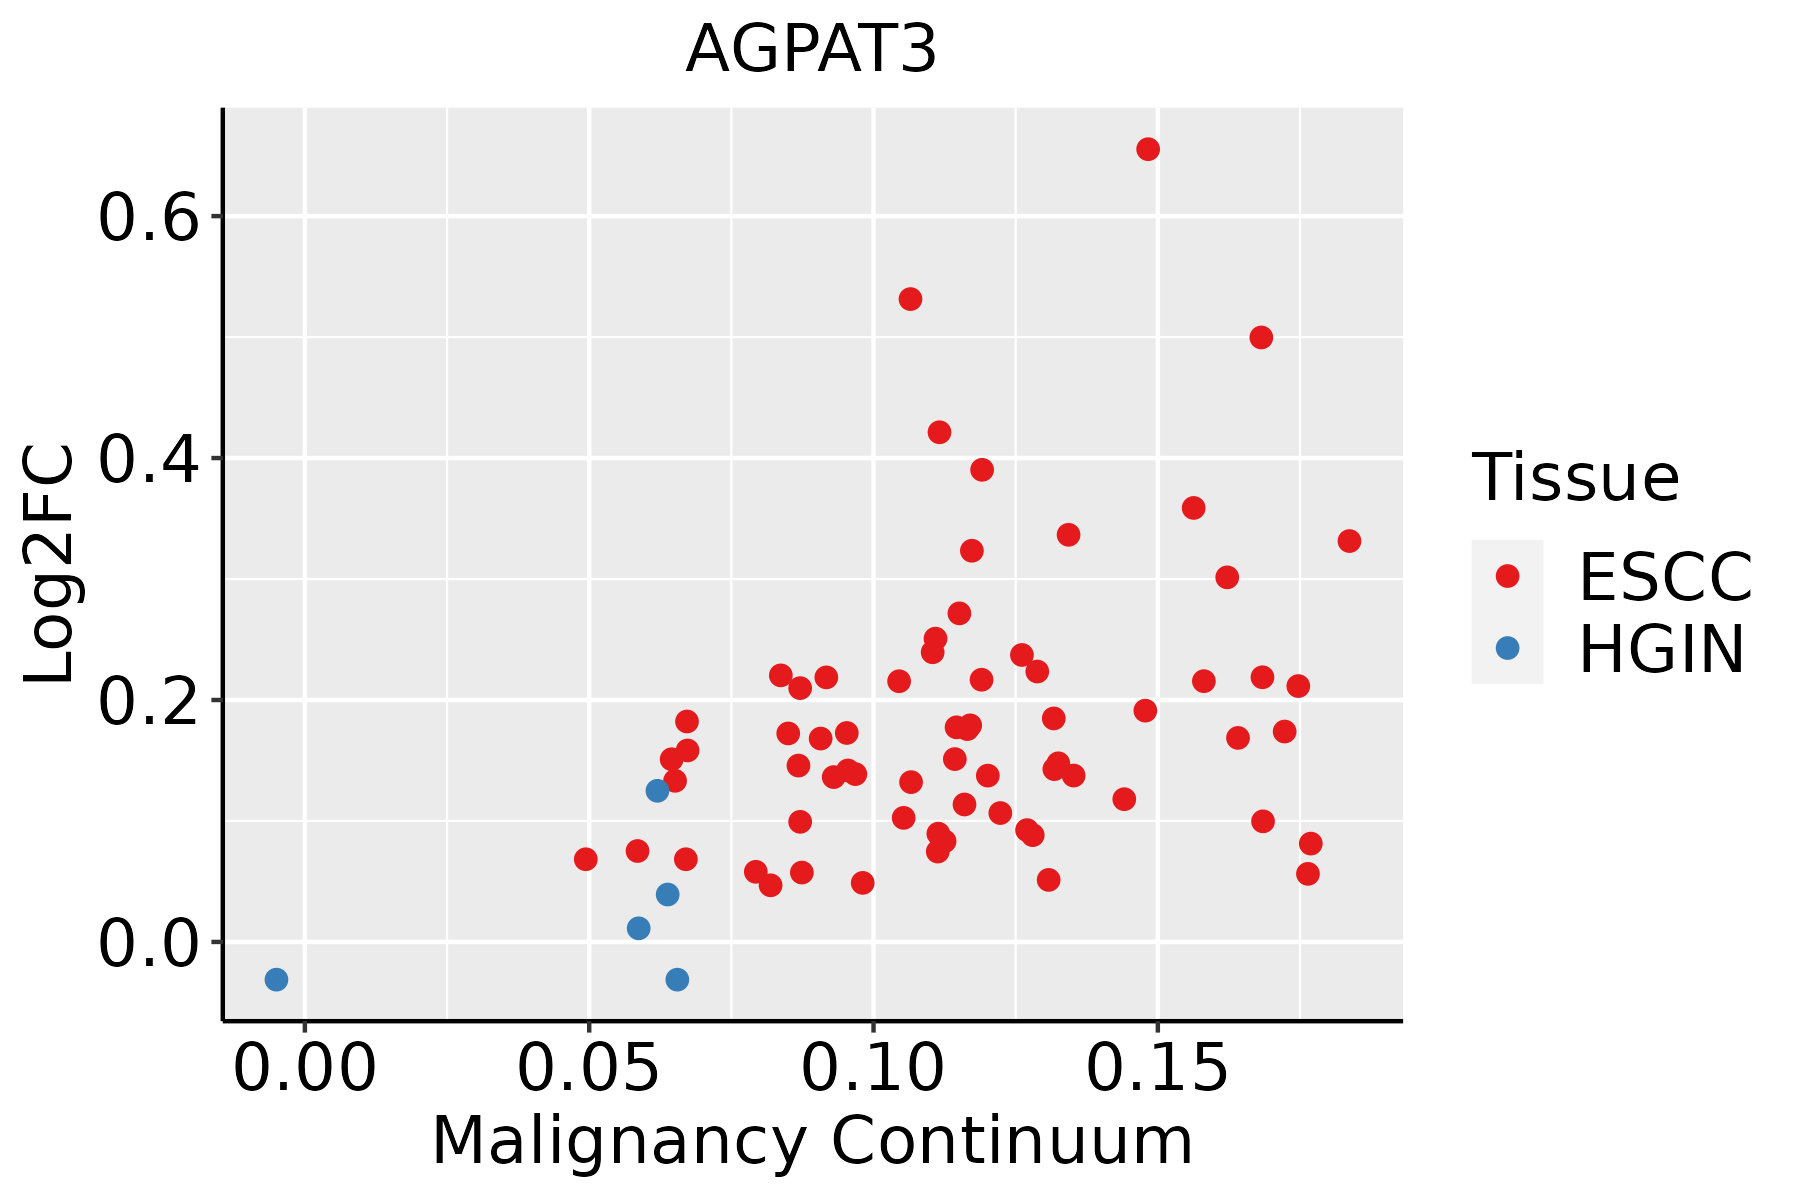 | ESCC: Esophageal squamous cell carcinoma |
| HGIN: High-grade intraepithelial neoplasias | ||
| LGIN: Low-grade intraepithelial neoplasias | ||
| Liver | 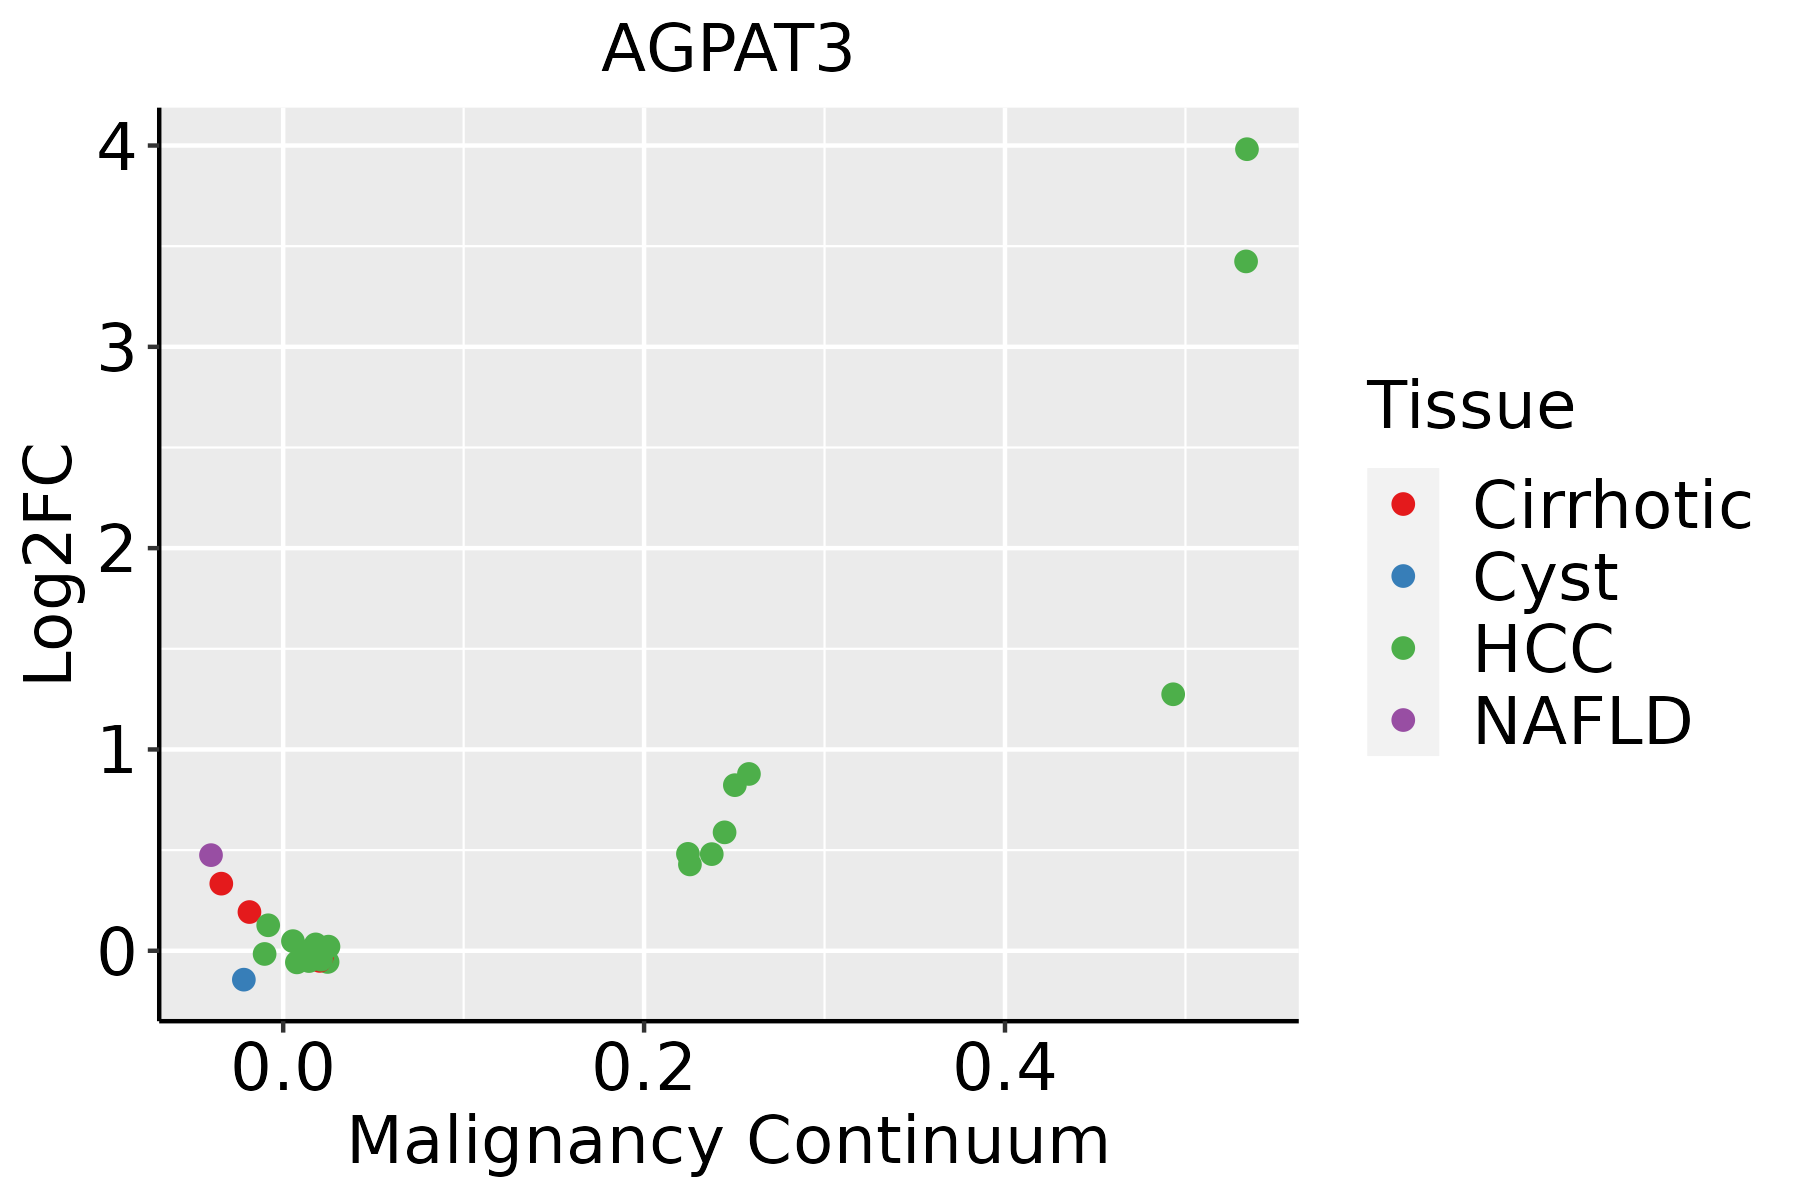 | HCC: Hepatocellular carcinoma |
| NAFLD: Non-alcoholic fatty liver disease | ||
| Oral Cavity | 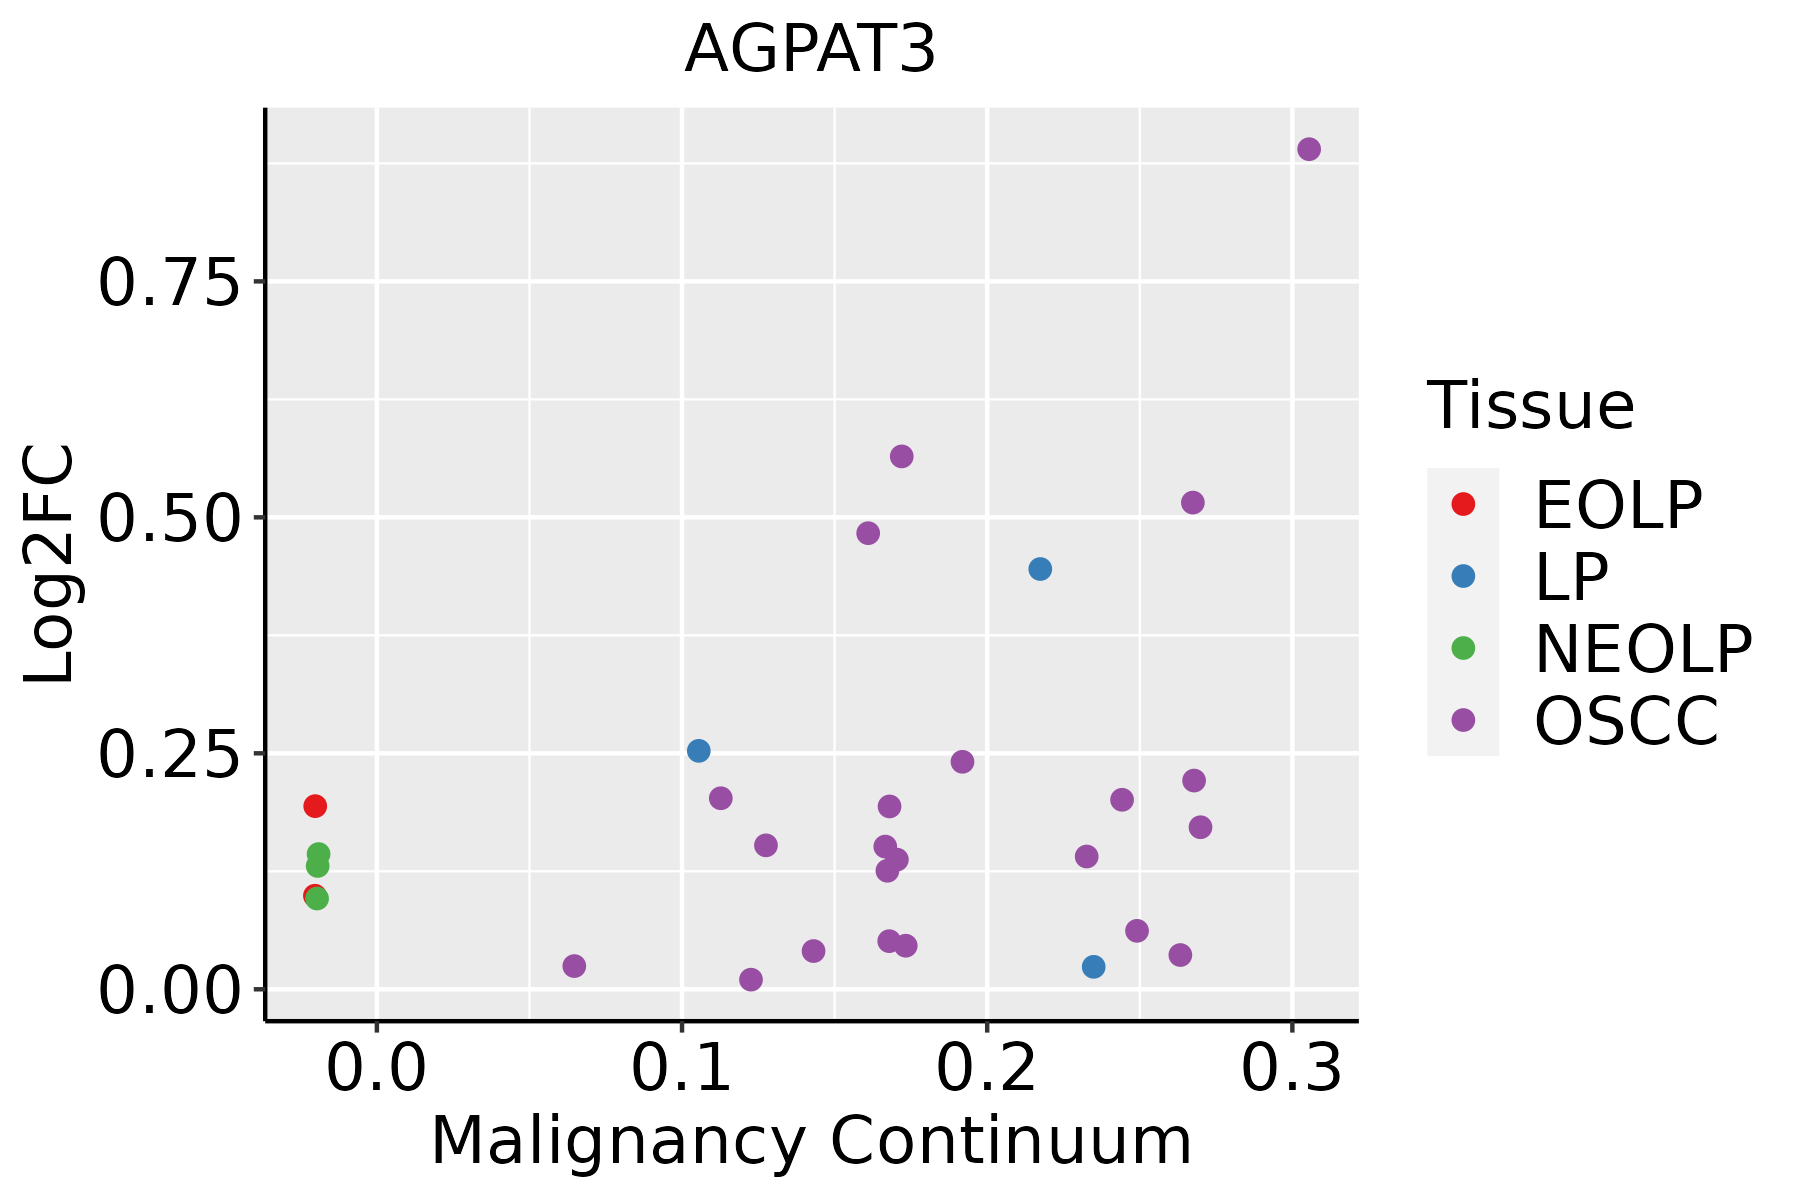 | EOLP: Erosive Oral lichen planus |
| LP: leukoplakia | ||
| NEOLP: Non-erosive oral lichen planus | ||
| OSCC: Oral squamous cell carcinoma | ||
| Prostate |  | BPH: Benign Prostatic Hyperplasia |
| Thyroid | 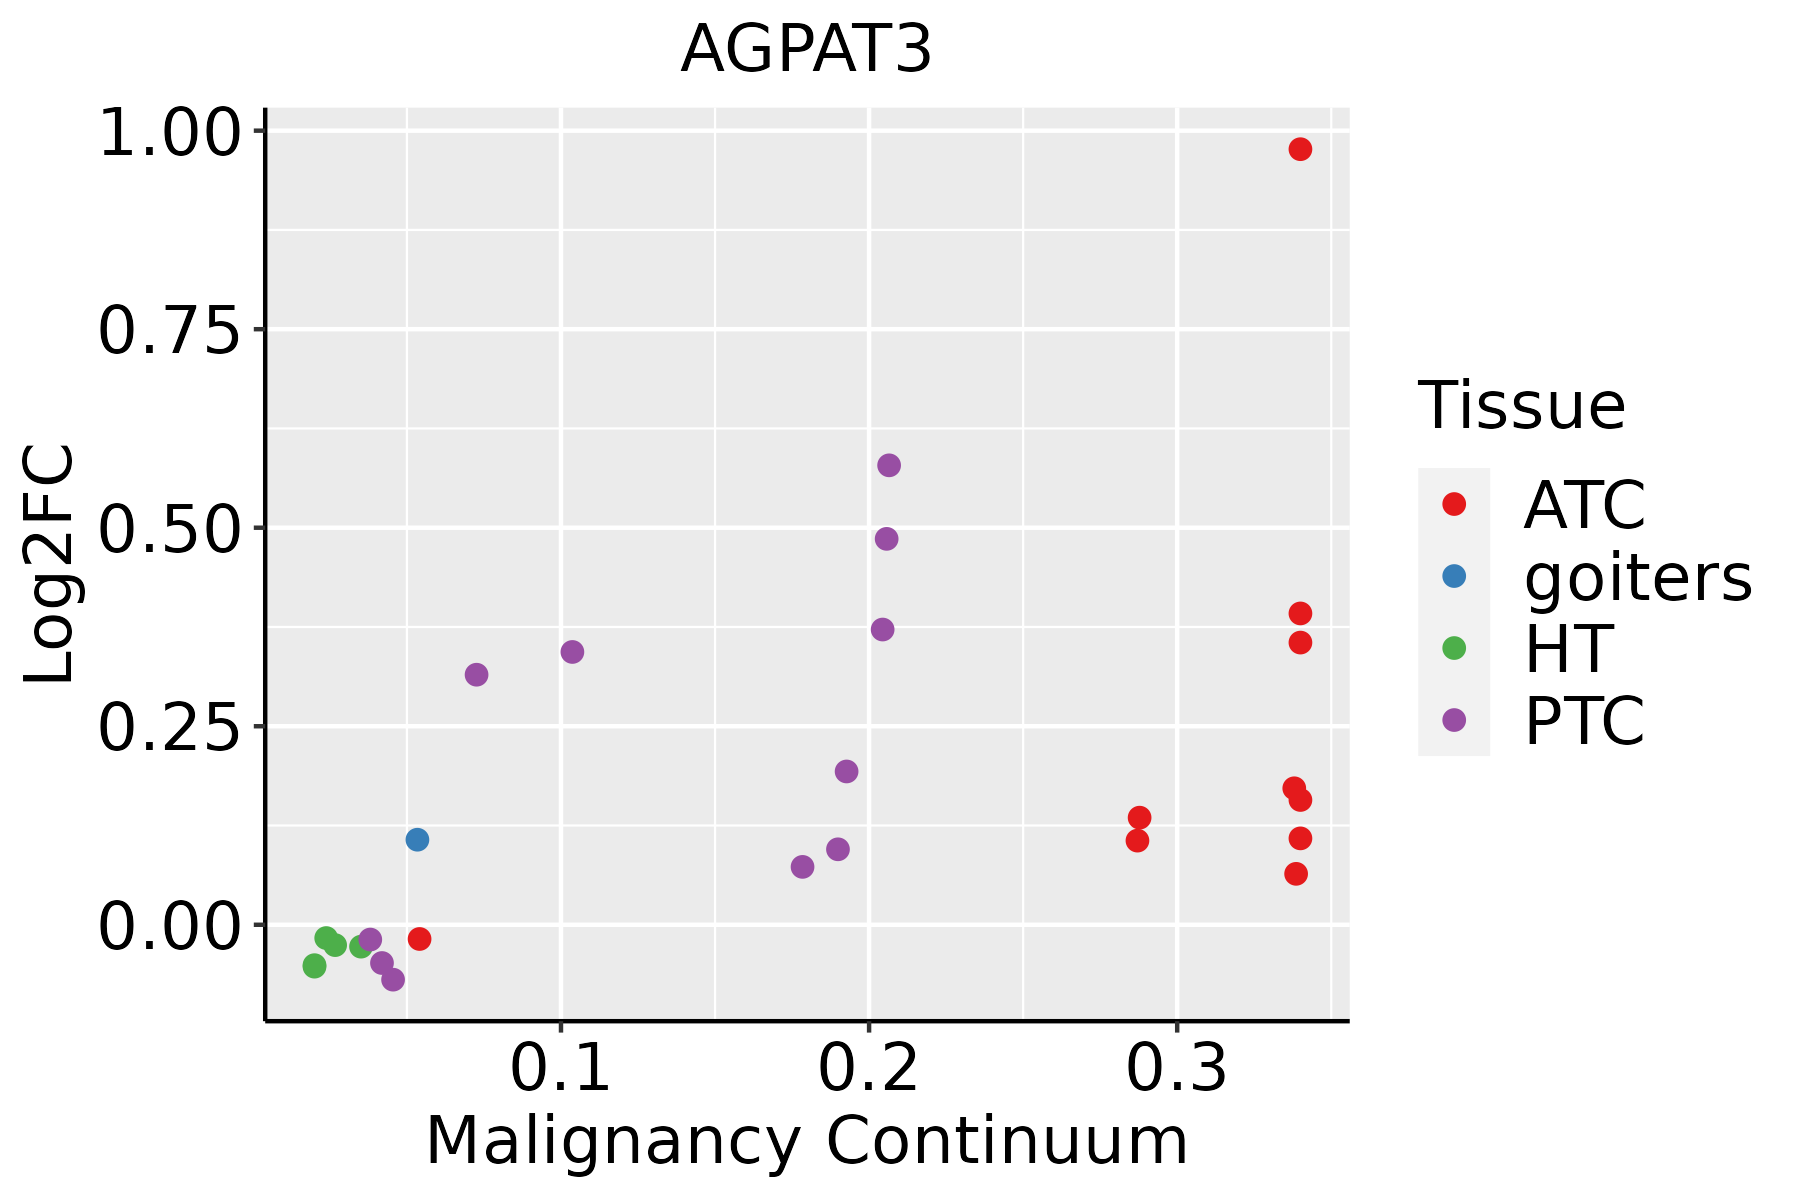 | ATC: Anaplastic thyroid cancer |
| HT: Hashimoto's thyroiditis | ||
| PTC: Papillary thyroid cancer |
| ∗log2FC in expression of this searched gene in stem-like cells from each diseased tissue sample relative to stem-like cells in normal samples in each tissue plotted against the malignancy continuum. Samples are colored based on if they are from different disease stage. |
Top |
Malignant transformation related pathway analysis |
| Find out the enriched GO biological processes and KEGG pathways involved in transition from healthy to precancer to cancer |
| Tissue | Disease Stage | Enriched GO biological Processes |
| Colorectum | AD |  |
| Colorectum | SER |  |
| Colorectum | MSS |  |
| Colorectum | MSI-H |  |
| Colorectum | FAP |  |
| ∗Top 15 enriched GO BP terms are showed in the bar plot of each disease state in each tissue. Each row represents a significant GO biological process which is colored according to the -log10(p.adjust). |
| Page: 1 2 3 4 5 6 7 8 9 |
| GO ID | Tissue | Disease Stage | Description | Gene Ratio | Bg Ratio | pvalue | p.adjust | Count |
| GO:0006650 | Colorectum | AD | glycerophospholipid metabolic process | 83/3918 | 306/18723 | 5.40e-03 | 3.55e-02 | 83 |
| GO:0006644 | Colorectum | AD | phospholipid metabolic process | 101/3918 | 383/18723 | 5.80e-03 | 3.67e-02 | 101 |
| GO:0045017 | Colorectum | AD | glycerolipid biosynthetic process | 69/3918 | 252/18723 | 8.33e-03 | 4.88e-02 | 69 |
| GO:0008654 | Colorectum | FAP | phospholipid biosynthetic process | 54/2622 | 253/18723 | 8.88e-04 | 9.08e-03 | 54 |
| GO:00066502 | Colorectum | FAP | glycerophospholipid metabolic process | 62/2622 | 306/18723 | 1.54e-03 | 1.38e-02 | 62 |
| GO:00066442 | Colorectum | FAP | phospholipid metabolic process | 74/2622 | 383/18723 | 2.24e-03 | 1.83e-02 | 74 |
| GO:0046473 | Colorectum | FAP | phosphatidic acid metabolic process | 12/2622 | 37/18723 | 3.43e-03 | 2.48e-02 | 12 |
| GO:0046474 | Colorectum | FAP | glycerophospholipid biosynthetic process | 44/2622 | 211/18723 | 3.98e-03 | 2.76e-02 | 44 |
| GO:00450172 | Colorectum | FAP | glycerolipid biosynthetic process | 50/2622 | 252/18723 | 6.32e-03 | 3.95e-02 | 50 |
| GO:00086544 | Esophagus | ESCC | phospholipid biosynthetic process | 162/8552 | 253/18723 | 2.59e-09 | 5.73e-08 | 162 |
| GO:00464744 | Esophagus | ESCC | glycerophospholipid biosynthetic process | 135/8552 | 211/18723 | 5.75e-08 | 1.02e-06 | 135 |
| GO:00450175 | Esophagus | ESCC | glycerolipid biosynthetic process | 154/8552 | 252/18723 | 5.20e-07 | 6.96e-06 | 154 |
| GO:00066446 | Esophagus | ESCC | phospholipid metabolic process | 218/8552 | 383/18723 | 5.37e-06 | 5.59e-05 | 218 |
| GO:00066505 | Esophagus | ESCC | glycerophospholipid metabolic process | 174/8552 | 306/18723 | 4.92e-05 | 3.85e-04 | 174 |
| GO:00066541 | Esophagus | ESCC | phosphatidic acid biosynthetic process | 26/8552 | 33/18723 | 1.06e-04 | 7.43e-04 | 26 |
| GO:00464733 | Esophagus | ESCC | phosphatidic acid metabolic process | 28/8552 | 37/18723 | 2.00e-04 | 1.26e-03 | 28 |
| GO:00464864 | Esophagus | ESCC | glycerolipid metabolic process | 211/8552 | 392/18723 | 6.51e-04 | 3.46e-03 | 211 |
| GO:00463411 | Esophagus | ESCC | CDP-diacylglycerol metabolic process | 11/8552 | 14/18723 | 1.30e-02 | 4.27e-02 | 11 |
| GO:00464863 | Liver | NAFLD | glycerolipid metabolic process | 66/1882 | 392/18723 | 1.94e-05 | 5.52e-04 | 66 |
| GO:00450174 | Liver | NAFLD | glycerolipid biosynthetic process | 43/1882 | 252/18723 | 3.83e-04 | 5.73e-03 | 43 |
| Page: 1 2 |
| Pathway ID | Tissue | Disease Stage | Description | Gene Ratio | Bg Ratio | pvalue | p.adjust | qvalue | Count |
| hsa00561 | Colorectum | AD | Glycerolipid metabolism | 24/2092 | 63/8465 | 1.25e-02 | 4.54e-02 | 2.90e-02 | 24 |
| hsa005611 | Colorectum | AD | Glycerolipid metabolism | 24/2092 | 63/8465 | 1.25e-02 | 4.54e-02 | 2.90e-02 | 24 |
| hsa005615 | Liver | HCC | Glycerolipid metabolism | 41/4020 | 63/8465 | 3.59e-03 | 1.12e-02 | 6.22e-03 | 41 |
| hsa0056112 | Liver | HCC | Glycerolipid metabolism | 41/4020 | 63/8465 | 3.59e-03 | 1.12e-02 | 6.22e-03 | 41 |
| Page: 1 |
Top |
Cell-cell communication analysis |
| Identification of potential cell-cell interactions between two cell types and their ligand-receptor pairs for different disease states |
| Ligand | Receptor | LRpair | Pathway | Tissue | Disease Stage |
| Page: 1 |
Top |
Single-cell gene regulatory network inference analysis |
| Find out the significant the regulons (TFs) and the target genes of each regulon across cell types for different disease states |
| TF | Cell Type | Tissue | Disease Stage | Target Gene | RSS | Regulon Activity |
| ∗The dot plots of a searched regulon are shown for all cell subpopulations in each disease state of each tissue based on the regulon specific score inferred using pySCENIC and by calculating the average expression. |
| Page: 1 |
Top |
Somatic mutation of malignant transformation related genes |
| Annotation of somatic variants for genes involved in malignant transformation |
| Hugo Symbol | Variant Class | Variant Classification | dbSNP RS | HGVSc | HGVSp | HGVSp Short | SWISSPROT | BIOTYPE | SIFT | PolyPhen | Tumor Sample Barcode | Tissue | Histology | Sex | Age | Stage | Therapy Types | Drugs | Outcome |
| AGPAT3 | SNV | Missense_Mutation | novel | c.542N>T | p.Thr181Met | p.T181M | Q9NRZ7 | protein_coding | deleterious(0) | probably_damaging(0.998) | TCGA-HU-A4GP-01 | Stomach | stomach adenocarcinoma | Female | <65 | I/II | Chemotherapy | didox | SD |
| Page: 1 2 3 4 5 |
Top |
Related drugs of malignant transformation related genes |
| Identification of chemicals and drugs interact with genes involved in malignant transfromation |
| (DGIdb 4.0) |
| Entrez ID | Symbol | Category | Interaction Types | Drug Claim Name | Drug Name | PMIDs |
| Page: 1 |

Copyright 2023-Present -The University of Texas Health Science Center at Houston |