
|
|||||
|
 | |
| |
| |
| |
| |
| |
|
Gene: ADH6 |
Gene summary for ADH6 |
| Gene information | Species | Human | Gene symbol | ADH6 | Gene ID | 130 |
| Gene name | alcohol dehydrogenase 6 (class V) | |
| Gene Alias | ADH-5 | |
| Cytomap | 4q23 | |
| Gene Type | protein-coding | GO ID | GO:0001523 | UniProtAcc | P28332 |
Top |
Malignant transformation analysis |
| Identification of the aberrant gene expression in precancerous and cancerous lesions by comparing the gene expression of stem-like cells in diseased tissues with normal stem cells |
| Entrez ID | Symbol | Replicates | Species | Organ | Tissue | Adj P-value | Log2FC | Malignancy |
| 130 | ADH6 | HCC1_Meng | Human | Liver | HCC | 6.45e-36 | -1.87e-02 | 0.0246 |
| 130 | ADH6 | HCC2_Meng | Human | Liver | HCC | 3.22e-02 | -8.58e-02 | 0.0107 |
| 130 | ADH6 | HCC1 | Human | Liver | HCC | 1.49e-17 | 5.32e+00 | 0.5336 |
| 130 | ADH6 | HCC2 | Human | Liver | HCC | 5.80e-15 | 3.74e+00 | 0.5341 |
| 130 | ADH6 | HCC5 | Human | Liver | HCC | 2.31e-03 | 3.38e+00 | 0.4932 |
| 130 | ADH6 | Pt14.a | Human | Liver | HCC | 9.37e-03 | 4.42e-01 | 0.0169 |
| 130 | ADH6 | S014 | Human | Liver | HCC | 6.40e-22 | 1.03e+00 | 0.2254 |
| 130 | ADH6 | S015 | Human | Liver | HCC | 2.77e-10 | 9.79e-01 | 0.2375 |
| 130 | ADH6 | S016 | Human | Liver | HCC | 3.03e-27 | 9.59e-01 | 0.2243 |
| Page: 1 |
| Tissue | Expression Dynamics | Abbreviation |
| Liver | 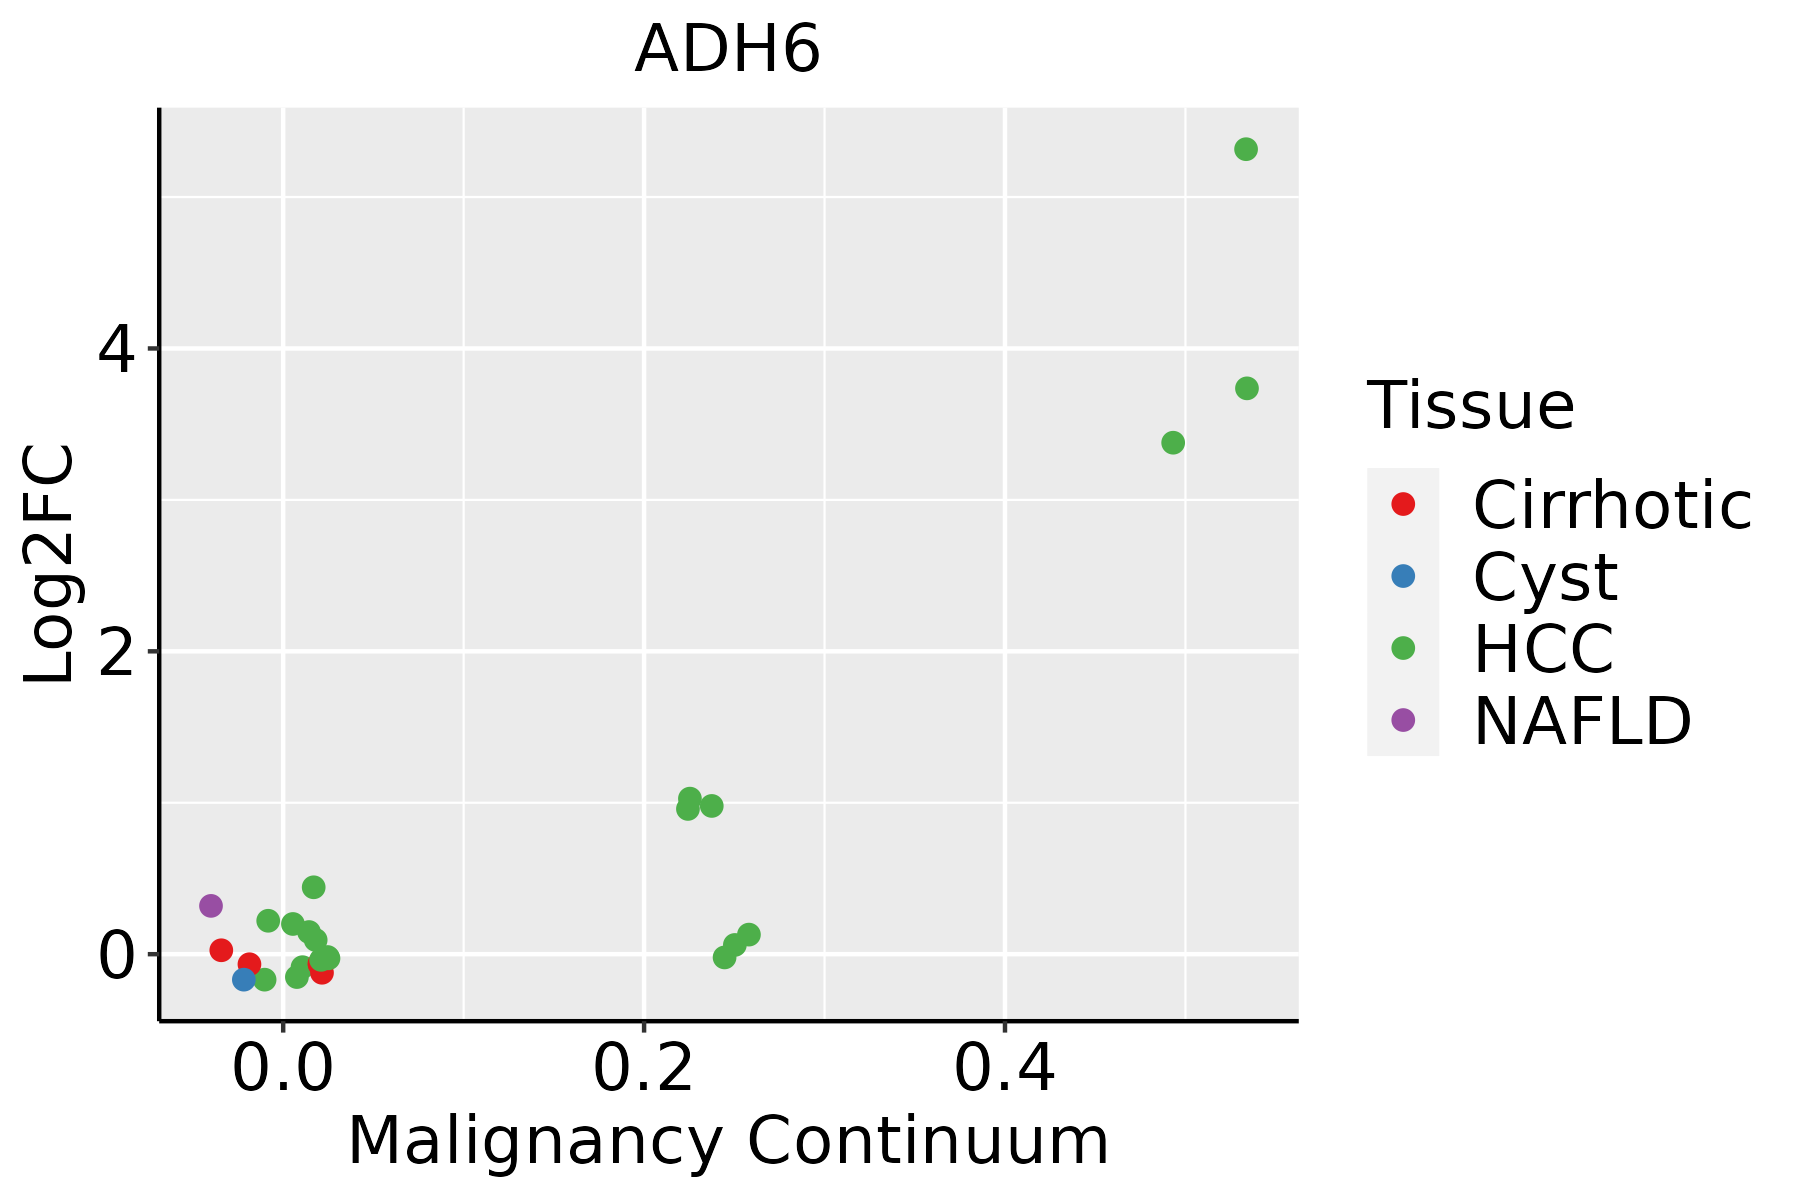 | HCC: Hepatocellular carcinoma |
| NAFLD: Non-alcoholic fatty liver disease |
| ∗log2FC in expression of this searched gene in stem-like cells from each diseased tissue sample relative to stem-like cells in normal samples in each tissue plotted against the malignancy continuum. Samples are colored based on if they are from different disease stage. |
Top |
Malignant transformation related pathway analysis |
| Find out the enriched GO biological processes and KEGG pathways involved in transition from healthy to precancer to cancer |
| Tissue | Disease Stage | Enriched GO biological Processes |
| Colorectum | AD |  |
| Colorectum | SER |  |
| Colorectum | MSS |  |
| Colorectum | MSI-H |  |
| Colorectum | FAP |  |
| ∗Top 15 enriched GO BP terms are showed in the bar plot of each disease state in each tissue. Each row represents a significant GO biological process which is colored according to the -log10(p.adjust). |
| Page: 1 2 3 4 5 6 7 8 9 |
| GO ID | Tissue | Disease Stage | Description | Gene Ratio | Bg Ratio | pvalue | p.adjust | Count |
| GO:000609122 | Liver | HCC | generation of precursor metabolites and energy | 340/7958 | 490/18723 | 4.04e-34 | 2.85e-31 | 340 |
| GO:000606621 | Liver | HCC | alcohol metabolic process | 208/7958 | 353/18723 | 2.80e-10 | 9.50e-09 | 208 |
| GO:009730522 | Liver | HCC | response to alcohol | 138/7958 | 253/18723 | 6.91e-05 | 6.26e-04 | 138 |
| GO:000672011 | Liver | HCC | isoprenoid metabolic process | 65/7958 | 116/18723 | 2.23e-03 | 1.11e-02 | 65 |
| GO:00454712 | Liver | HCC | response to ethanol | 72/7958 | 137/18723 | 1.10e-02 | 4.07e-02 | 72 |
| GO:003430812 | Liver | HCC | primary alcohol metabolic process | 55/7958 | 102/18723 | 1.30e-02 | 4.67e-02 | 55 |
| Page: 1 |
| Pathway ID | Tissue | Disease Stage | Description | Gene Ratio | Bg Ratio | pvalue | p.adjust | qvalue | Count |
| hsa0062021 | Liver | HCC | Pyruvate metabolism | 37/4020 | 47/8465 | 1.10e-05 | 8.03e-05 | 4.46e-05 | 37 |
| hsa0007141 | Liver | HCC | Fatty acid degradation | 33/4020 | 43/8465 | 8.41e-05 | 4.27e-04 | 2.37e-04 | 33 |
| hsa049362 | Liver | HCC | Alcoholic liver disease | 89/4020 | 142/8465 | 1.73e-04 | 8.53e-04 | 4.75e-04 | 89 |
| hsa0001022 | Liver | HCC | Glycolysis / Gluconeogenesis | 43/4020 | 67/8465 | 4.26e-03 | 1.29e-02 | 7.15e-03 | 43 |
| hsa0062031 | Liver | HCC | Pyruvate metabolism | 37/4020 | 47/8465 | 1.10e-05 | 8.03e-05 | 4.46e-05 | 37 |
| hsa0007151 | Liver | HCC | Fatty acid degradation | 33/4020 | 43/8465 | 8.41e-05 | 4.27e-04 | 2.37e-04 | 33 |
| hsa049363 | Liver | HCC | Alcoholic liver disease | 89/4020 | 142/8465 | 1.73e-04 | 8.53e-04 | 4.75e-04 | 89 |
| hsa0001032 | Liver | HCC | Glycolysis / Gluconeogenesis | 43/4020 | 67/8465 | 4.26e-03 | 1.29e-02 | 7.15e-03 | 43 |
| Page: 1 |
Top |
Cell-cell communication analysis |
| Identification of potential cell-cell interactions between two cell types and their ligand-receptor pairs for different disease states |
| Ligand | Receptor | LRpair | Pathway | Tissue | Disease Stage |
| Page: 1 |
Top |
Single-cell gene regulatory network inference analysis |
| Find out the significant the regulons (TFs) and the target genes of each regulon across cell types for different disease states |
| TF | Cell Type | Tissue | Disease Stage | Target Gene | RSS | Regulon Activity |
| ∗The dot plots of a searched regulon are shown for all cell subpopulations in each disease state of each tissue based on the regulon specific score inferred using pySCENIC and by calculating the average expression. |
| Page: 1 |
Top |
Somatic mutation of malignant transformation related genes |
| Annotation of somatic variants for genes involved in malignant transformation |
| Hugo Symbol | Variant Class | Variant Classification | dbSNP RS | HGVSc | HGVSp | HGVSp Short | SWISSPROT | BIOTYPE | SIFT | PolyPhen | Tumor Sample Barcode | Tissue | Histology | Sex | Age | Stage | Therapy Types | Drugs | Outcome |
| ADH6 | SNV | Missense_Mutation | rs771006984 | c.1108N>T | p.Arg370Cys | p.R370C | protein_coding | deleterious(0.01) | possibly_damaging(0.607) | TCGA-FP-A4BE-01 | Stomach | stomach adenocarcinoma | Male | <65 | I/II | Chemotherapy | 5-fluorouracil | CR | |
| ADH6 | insertion | In_Frame_Ins | novel | c.865_866insGGG | p.Gly288dup | p.G288dup | protein_coding | TCGA-BR-8373-01 | Stomach | stomach adenocarcinoma | Female | >=65 | III/IV | Chemotherapy | 5-fluorouracil | CR |
| Page: 1 2 3 4 5 |
Top |
Related drugs of malignant transformation related genes |
| Identification of chemicals and drugs interact with genes involved in malignant transfromation |
| (DGIdb 4.0) |
| Entrez ID | Symbol | Category | Interaction Types | Drug Claim Name | Drug Name | PMIDs |
| Page: 1 |

Copyright 2023-Present -The University of Texas Health Science Center at Houston |