
|
|||||
|
 | |
| |
| |
| |
| |
| |
|
Gene: TMEM248 |
Gene summary for TMEM248 |
| Gene information | Species | Human | Gene symbol | TMEM248 | Gene ID | 55069 |
| Gene name | transmembrane protein 248 | |
| Gene Alias | C7orf42 | |
| Cytomap | 7q11.21 | |
| Gene Type | protein-coding | GO ID | GO:0005575 | UniProtAcc | A0A024RDK7 |
Top |
Malignant transformation analysis |
| Identification of the aberrant gene expression in precancerous and cancerous lesions by comparing the gene expression of stem-like cells in diseased tissues with normal stem cells |
| Entrez ID | Symbol | Replicates | Species | Organ | Tissue | Adj P-value | Log2FC | Malignancy |
| 55069 | TMEM248 | HTA11_2487_2000001011 | Human | Colorectum | SER | 4.82e-07 | 5.39e-01 | -0.1808 |
| 55069 | TMEM248 | HTA11_1938_2000001011 | Human | Colorectum | AD | 1.16e-12 | 6.99e-01 | -0.0811 |
| 55069 | TMEM248 | HTA11_78_2000001011 | Human | Colorectum | AD | 2.56e-12 | 5.80e-01 | -0.1088 |
| 55069 | TMEM248 | HTA11_347_2000001011 | Human | Colorectum | AD | 1.14e-27 | 7.42e-01 | -0.1954 |
| 55069 | TMEM248 | HTA11_411_2000001011 | Human | Colorectum | SER | 1.07e-05 | 8.32e-01 | -0.2602 |
| 55069 | TMEM248 | HTA11_2112_2000001011 | Human | Colorectum | SER | 3.17e-02 | 5.80e-01 | -0.2196 |
| 55069 | TMEM248 | HTA11_3361_2000001011 | Human | Colorectum | AD | 3.16e-03 | 3.79e-01 | -0.1207 |
| 55069 | TMEM248 | HTA11_83_2000001011 | Human | Colorectum | SER | 9.83e-06 | 5.06e-01 | -0.1526 |
| 55069 | TMEM248 | HTA11_696_2000001011 | Human | Colorectum | AD | 1.08e-13 | 6.06e-01 | -0.1464 |
| 55069 | TMEM248 | HTA11_1391_2000001011 | Human | Colorectum | AD | 1.91e-15 | 7.31e-01 | -0.059 |
| 55069 | TMEM248 | HTA11_7862_2000001011 | Human | Colorectum | AD | 7.82e-04 | 4.82e-01 | -0.0179 |
| 55069 | TMEM248 | HTA11_866_3004761011 | Human | Colorectum | AD | 4.27e-14 | 5.66e-01 | 0.096 |
| 55069 | TMEM248 | HTA11_4255_2000001011 | Human | Colorectum | SER | 2.46e-05 | 6.99e-01 | 0.0446 |
| 55069 | TMEM248 | HTA11_8622_2000001021 | Human | Colorectum | SER | 1.69e-05 | 6.11e-01 | 0.0528 |
| 55069 | TMEM248 | HTA11_7696_3000711011 | Human | Colorectum | AD | 4.16e-06 | 3.97e-01 | 0.0674 |
| 55069 | TMEM248 | HTA11_7469_2000001011 | Human | Colorectum | AD | 1.28e-02 | 5.88e-01 | -0.0124 |
| 55069 | TMEM248 | HTA11_6818_2000001021 | Human | Colorectum | AD | 7.45e-05 | 4.74e-01 | 0.0588 |
| 55069 | TMEM248 | HTA11_99999970781_79442 | Human | Colorectum | MSS | 7.49e-22 | 8.30e-01 | 0.294 |
| 55069 | TMEM248 | HTA11_99999965062_69753 | Human | Colorectum | MSI-H | 1.72e-02 | 6.99e-01 | 0.3487 |
| 55069 | TMEM248 | HTA11_99999965104_69814 | Human | Colorectum | MSS | 2.61e-21 | 9.56e-01 | 0.281 |
| Page: 1 2 3 4 5 6 7 8 |
| Tissue | Expression Dynamics | Abbreviation |
| Colorectum (GSE201348) |  | FAP: Familial adenomatous polyposis |
| CRC: Colorectal cancer | ||
| Colorectum (HTA11) |  | AD: Adenomas |
| SER: Sessile serrated lesions | ||
| MSI-H: Microsatellite-high colorectal cancer | ||
| MSS: Microsatellite stable colorectal cancer | ||
| Esophagus |  | ESCC: Esophageal squamous cell carcinoma |
| HGIN: High-grade intraepithelial neoplasias | ||
| LGIN: Low-grade intraepithelial neoplasias | ||
| Liver |  | HCC: Hepatocellular carcinoma |
| NAFLD: Non-alcoholic fatty liver disease | ||
| Oral Cavity | 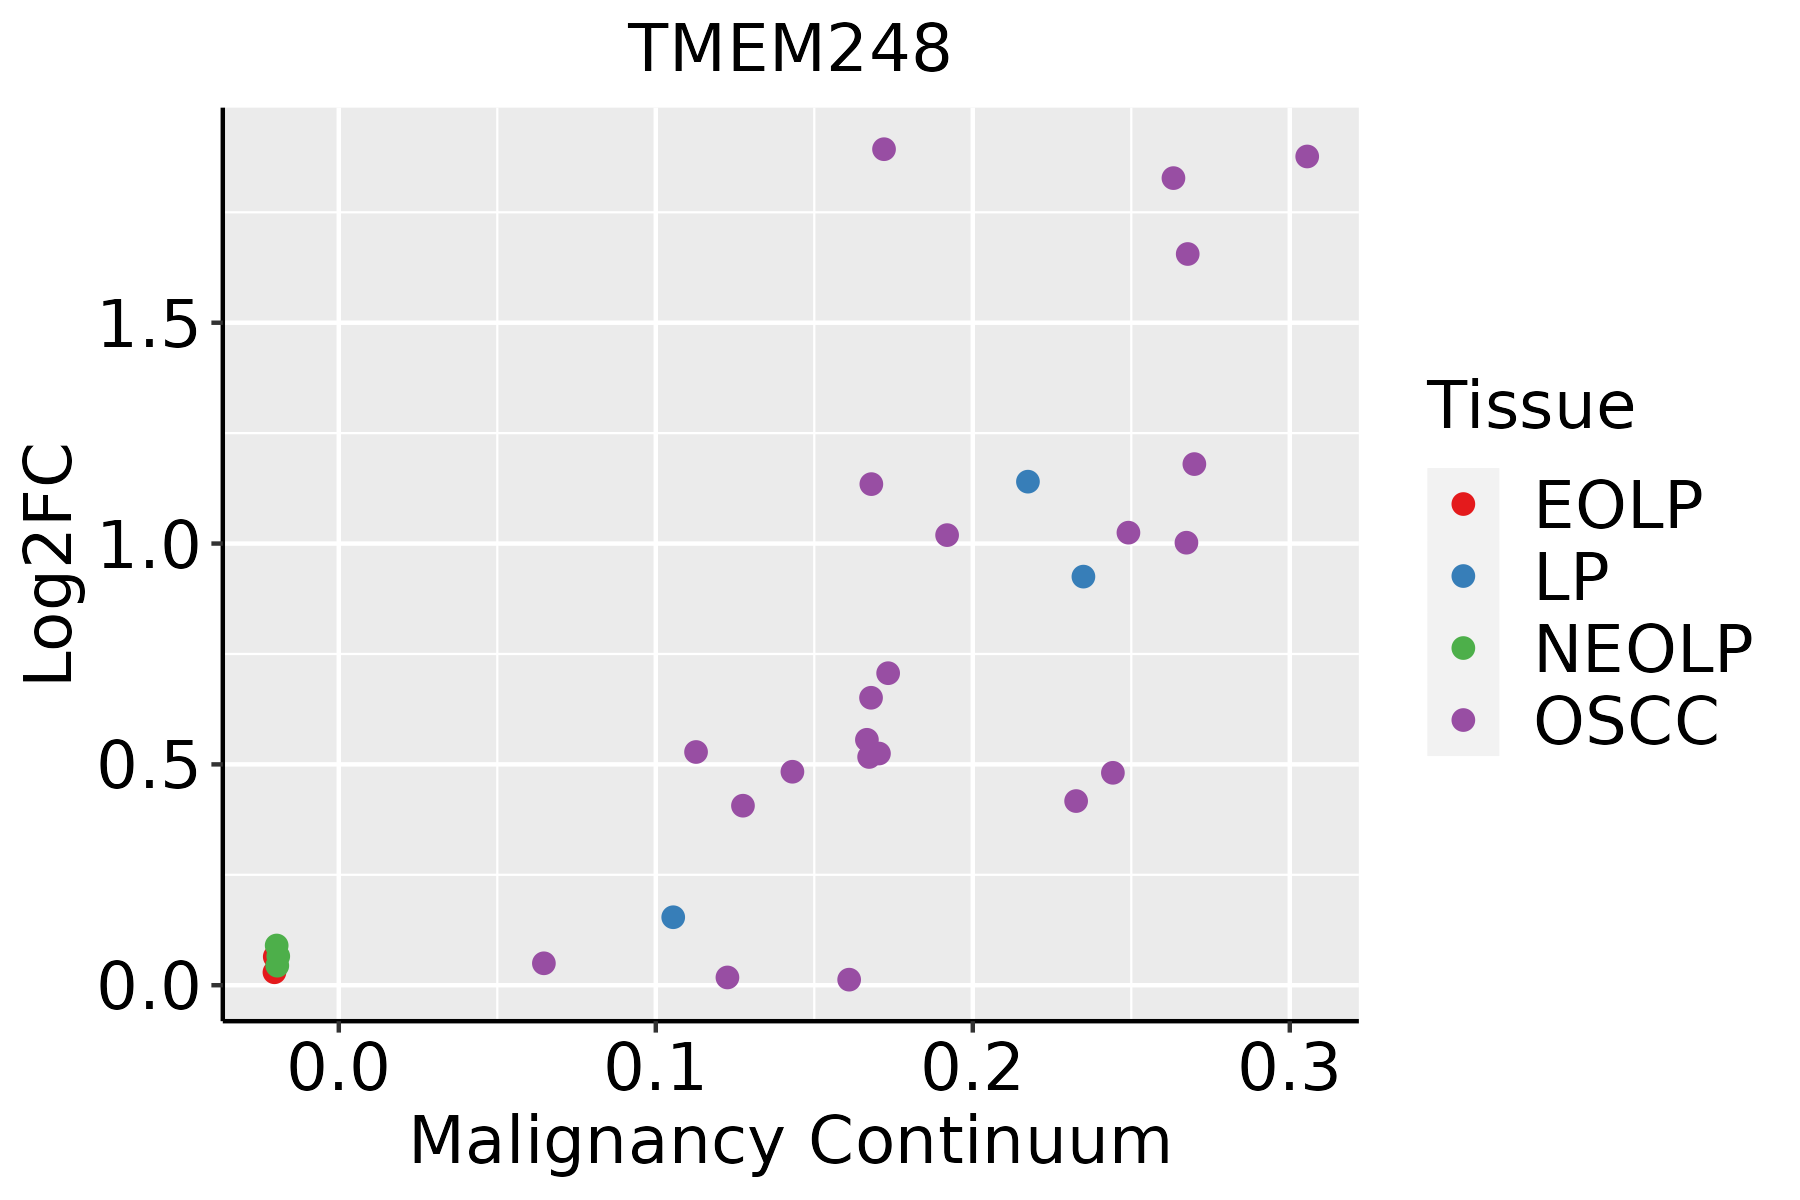 | EOLP: Erosive Oral lichen planus |
| LP: leukoplakia | ||
| NEOLP: Non-erosive oral lichen planus | ||
| OSCC: Oral squamous cell carcinoma | ||
| Prostate | 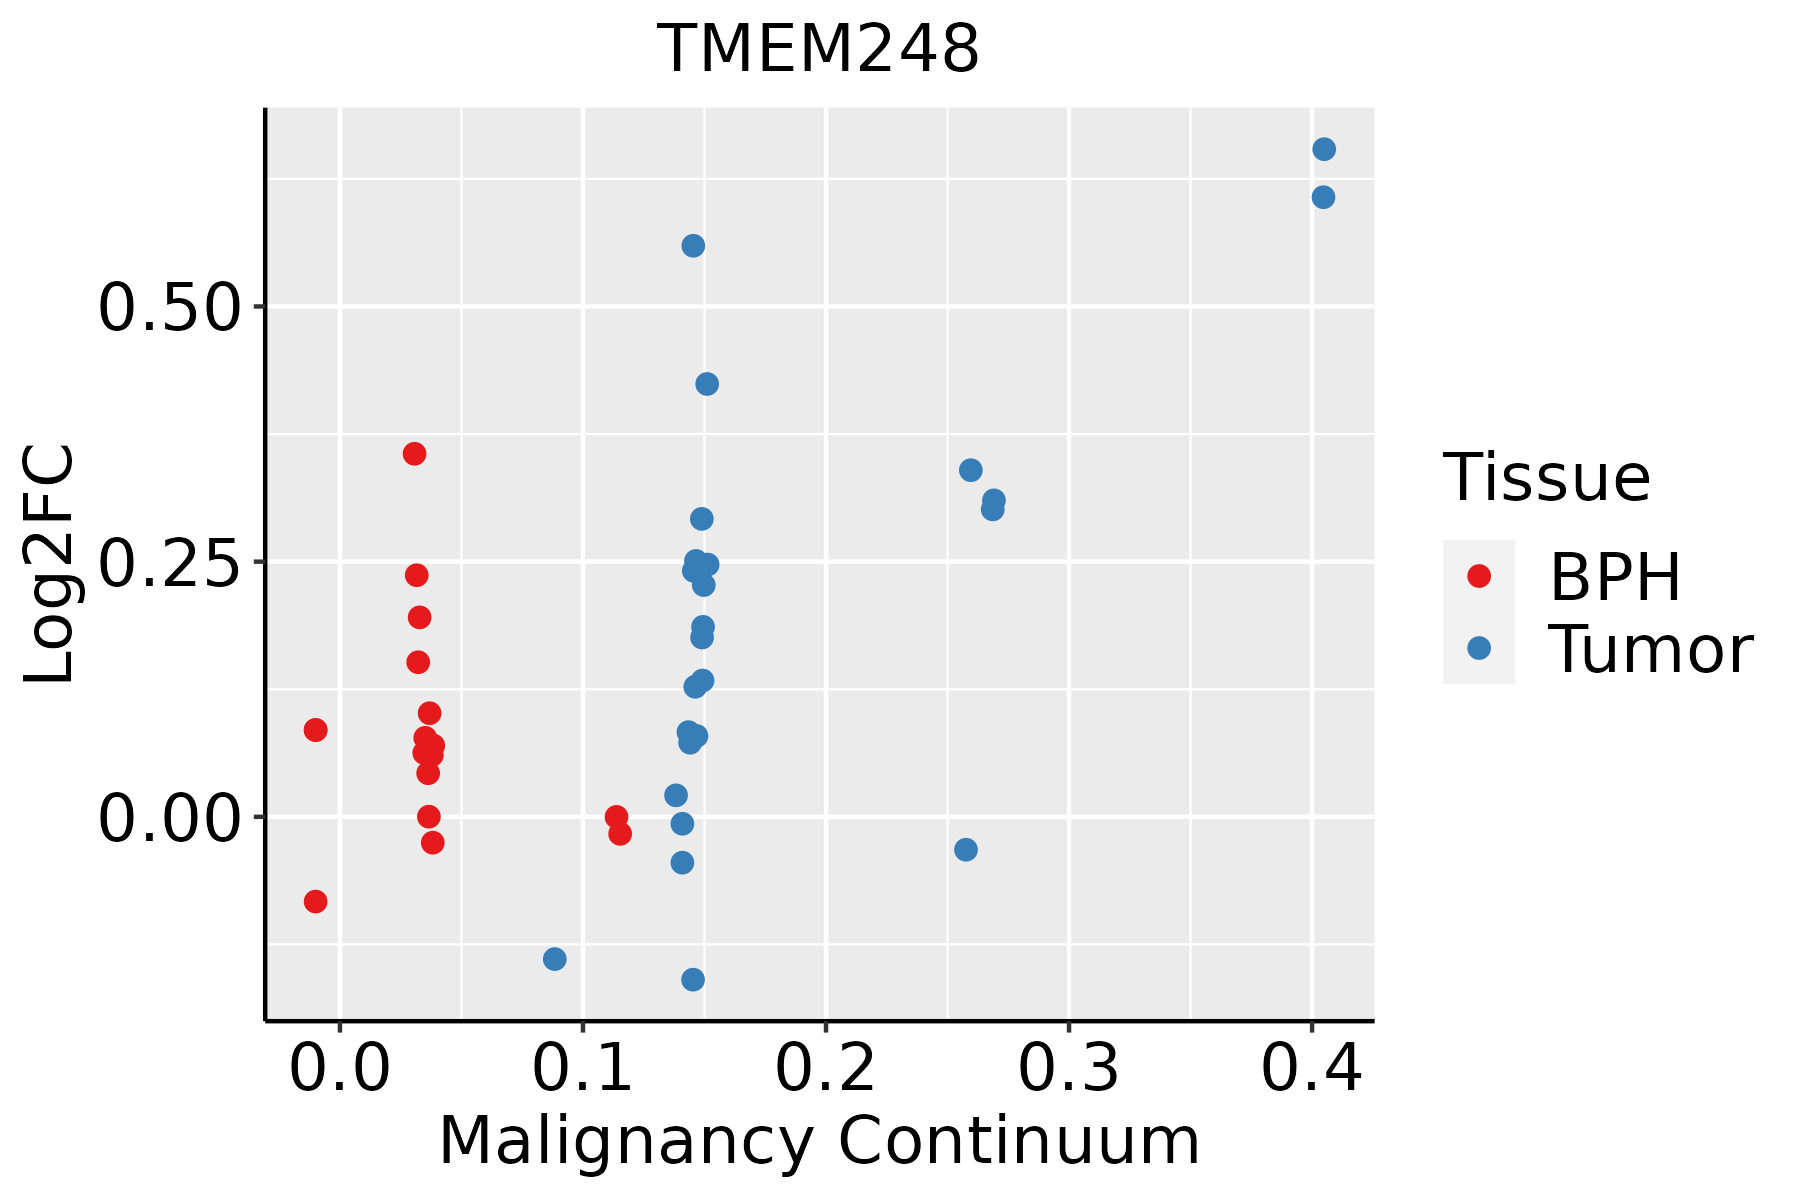 | BPH: Benign Prostatic Hyperplasia |
| Skin | 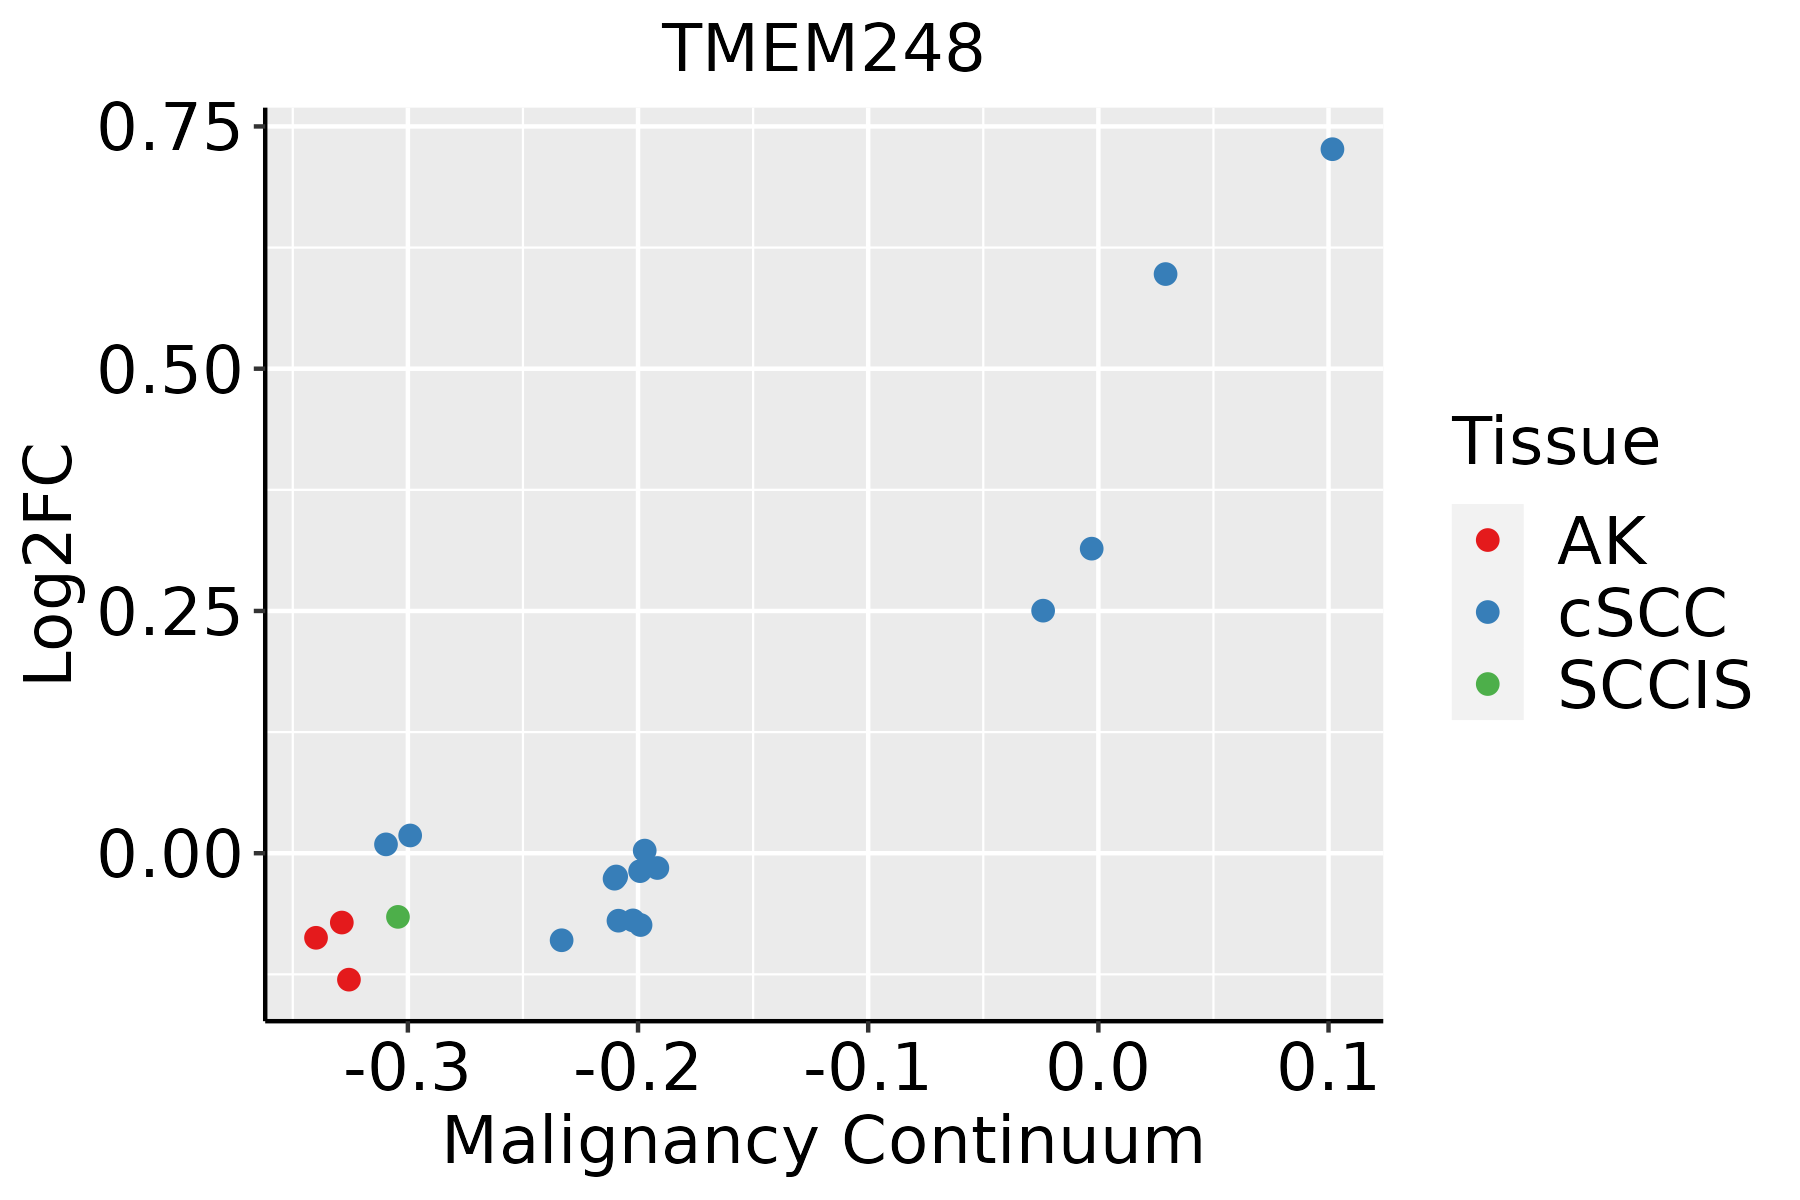 | AK: Actinic keratosis |
| cSCC: Cutaneous squamous cell carcinoma | ||
| SCCIS:squamous cell carcinoma in situ | ||
| Thyroid | 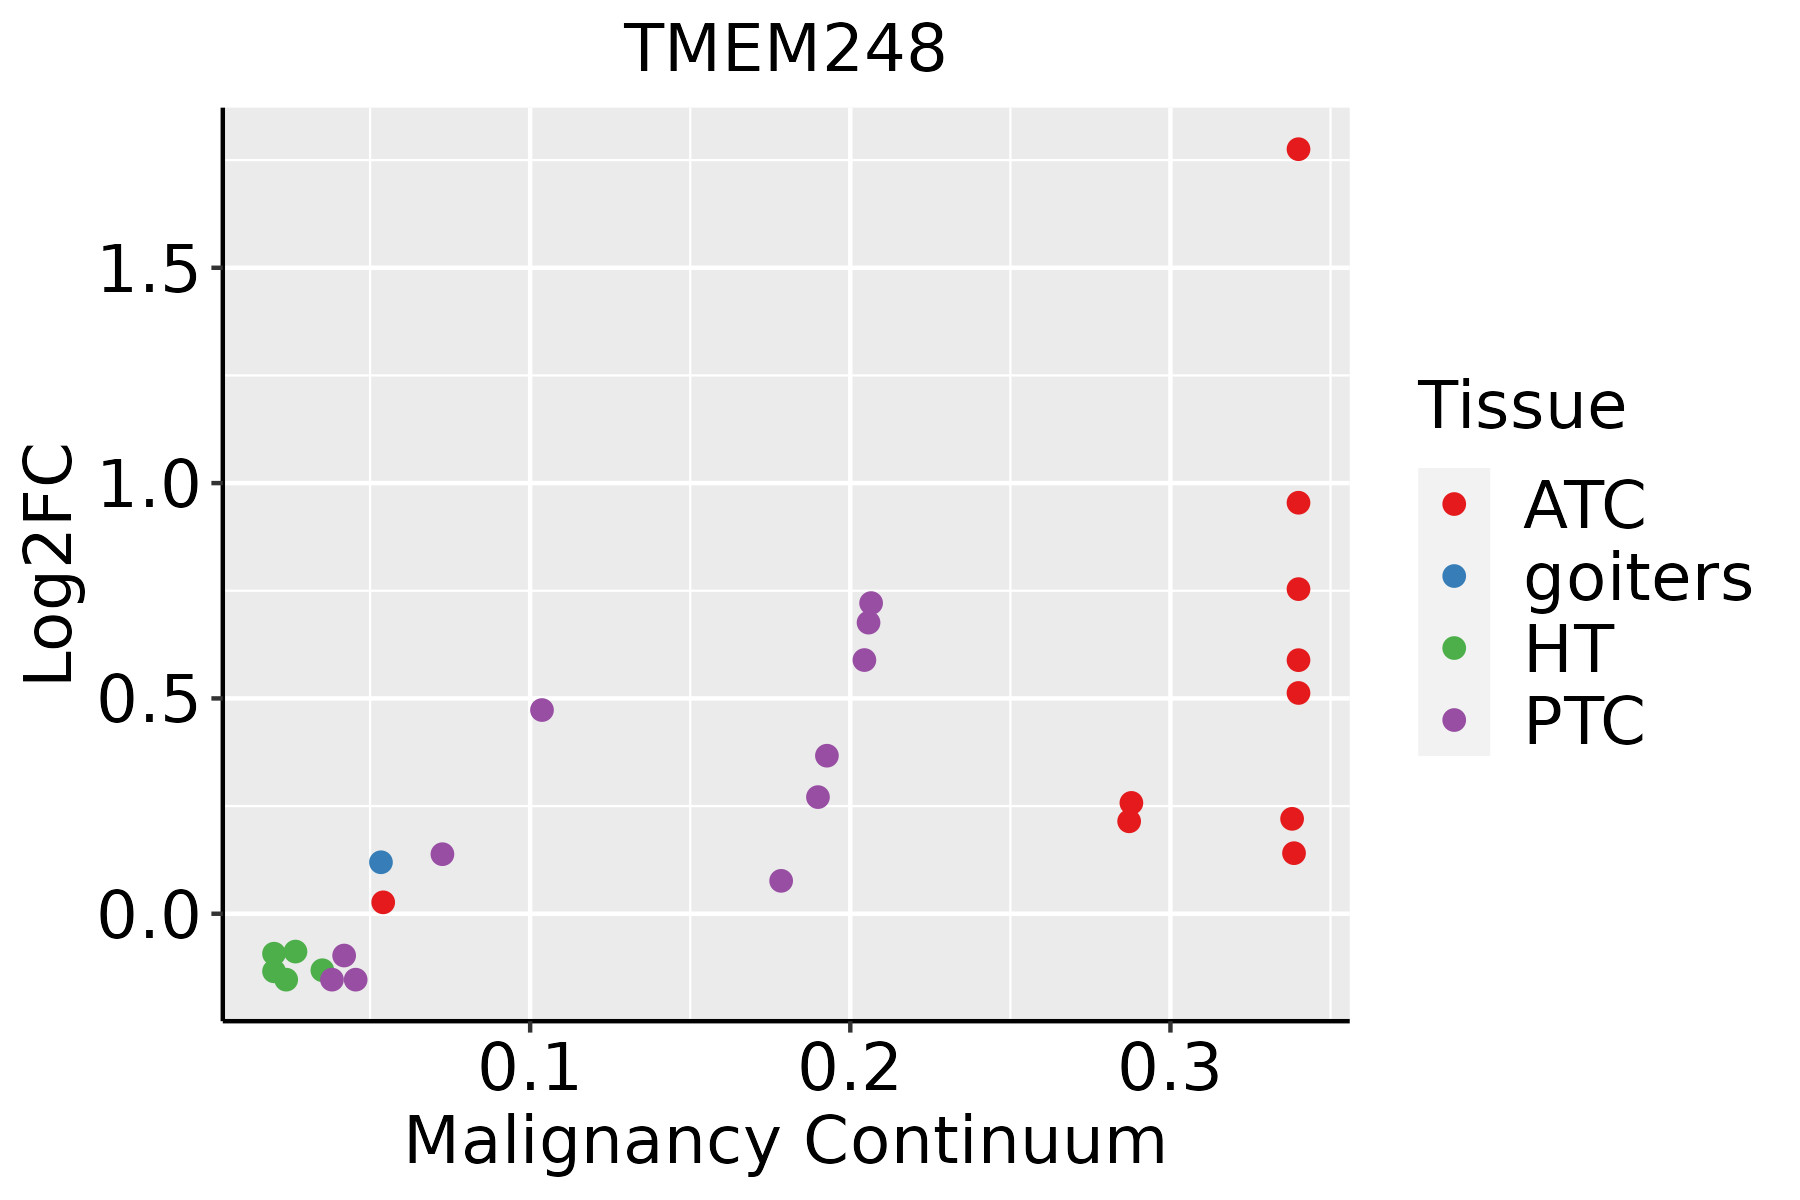 | ATC: Anaplastic thyroid cancer |
| HT: Hashimoto's thyroiditis | ||
| PTC: Papillary thyroid cancer |
| ∗log2FC in expression of this searched gene in stem-like cells from each diseased tissue sample relative to stem-like cells in normal samples in each tissue plotted against the malignancy continuum. Samples are colored based on if they are from different disease stage. |
Top |
Malignant transformation related pathway analysis |
| Find out the enriched GO biological processes and KEGG pathways involved in transition from healthy to precancer to cancer |
| Tissue | Disease Stage | Enriched GO biological Processes |
| Colorectum | AD |  |
| Colorectum | SER |  |
| Colorectum | MSS |  |
| Colorectum | MSI-H |  |
| Colorectum | FAP |  |
| ∗Top 15 enriched GO BP terms are showed in the bar plot of each disease state in each tissue. Each row represents a significant GO biological process which is colored according to the -log10(p.adjust). |
| Page: 1 2 3 4 5 6 7 8 9 |
| GO ID | Tissue | Disease Stage | Description | Gene Ratio | Bg Ratio | pvalue | p.adjust | Count |
| Page: 1 |
| Pathway ID | Tissue | Disease Stage | Description | Gene Ratio | Bg Ratio | pvalue | p.adjust | qvalue | Count |
| Page: 1 |
Top |
Cell-cell communication analysis |
| Identification of potential cell-cell interactions between two cell types and their ligand-receptor pairs for different disease states |
| Ligand | Receptor | LRpair | Pathway | Tissue | Disease Stage |
| Page: 1 |
Top |
Single-cell gene regulatory network inference analysis |
| Find out the significant the regulons (TFs) and the target genes of each regulon across cell types for different disease states |
| TF | Cell Type | Tissue | Disease Stage | Target Gene | RSS | Regulon Activity |
| ∗The dot plots of a searched regulon are shown for all cell subpopulations in each disease state of each tissue based on the regulon specific score inferred using pySCENIC and by calculating the average expression. |
| Page: 1 |
Top |
Somatic mutation of malignant transformation related genes |
| Annotation of somatic variants for genes involved in malignant transformation |
| Hugo Symbol | Variant Class | Variant Classification | dbSNP RS | HGVSc | HGVSp | HGVSp Short | SWISSPROT | BIOTYPE | SIFT | PolyPhen | Tumor Sample Barcode | Tissue | Histology | Sex | Age | Stage | Therapy Types | Drugs | Outcome |
| TMEM248 | SNV | Missense_Mutation | c.274G>T | p.Gly92Trp | p.G92W | Q9NWD8 | protein_coding | deleterious(0.03) | possibly_damaging(0.878) | TCGA-E8-A2EA-01 | Thyroid | thyroid carcinoma | Female | <65 | I/II | Unknown | Unknown | SD |
| Page: 1 2 3 4 |
Top |
Related drugs of malignant transformation related genes |
| Identification of chemicals and drugs interact with genes involved in malignant transfromation |
| (DGIdb 4.0) |
| Entrez ID | Symbol | Category | Interaction Types | Drug Claim Name | Drug Name | PMIDs |
| Page: 1 |

Copyright 2023-Present -The University of Texas Health Science Center at Houston |