
|
|||||
|
 | |
| |
| |
| |
| |
| |
|
Gene: SPSB3 |
Gene summary for SPSB3 |
| Gene information | Species | Human | Gene symbol | SPSB3 | Gene ID | 90864 |
| Gene name | splA/ryanodine receptor domain and SOCS box containing 3 | |
| Gene Alias | C16orf31 | |
| Cytomap | 16p13.3 | |
| Gene Type | protein-coding | GO ID | GO:0006464 | UniProtAcc | Q6PJ21 |
Top |
Malignant transformation analysis |
| Identification of the aberrant gene expression in precancerous and cancerous lesions by comparing the gene expression of stem-like cells in diseased tissues with normal stem cells |
| Entrez ID | Symbol | Replicates | Species | Organ | Tissue | Adj P-value | Log2FC | Malignancy |
| 90864 | SPSB3 | LZE4T | Human | Esophagus | ESCC | 8.90e-17 | 3.34e-01 | 0.0811 |
| 90864 | SPSB3 | LZE7T | Human | Esophagus | ESCC | 2.13e-18 | 1.12e+00 | 0.0667 |
| 90864 | SPSB3 | LZE8T | Human | Esophagus | ESCC | 1.90e-14 | 4.21e-01 | 0.067 |
| 90864 | SPSB3 | LZE20T | Human | Esophagus | ESCC | 5.90e-14 | 5.55e-01 | 0.0662 |
| 90864 | SPSB3 | LZE22D1 | Human | Esophagus | HGIN | 3.44e-06 | 5.94e-01 | 0.0595 |
| 90864 | SPSB3 | LZE22T | Human | Esophagus | ESCC | 1.09e-04 | 7.57e-01 | 0.068 |
| 90864 | SPSB3 | LZE24T | Human | Esophagus | ESCC | 5.48e-35 | 1.14e+00 | 0.0596 |
| 90864 | SPSB3 | LZE21T | Human | Esophagus | ESCC | 3.25e-04 | 3.94e-01 | 0.0655 |
| 90864 | SPSB3 | LZE6T | Human | Esophagus | ESCC | 1.59e-07 | 2.79e-01 | 0.0845 |
| 90864 | SPSB3 | P1T-E | Human | Esophagus | ESCC | 8.74e-25 | 1.21e+00 | 0.0875 |
| 90864 | SPSB3 | P2T-E | Human | Esophagus | ESCC | 1.07e-66 | 1.20e+00 | 0.1177 |
| 90864 | SPSB3 | P4T-E | Human | Esophagus | ESCC | 4.60e-35 | 8.79e-01 | 0.1323 |
| 90864 | SPSB3 | P5T-E | Human | Esophagus | ESCC | 3.58e-18 | 3.05e-01 | 0.1327 |
| 90864 | SPSB3 | P8T-E | Human | Esophagus | ESCC | 6.68e-53 | 9.60e-01 | 0.0889 |
| 90864 | SPSB3 | P9T-E | Human | Esophagus | ESCC | 8.73e-14 | 3.80e-01 | 0.1131 |
| 90864 | SPSB3 | P10T-E | Human | Esophagus | ESCC | 1.97e-34 | 6.91e-01 | 0.116 |
| 90864 | SPSB3 | P11T-E | Human | Esophagus | ESCC | 5.16e-25 | 9.67e-01 | 0.1426 |
| 90864 | SPSB3 | P12T-E | Human | Esophagus | ESCC | 1.37e-59 | 1.26e+00 | 0.1122 |
| 90864 | SPSB3 | P15T-E | Human | Esophagus | ESCC | 2.88e-38 | 8.47e-01 | 0.1149 |
| 90864 | SPSB3 | P16T-E | Human | Esophagus | ESCC | 5.25e-28 | 5.55e-01 | 0.1153 |
| Page: 1 2 3 4 5 6 7 |
| Tissue | Expression Dynamics | Abbreviation |
| Esophagus |  | ESCC: Esophageal squamous cell carcinoma |
| HGIN: High-grade intraepithelial neoplasias | ||
| LGIN: Low-grade intraepithelial neoplasias | ||
| Liver | 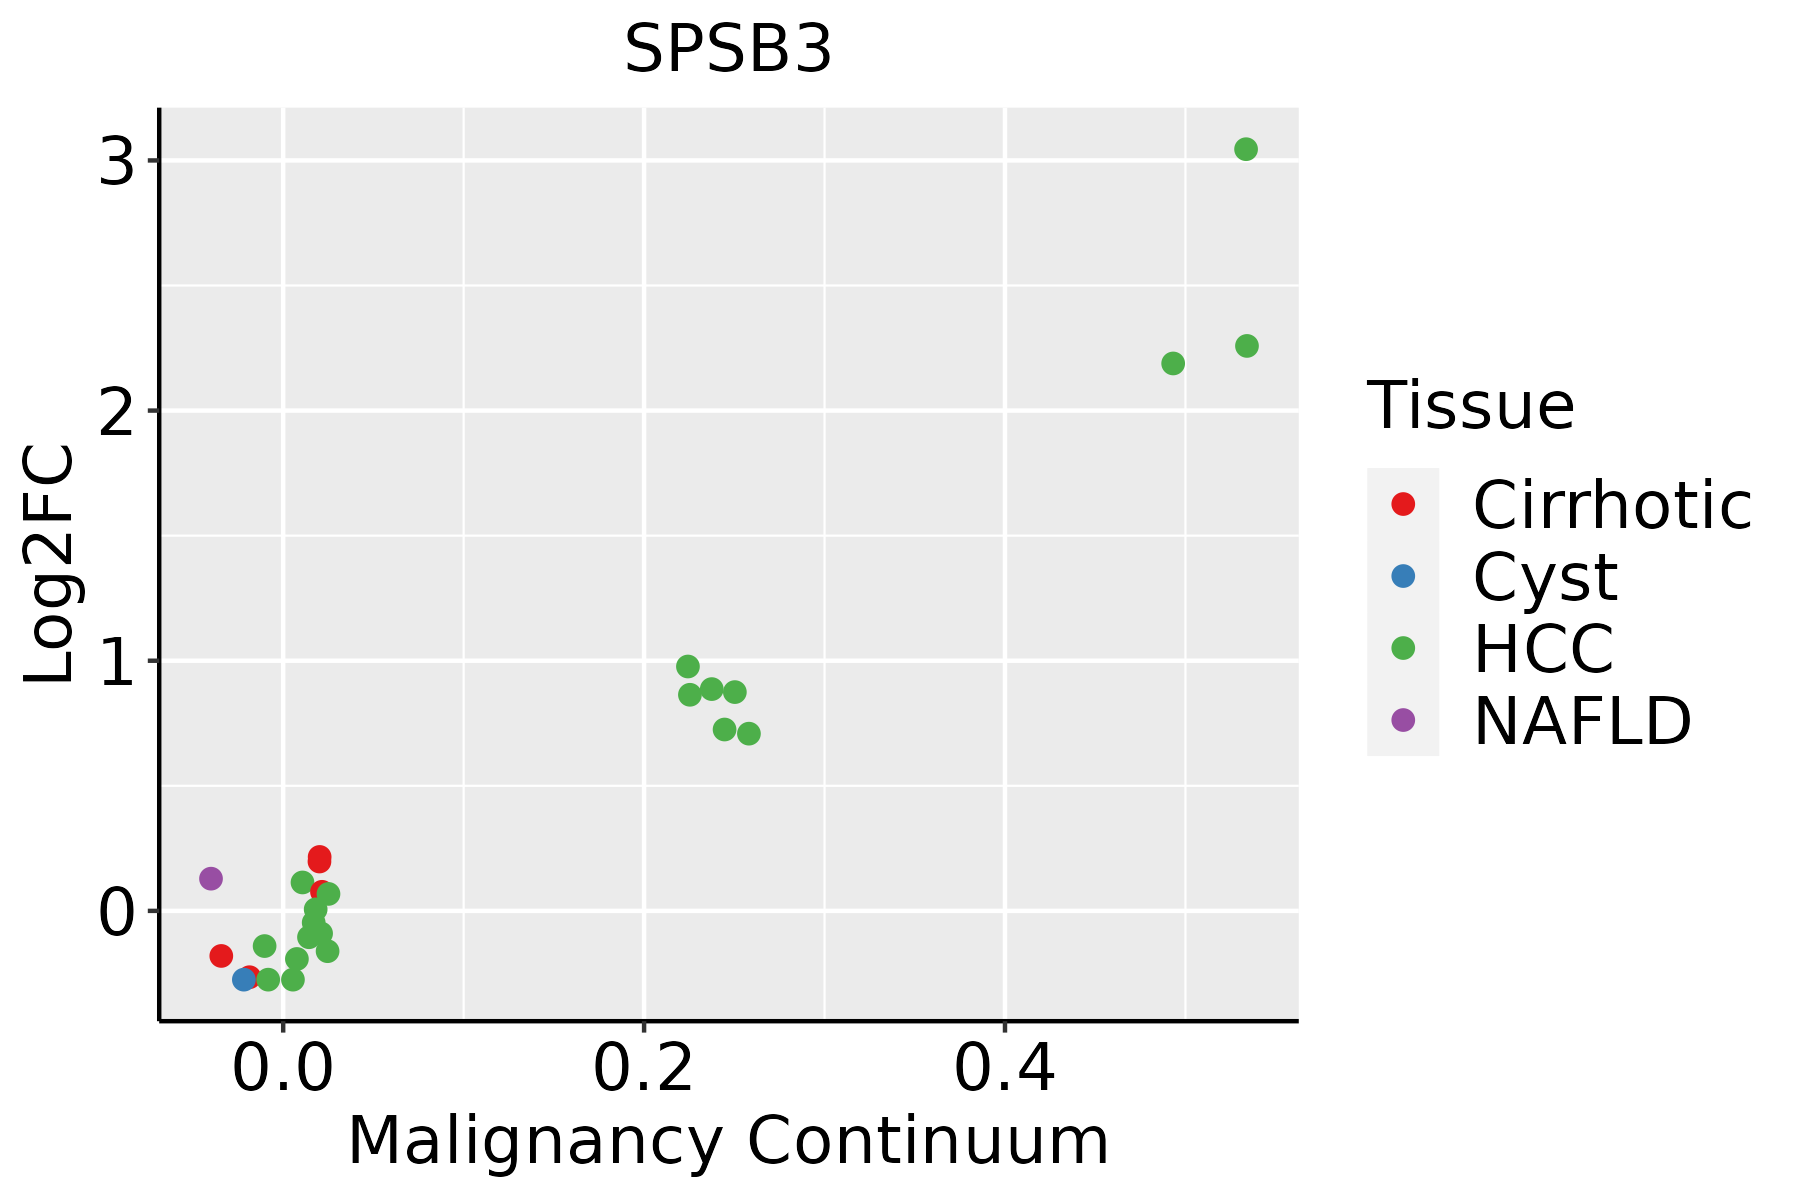 | HCC: Hepatocellular carcinoma |
| NAFLD: Non-alcoholic fatty liver disease | ||
| Oral Cavity | 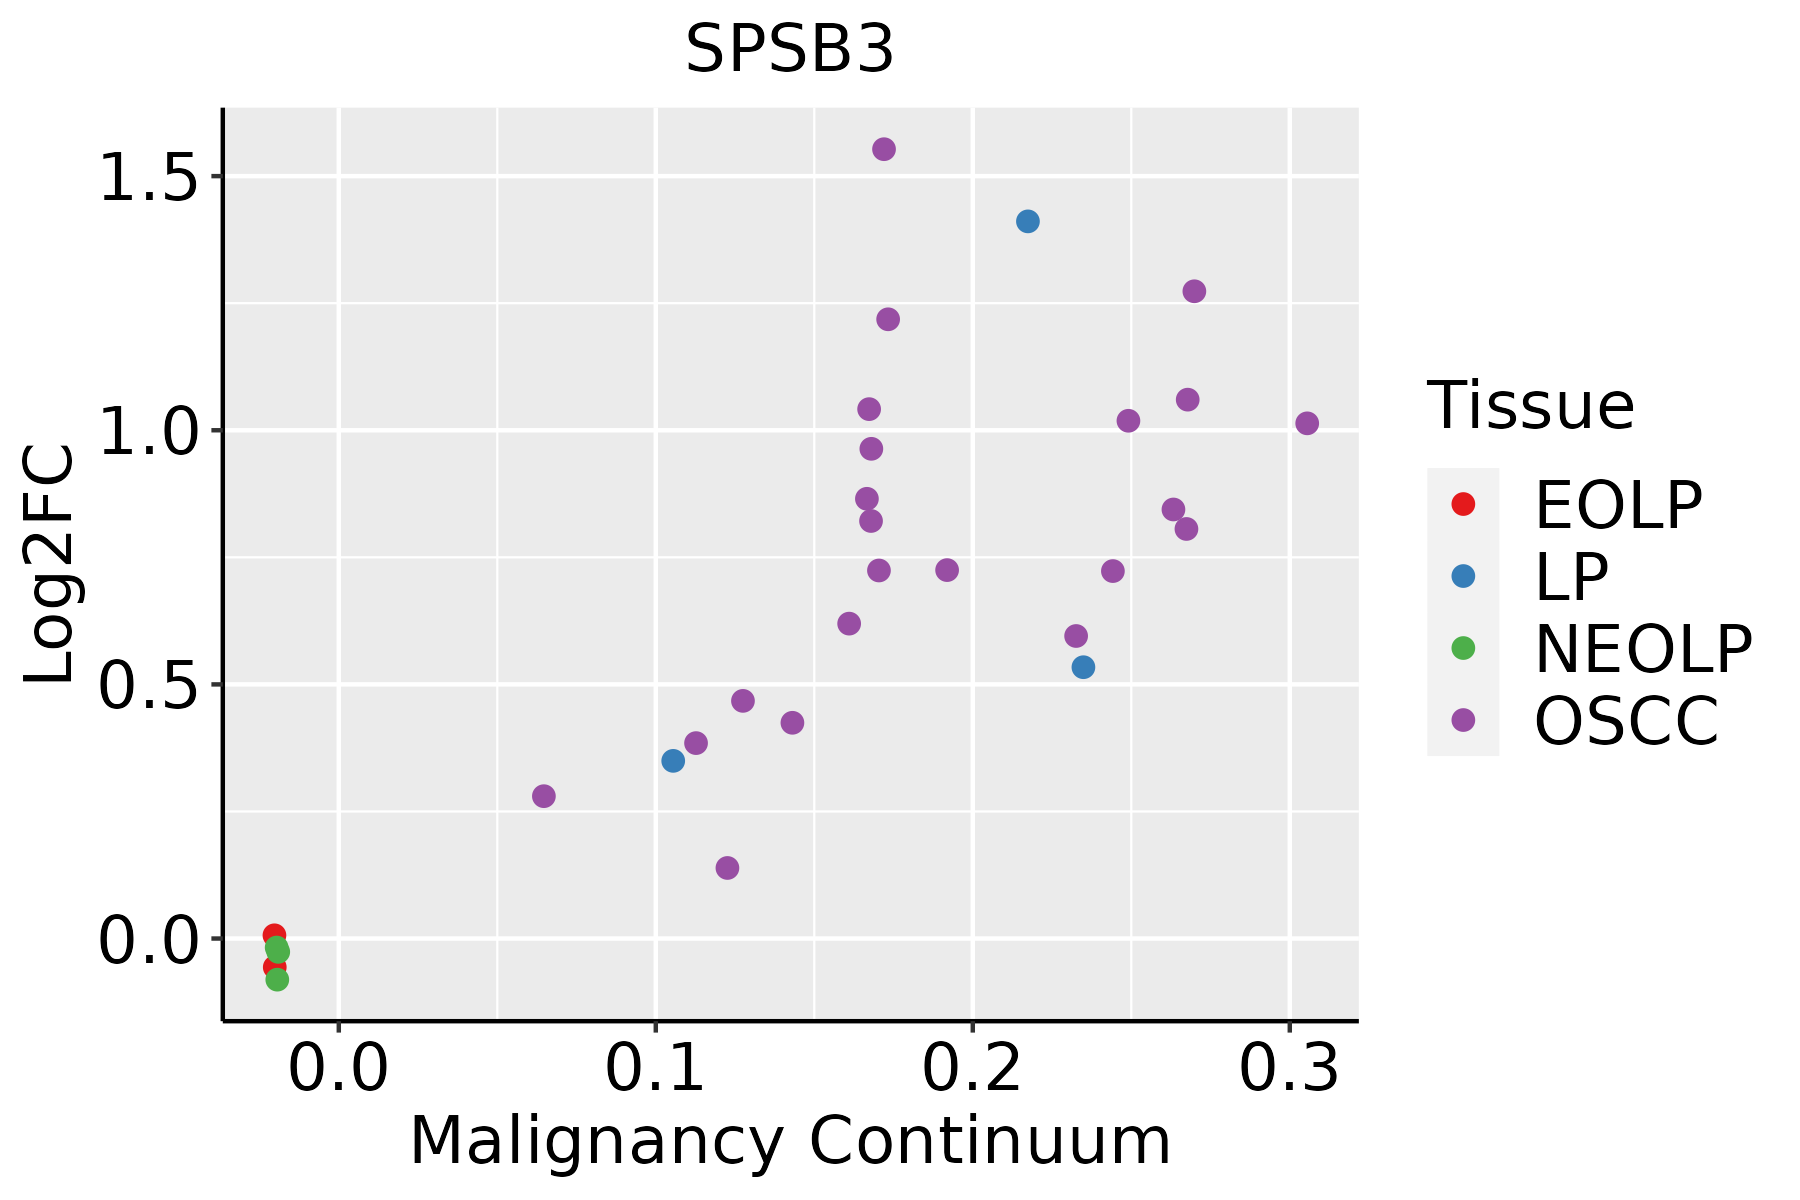 | EOLP: Erosive Oral lichen planus |
| LP: leukoplakia | ||
| NEOLP: Non-erosive oral lichen planus | ||
| OSCC: Oral squamous cell carcinoma | ||
| Skin | 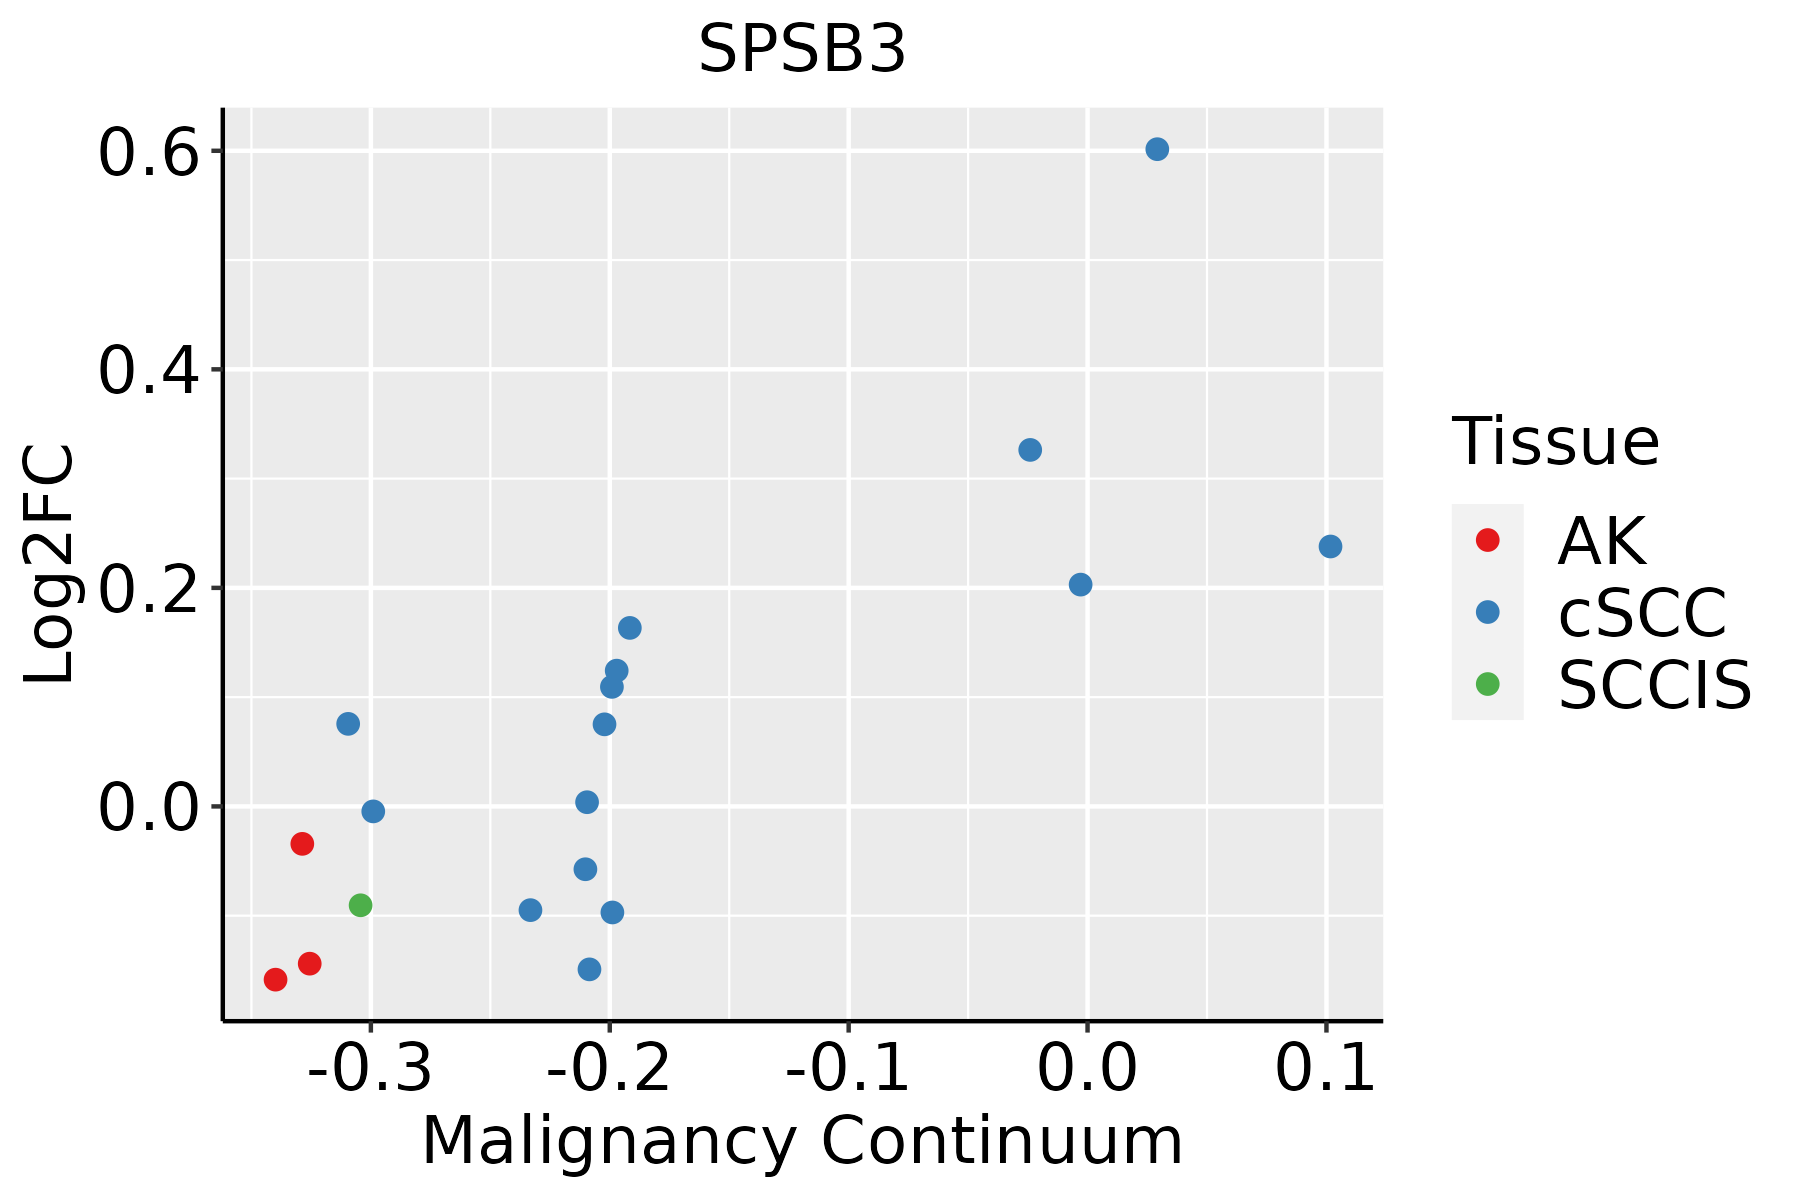 | AK: Actinic keratosis |
| cSCC: Cutaneous squamous cell carcinoma | ||
| SCCIS:squamous cell carcinoma in situ | ||
| Thyroid | 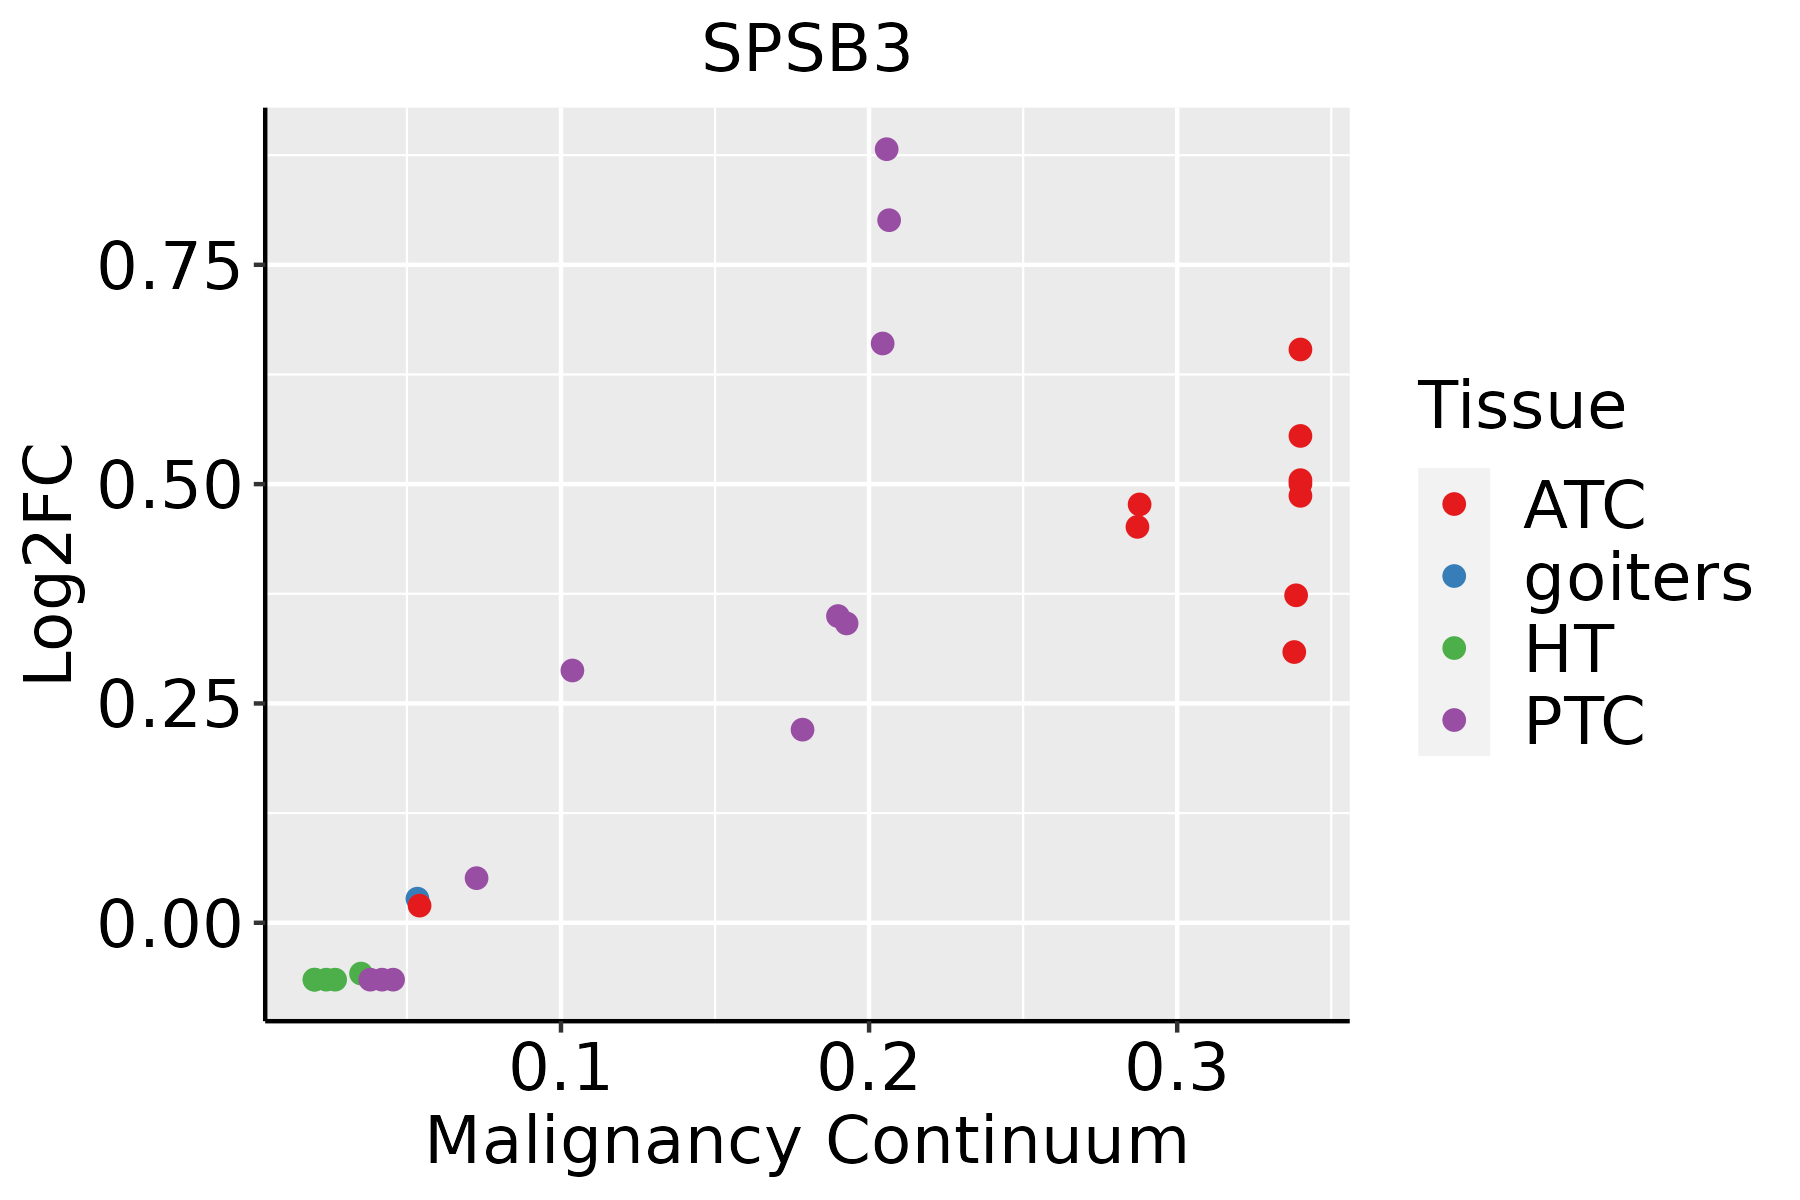 | ATC: Anaplastic thyroid cancer |
| HT: Hashimoto's thyroiditis | ||
| PTC: Papillary thyroid cancer |
| ∗log2FC in expression of this searched gene in stem-like cells from each diseased tissue sample relative to stem-like cells in normal samples in each tissue plotted against the malignancy continuum. Samples are colored based on if they are from different disease stage. |
Top |
Malignant transformation related pathway analysis |
| Find out the enriched GO biological processes and KEGG pathways involved in transition from healthy to precancer to cancer |
| Tissue | Disease Stage | Enriched GO biological Processes |
| Colorectum | AD |  |
| Colorectum | SER |  |
| Colorectum | MSS |  |
| Colorectum | MSI-H |  |
| Colorectum | FAP |  |
| ∗Top 15 enriched GO BP terms are showed in the bar plot of each disease state in each tissue. Each row represents a significant GO biological process which is colored according to the -log10(p.adjust). |
| Page: 1 2 3 4 5 6 7 8 9 |
| GO ID | Tissue | Disease Stage | Description | Gene Ratio | Bg Ratio | pvalue | p.adjust | Count |
| GO:001049826 | Esophagus | HGIN | proteasomal protein catabolic process | 139/2587 | 490/18723 | 1.20e-17 | 3.41e-15 | 139 |
| GO:004316126 | Esophagus | HGIN | proteasome-mediated ubiquitin-dependent protein catabolic process | 114/2587 | 412/18723 | 7.00e-14 | 1.20e-11 | 114 |
| GO:0010498111 | Esophagus | ESCC | proteasomal protein catabolic process | 369/8552 | 490/18723 | 1.13e-41 | 1.80e-38 | 369 |
| GO:0043161111 | Esophagus | ESCC | proteasome-mediated ubiquitin-dependent protein catabolic process | 312/8552 | 412/18723 | 3.53e-36 | 4.48e-33 | 312 |
| GO:001049812 | Liver | Cirrhotic | proteasomal protein catabolic process | 216/4634 | 490/18723 | 2.52e-21 | 9.29e-19 | 216 |
| GO:004316112 | Liver | Cirrhotic | proteasome-mediated ubiquitin-dependent protein catabolic process | 184/4634 | 412/18723 | 4.52e-19 | 8.85e-17 | 184 |
| GO:001049822 | Liver | HCC | proteasomal protein catabolic process | 351/7958 | 490/18723 | 6.92e-40 | 1.46e-36 | 351 |
| GO:004316122 | Liver | HCC | proteasome-mediated ubiquitin-dependent protein catabolic process | 299/7958 | 412/18723 | 7.82e-36 | 8.27e-33 | 299 |
| GO:001049820 | Oral cavity | OSCC | proteasomal protein catabolic process | 336/7305 | 490/18723 | 5.45e-41 | 8.63e-38 | 336 |
| GO:004316120 | Oral cavity | OSCC | proteasome-mediated ubiquitin-dependent protein catabolic process | 285/7305 | 412/18723 | 5.68e-36 | 5.99e-33 | 285 |
| GO:0010498110 | Oral cavity | LP | proteasomal protein catabolic process | 224/4623 | 490/18723 | 9.57e-25 | 4.00e-22 | 224 |
| GO:0043161110 | Oral cavity | LP | proteasome-mediated ubiquitin-dependent protein catabolic process | 190/4623 | 412/18723 | 1.08e-21 | 2.93e-19 | 190 |
| GO:001049828 | Skin | cSCC | proteasomal protein catabolic process | 243/4864 | 490/18723 | 7.85e-30 | 4.10e-27 | 243 |
| GO:004316128 | Skin | cSCC | proteasome-mediated ubiquitin-dependent protein catabolic process | 205/4864 | 412/18723 | 1.46e-25 | 4.16e-23 | 205 |
| GO:0010498113 | Thyroid | PTC | proteasomal protein catabolic process | 297/5968 | 490/18723 | 4.58e-40 | 9.63e-37 | 297 |
| GO:0043161113 | Thyroid | PTC | proteasome-mediated ubiquitin-dependent protein catabolic process | 254/5968 | 412/18723 | 3.91e-36 | 4.54e-33 | 254 |
| GO:001049832 | Thyroid | ATC | proteasomal protein catabolic process | 309/6293 | 490/18723 | 1.78e-41 | 1.13e-37 | 309 |
| GO:0043161210 | Thyroid | ATC | proteasome-mediated ubiquitin-dependent protein catabolic process | 265/6293 | 412/18723 | 7.09e-38 | 1.49e-34 | 265 |
| Page: 1 |
| Pathway ID | Tissue | Disease Stage | Description | Gene Ratio | Bg Ratio | pvalue | p.adjust | qvalue | Count |
| Page: 1 |
Top |
Cell-cell communication analysis |
| Identification of potential cell-cell interactions between two cell types and their ligand-receptor pairs for different disease states |
| Ligand | Receptor | LRpair | Pathway | Tissue | Disease Stage |
| Page: 1 |
Top |
Single-cell gene regulatory network inference analysis |
| Find out the significant the regulons (TFs) and the target genes of each regulon across cell types for different disease states |
| TF | Cell Type | Tissue | Disease Stage | Target Gene | RSS | Regulon Activity |
| ∗The dot plots of a searched regulon are shown for all cell subpopulations in each disease state of each tissue based on the regulon specific score inferred using pySCENIC and by calculating the average expression. |
| Page: 1 |
Top |
Somatic mutation of malignant transformation related genes |
| Annotation of somatic variants for genes involved in malignant transformation |
| Hugo Symbol | Variant Class | Variant Classification | dbSNP RS | HGVSc | HGVSp | HGVSp Short | SWISSPROT | BIOTYPE | SIFT | PolyPhen | Tumor Sample Barcode | Tissue | Histology | Sex | Age | Stage | Therapy Types | Drugs | Outcome |
| SPSB3 | SNV | Missense_Mutation | rs753647877 | c.112N>A | p.Asp38Asn | p.D38N | Q6PJ21 | protein_coding | tolerated_low_confidence(0.08) | probably_damaging(0.996) | TCGA-VQ-A8P2-01 | Stomach | stomach adenocarcinoma | Male | >=65 | III/IV | Unspecific | Complete Response | |
| SPSB3 | deletion | Frame_Shift_Del | c.440delN | p.Gly147AlafsTer9 | p.G147Afs*9 | Q6PJ21 | protein_coding | TCGA-HU-A4GT-01 | Stomach | stomach adenocarcinoma | Female | >=65 | I/II | Chemotherapy | copolang | SD |
| Page: 1 2 3 4 |
Top |
Related drugs of malignant transformation related genes |
| Identification of chemicals and drugs interact with genes involved in malignant transfromation |
| (DGIdb 4.0) |
| Entrez ID | Symbol | Category | Interaction Types | Drug Claim Name | Drug Name | PMIDs |
| Page: 1 |

Copyright 2023-Present -The University of Texas Health Science Center at Houston |