
|
|||||
|
 | |
| |
| |
| |
| |
| |
|
Gene: SLC25A21 |
Gene summary for SLC25A21 |
| Gene information | Species | Human | Gene symbol | SLC25A21 | Gene ID | 89874 |
| Gene name | solute carrier family 25 member 21 | |
| Gene Alias | MTDPS18 | |
| Cytomap | 14q13.3 | |
| Gene Type | protein-coding | GO ID | GO:0006082 | UniProtAcc | Q9BQT8 |
Top |
Malignant transformation analysis |
| Identification of the aberrant gene expression in precancerous and cancerous lesions by comparing the gene expression of stem-like cells in diseased tissues with normal stem cells |
| Entrez ID | Symbol | Replicates | Species | Organ | Tissue | Adj P-value | Log2FC | Malignancy |
| 89874 | SLC25A21 | RNA-P17T-P17T-2 | Human | Lung | IAC | 6.80e-05 | 6.76e-01 | 0.3371 |
| 89874 | SLC25A21 | RNA-P17T-P17T-4 | Human | Lung | IAC | 1.13e-06 | 7.77e-01 | 0.343 |
| 89874 | SLC25A21 | RNA-P17T-P17T-6 | Human | Lung | IAC | 1.13e-06 | 6.00e-01 | 0.3385 |
| 89874 | SLC25A21 | RNA-P17T-P17T-8 | Human | Lung | IAC | 5.44e-06 | 6.23e-01 | 0.3329 |
| 89874 | SLC25A21 | RNA-P25T1-P25T1-4 | Human | Lung | AIS | 3.15e-03 | 3.05e-01 | -0.2119 |
| Page: 1 |
| Tissue | Expression Dynamics | Abbreviation |
| Lung | 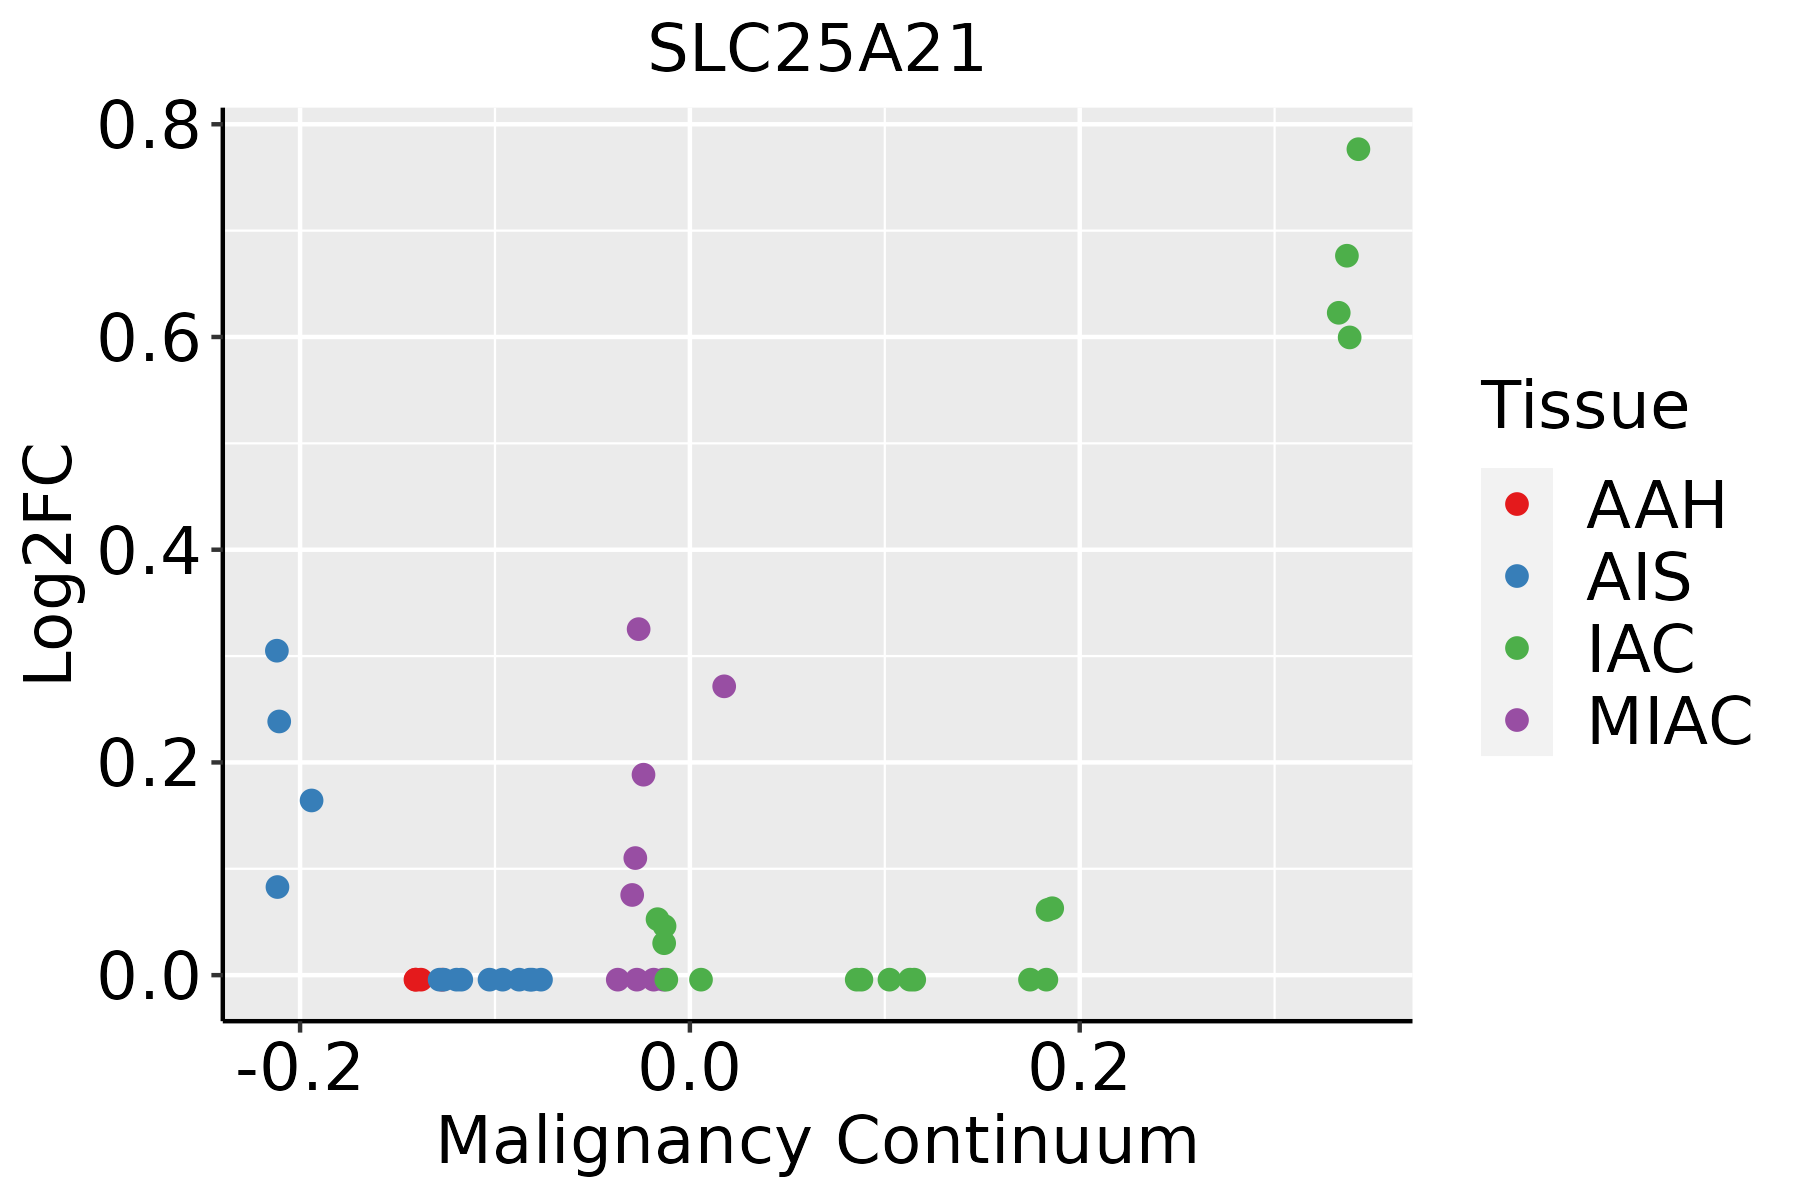 | AAH: Atypical adenomatous hyperplasia |
| AIS: Adenocarcinoma in situ | ||
| IAC: Invasive lung adenocarcinoma | ||
| MIA: Minimally invasive adenocarcinoma |
| ∗log2FC in expression of this searched gene in stem-like cells from each diseased tissue sample relative to stem-like cells in normal samples in each tissue plotted against the malignancy continuum. Samples are colored based on if they are from different disease stage. |
Top |
Malignant transformation related pathway analysis |
| Find out the enriched GO biological processes and KEGG pathways involved in transition from healthy to precancer to cancer |
| Tissue | Disease Stage | Enriched GO biological Processes |
| Colorectum | AD |  |
| Colorectum | SER |  |
| Colorectum | MSS |  |
| Colorectum | MSI-H |  |
| Colorectum | FAP |  |
| ∗Top 15 enriched GO BP terms are showed in the bar plot of each disease state in each tissue. Each row represents a significant GO biological process which is colored according to the -log10(p.adjust). |
| Page: 1 2 3 4 5 6 7 8 9 |
| GO ID | Tissue | Disease Stage | Description | Gene Ratio | Bg Ratio | pvalue | p.adjust | Count |
| GO:19905426 | Lung | IAC | mitochondrial transmembrane transport | 21/2061 | 102/18723 | 3.34e-03 | 2.86e-02 | 21 |
| GO:199054213 | Lung | AIS | mitochondrial transmembrane transport | 20/1849 | 102/18723 | 2.12e-03 | 2.30e-02 | 20 |
| Page: 1 |
| Pathway ID | Tissue | Disease Stage | Description | Gene Ratio | Bg Ratio | pvalue | p.adjust | qvalue | Count |
| Page: 1 |
Top |
Cell-cell communication analysis |
| Identification of potential cell-cell interactions between two cell types and their ligand-receptor pairs for different disease states |
| Ligand | Receptor | LRpair | Pathway | Tissue | Disease Stage |
| Page: 1 |
Top |
Single-cell gene regulatory network inference analysis |
| Find out the significant the regulons (TFs) and the target genes of each regulon across cell types for different disease states |
| TF | Cell Type | Tissue | Disease Stage | Target Gene | RSS | Regulon Activity |
| ∗The dot plots of a searched regulon are shown for all cell subpopulations in each disease state of each tissue based on the regulon specific score inferred using pySCENIC and by calculating the average expression. |
| Page: 1 |
Top |
Somatic mutation of malignant transformation related genes |
| Annotation of somatic variants for genes involved in malignant transformation |
| Hugo Symbol | Variant Class | Variant Classification | dbSNP RS | HGVSc | HGVSp | HGVSp Short | SWISSPROT | BIOTYPE | SIFT | PolyPhen | Tumor Sample Barcode | Tissue | Histology | Sex | Age | Stage | Therapy Types | Drugs | Outcome |
| SLC25A21 | SNV | Missense_Mutation | novel | c.523N>G | p.Thr175Ala | p.T175A | Q9BQT8 | protein_coding | deleterious(0.01) | probably_damaging(0.995) | TCGA-RD-A7C1-01 | Stomach | stomach adenocarcinoma | Male | >=65 | I/II | Unknown | Unknown | PD |
| SLC25A21 | SNV | Missense_Mutation | novel | c.736A>G | p.Lys246Glu | p.K246E | Q9BQT8 | protein_coding | deleterious(0.01) | probably_damaging(0.991) | TCGA-VQ-A91D-01 | Stomach | stomach adenocarcinoma | Male | >=65 | III/IV | Chemotherapy | fluorouracil | PD |
| Page: 1 2 3 4 |
Top |
Related drugs of malignant transformation related genes |
| Identification of chemicals and drugs interact with genes involved in malignant transfromation |
| (DGIdb 4.0) |
| Entrez ID | Symbol | Category | Interaction Types | Drug Claim Name | Drug Name | PMIDs |
| Page: 1 |

Copyright 2023-Present -The University of Texas Health Science Center at Houston |