
|
|||||
|
 | |
| |
| |
| |
| |
| |
|
Gene: SEMA3B |
Gene summary for SEMA3B |
| Gene information | Species | Human | Gene symbol | SEMA3B | Gene ID | 7869 |
| Gene name | semaphorin 3B | |
| Gene Alias | LUCA-1 | |
| Cytomap | 3p21.31 | |
| Gene Type | protein-coding | GO ID | GO:0000902 | UniProtAcc | Q13214 |
Top |
Malignant transformation analysis |
| Identification of the aberrant gene expression in precancerous and cancerous lesions by comparing the gene expression of stem-like cells in diseased tissues with normal stem cells |
| Entrez ID | Symbol | Replicates | Species | Organ | Tissue | Adj P-value | Log2FC | Malignancy |
| 7869 | SEMA3B | P2T-E | Human | Esophagus | ESCC | 3.63e-05 | 1.24e-01 | 0.1177 |
| 7869 | SEMA3B | P5T-E | Human | Esophagus | ESCC | 1.99e-03 | -3.48e-03 | 0.1327 |
| 7869 | SEMA3B | P8T-E | Human | Esophagus | ESCC | 4.61e-05 | 2.42e-01 | 0.0889 |
| 7869 | SEMA3B | P10T-E | Human | Esophagus | ESCC | 7.14e-14 | 2.30e-01 | 0.116 |
| 7869 | SEMA3B | P11T-E | Human | Esophagus | ESCC | 5.41e-17 | 2.02e+00 | 0.1426 |
| 7869 | SEMA3B | P12T-E | Human | Esophagus | ESCC | 1.18e-09 | 3.42e-01 | 0.1122 |
| 7869 | SEMA3B | P16T-E | Human | Esophagus | ESCC | 1.22e-65 | 2.04e+00 | 0.1153 |
| 7869 | SEMA3B | P19T-E | Human | Esophagus | ESCC | 9.06e-11 | 2.50e+00 | 0.1662 |
| 7869 | SEMA3B | P22T-E | Human | Esophagus | ESCC | 2.83e-10 | 8.15e-02 | 0.1236 |
| 7869 | SEMA3B | P24T-E | Human | Esophagus | ESCC | 2.22e-03 | 8.58e-01 | 0.1287 |
| 7869 | SEMA3B | P26T-E | Human | Esophagus | ESCC | 3.16e-20 | 3.79e-01 | 0.1276 |
| 7869 | SEMA3B | P27T-E | Human | Esophagus | ESCC | 2.89e-10 | 3.28e-02 | 0.1055 |
| 7869 | SEMA3B | P28T-E | Human | Esophagus | ESCC | 1.78e-02 | 1.26e-02 | 0.1149 |
| 7869 | SEMA3B | P31T-E | Human | Esophagus | ESCC | 1.55e-06 | 1.43e-01 | 0.1251 |
| 7869 | SEMA3B | P32T-E | Human | Esophagus | ESCC | 2.76e-06 | 1.28e+00 | 0.1666 |
| 7869 | SEMA3B | P37T-E | Human | Esophagus | ESCC | 1.29e-06 | 3.78e-01 | 0.1371 |
| 7869 | SEMA3B | P44T-E | Human | Esophagus | ESCC | 3.63e-07 | 5.51e-01 | 0.1096 |
| 7869 | SEMA3B | P48T-E | Human | Esophagus | ESCC | 3.41e-04 | 1.18e-01 | 0.0959 |
| 7869 | SEMA3B | P56T-E | Human | Esophagus | ESCC | 1.09e-05 | 2.27e+00 | 0.1613 |
| 7869 | SEMA3B | P57T-E | Human | Esophagus | ESCC | 9.52e-20 | 4.95e-01 | 0.0926 |
| Page: 1 2 3 4 |
| Tissue | Expression Dynamics | Abbreviation |
| Esophagus | 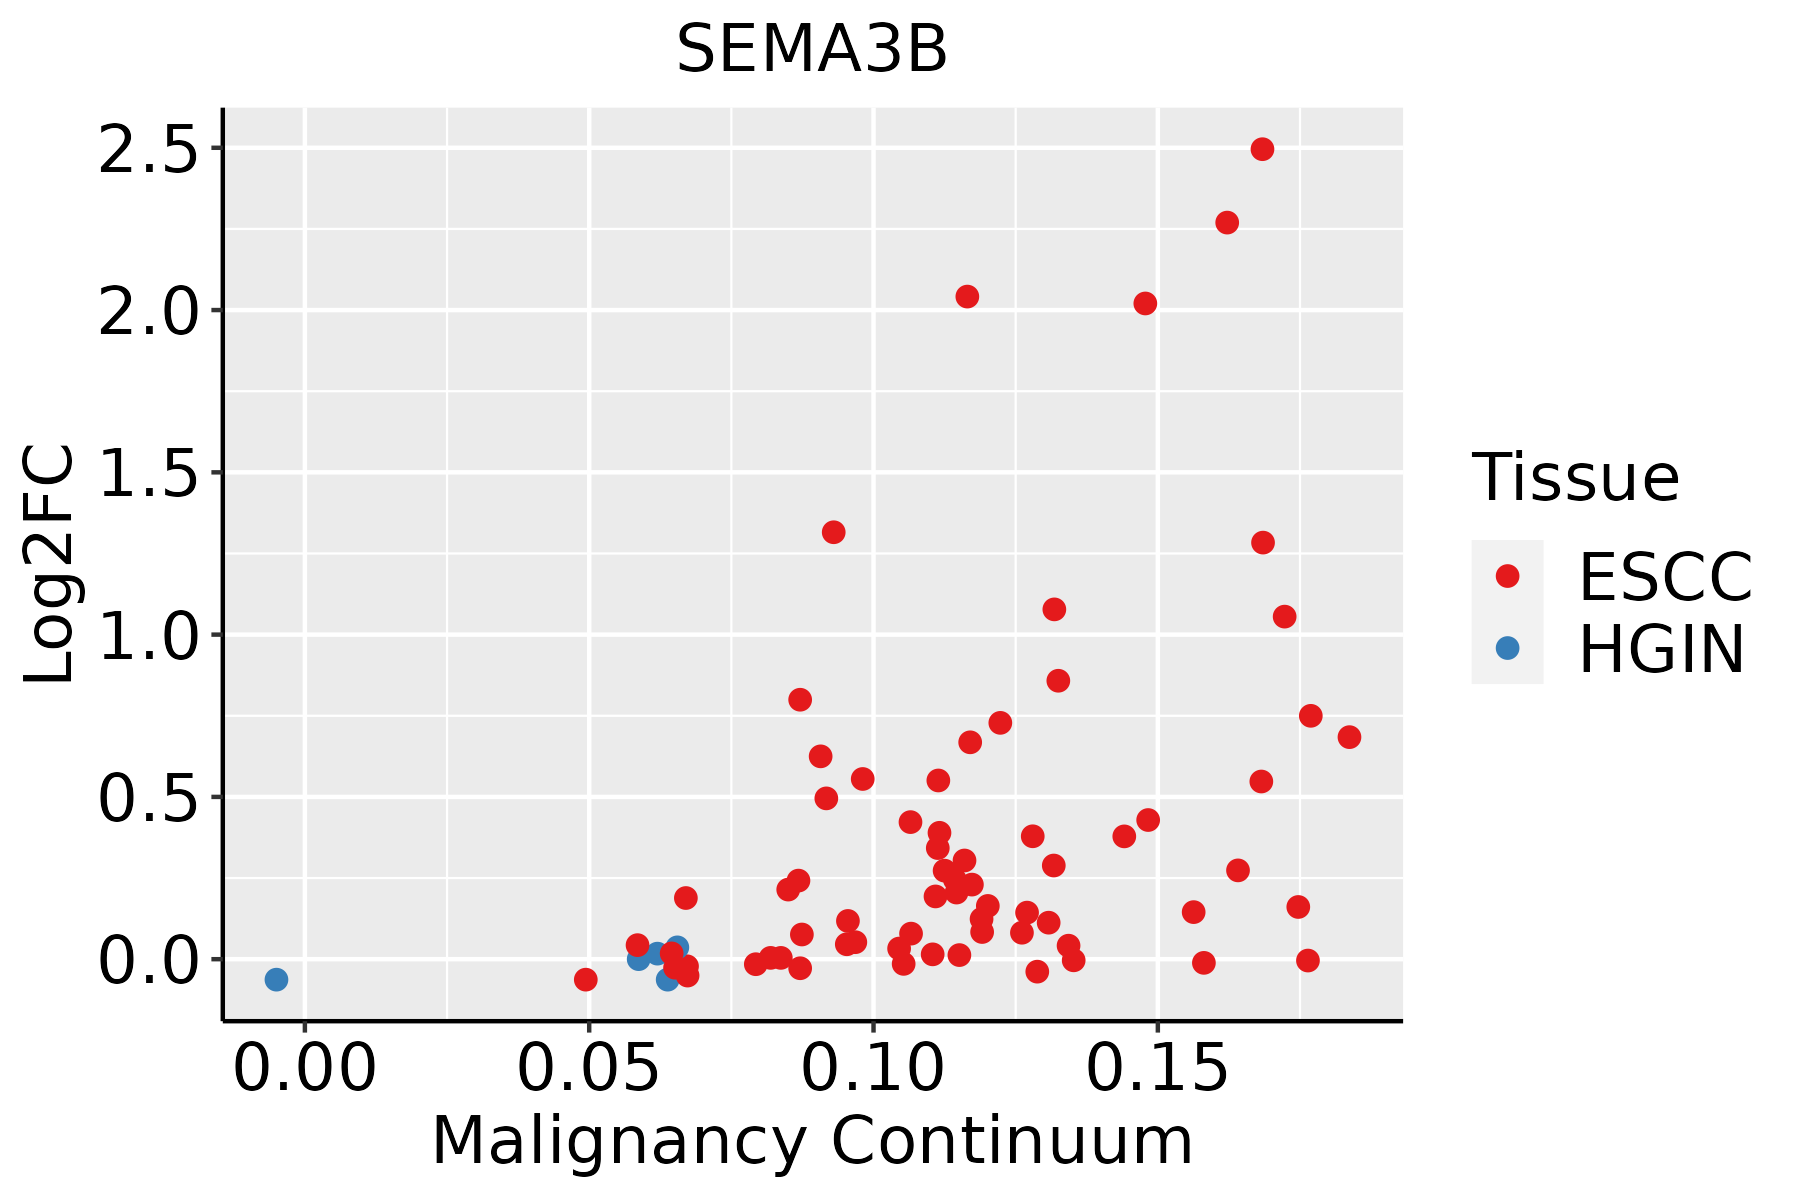 | ESCC: Esophageal squamous cell carcinoma |
| HGIN: High-grade intraepithelial neoplasias | ||
| LGIN: Low-grade intraepithelial neoplasias | ||
| GC | 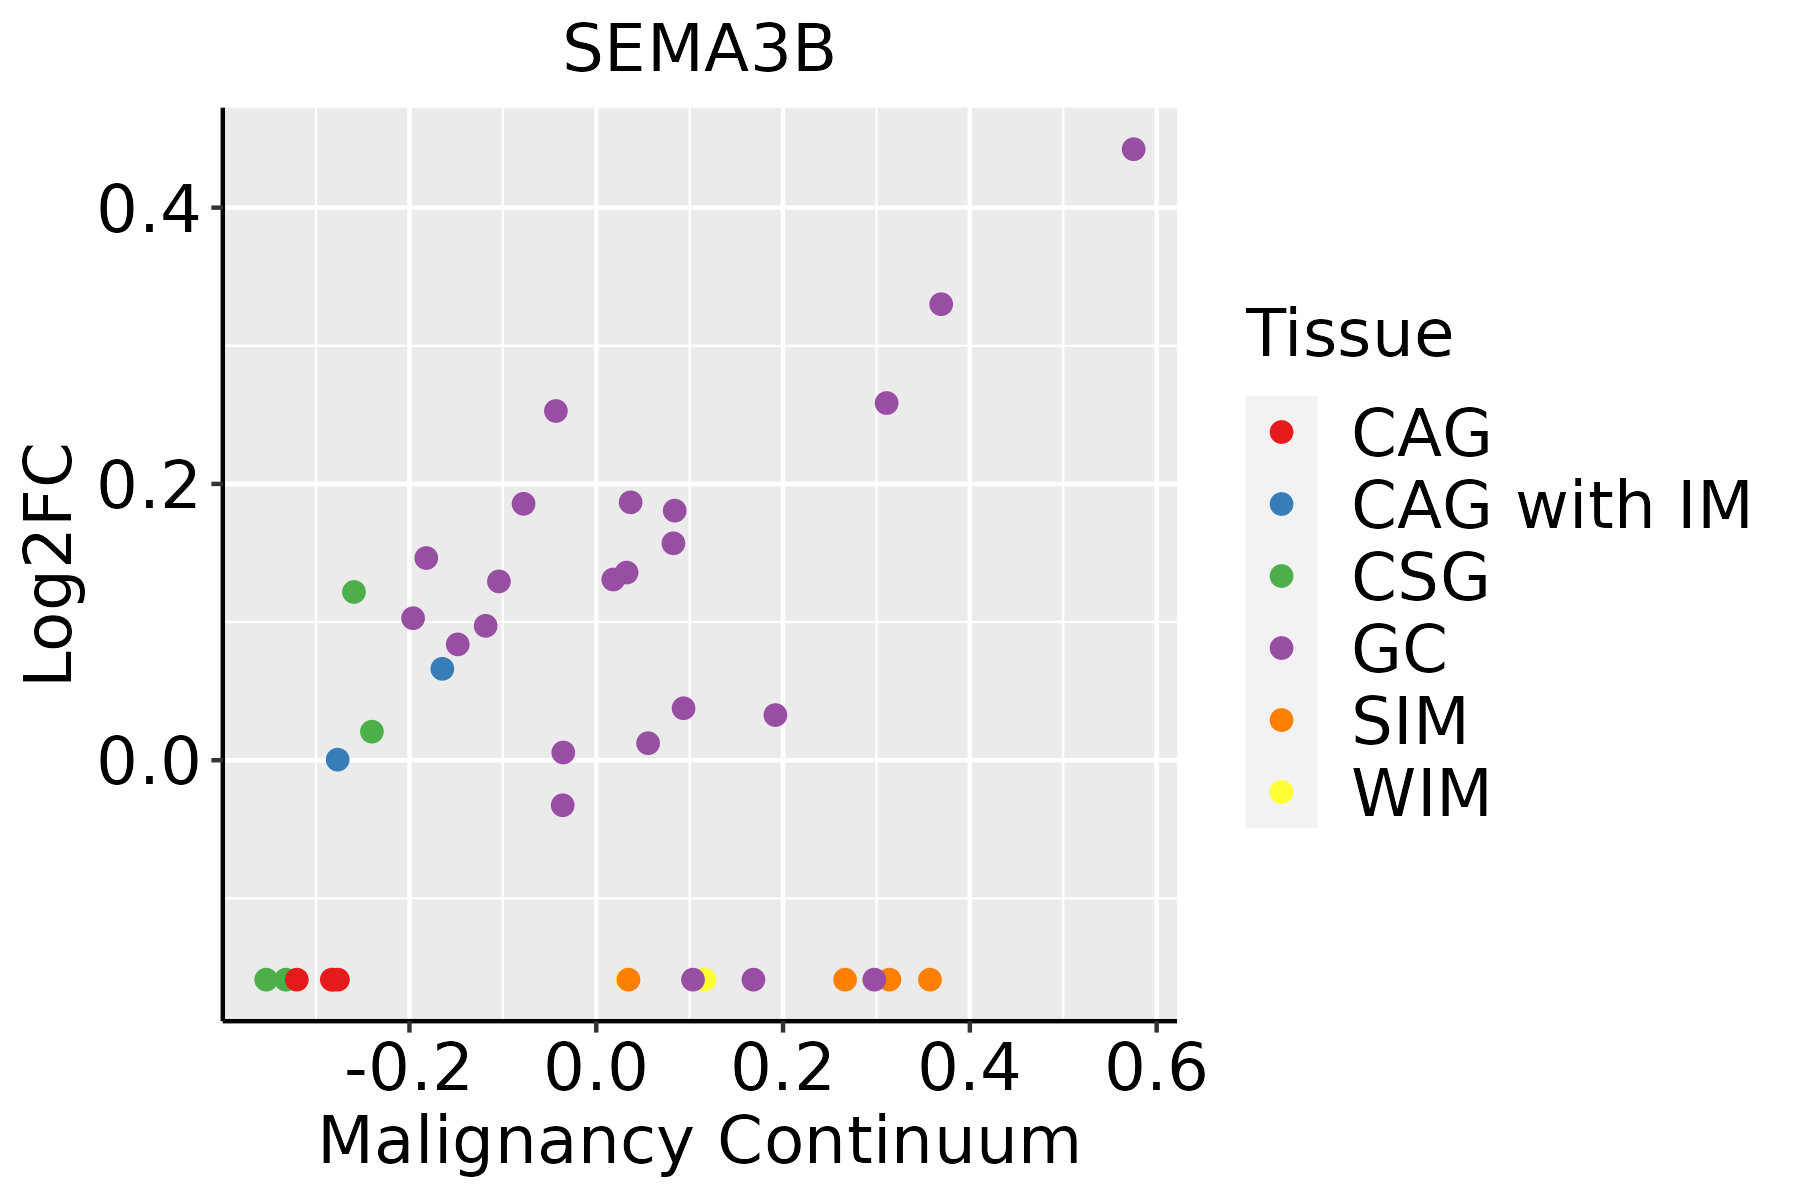 | CAG: Chronic atrophic gastritis |
| CAG with IM: Chronic atrophic gastritis with intestinal metaplasia | ||
| CSG: Chronic superficial gastritis | ||
| GC: Gastric cancer | ||
| SIM: Severe intestinal metaplasia | ||
| WIM: Wild intestinal metaplasia | ||
| Liver |  | HCC: Hepatocellular carcinoma |
| NAFLD: Non-alcoholic fatty liver disease | ||
| Thyroid | 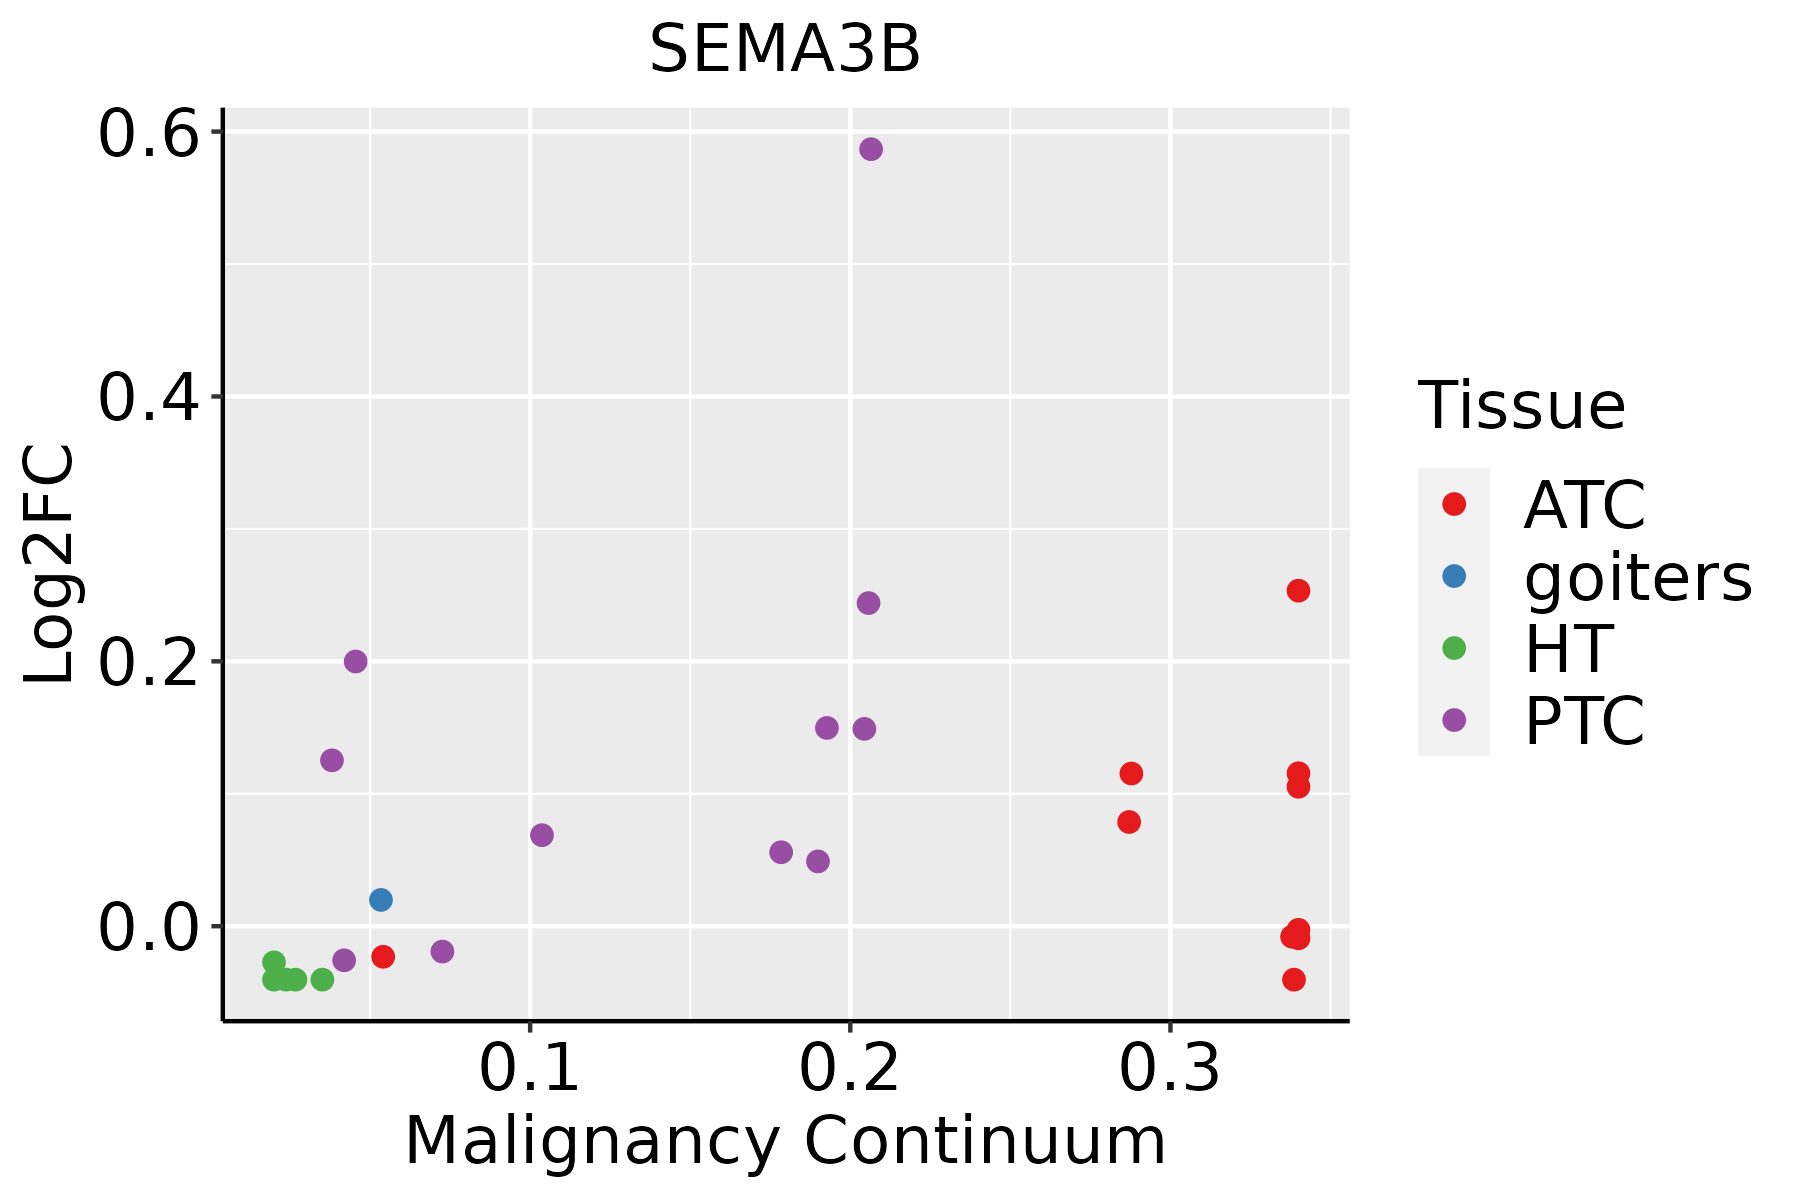 | ATC: Anaplastic thyroid cancer |
| HT: Hashimoto's thyroiditis | ||
| PTC: Papillary thyroid cancer |
| ∗log2FC in expression of this searched gene in stem-like cells from each diseased tissue sample relative to stem-like cells in normal samples in each tissue plotted against the malignancy continuum. Samples are colored based on if they are from different disease stage. |
Top |
Malignant transformation related pathway analysis |
| Find out the enriched GO biological processes and KEGG pathways involved in transition from healthy to precancer to cancer |
| Tissue | Disease Stage | Enriched GO biological Processes |
| Colorectum | AD |  |
| Colorectum | SER |  |
| Colorectum | MSS |  |
| Colorectum | MSI-H |  |
| Colorectum | FAP |  |
| ∗Top 15 enriched GO BP terms are showed in the bar plot of each disease state in each tissue. Each row represents a significant GO biological process which is colored according to the -log10(p.adjust). |
| Page: 1 2 3 4 5 6 7 8 9 |
| GO ID | Tissue | Disease Stage | Description | Gene Ratio | Bg Ratio | pvalue | p.adjust | Count |
| GO:0016049110 | Esophagus | ESCC | cell growth | 289/8552 | 482/18723 | 1.29e-10 | 3.77e-09 | 289 |
| GO:000155819 | Esophagus | ESCC | regulation of cell growth | 248/8552 | 414/18723 | 2.97e-09 | 6.45e-08 | 248 |
| GO:003253520 | Esophagus | ESCC | regulation of cellular component size | 227/8552 | 383/18723 | 4.77e-08 | 8.60e-07 | 227 |
| GO:00459267 | Esophagus | ESCC | negative regulation of growth | 148/8552 | 249/18723 | 7.88e-06 | 7.73e-05 | 148 |
| GO:00488638 | Esophagus | ESCC | stem cell differentiation | 122/8552 | 206/18723 | 5.95e-05 | 4.59e-04 | 122 |
| GO:005076710 | Esophagus | ESCC | regulation of neurogenesis | 203/8552 | 364/18723 | 6.10e-05 | 4.68e-04 | 203 |
| GO:00083619 | Esophagus | ESCC | regulation of cell size | 107/8552 | 181/18723 | 1.81e-04 | 1.16e-03 | 107 |
| GO:006156415 | Esophagus | ESCC | axon development | 251/8552 | 467/18723 | 2.41e-04 | 1.49e-03 | 251 |
| GO:001097516 | Esophagus | ESCC | regulation of neuron projection development | 240/8552 | 445/18723 | 2.48e-04 | 1.53e-03 | 240 |
| GO:00519606 | Esophagus | ESCC | regulation of nervous system development | 237/8552 | 443/18723 | 5.02e-04 | 2.78e-03 | 237 |
| GO:00487628 | Esophagus | ESCC | mesenchymal cell differentiation | 133/8552 | 236/18723 | 5.94e-04 | 3.22e-03 | 133 |
| GO:00303085 | Esophagus | ESCC | negative regulation of cell growth | 108/8552 | 188/18723 | 7.46e-04 | 3.87e-03 | 108 |
| GO:006056010 | Esophagus | ESCC | developmental growth involved in morphogenesis | 131/8552 | 234/18723 | 9.28e-04 | 4.73e-03 | 131 |
| GO:000166720 | Esophagus | ESCC | ameboidal-type cell migration | 250/8552 | 475/18723 | 1.22e-03 | 5.97e-03 | 250 |
| GO:000740915 | Esophagus | ESCC | axonogenesis | 219/8552 | 418/18723 | 3.14e-03 | 1.31e-02 | 219 |
| GO:00604856 | Esophagus | ESCC | mesenchyme development | 156/8552 | 291/18723 | 3.76e-03 | 1.53e-02 | 156 |
| GO:004858810 | Esophagus | ESCC | developmental cell growth | 125/8552 | 234/18723 | 1.01e-02 | 3.46e-02 | 125 |
| GO:003253512 | Liver | Cirrhotic | regulation of cellular component size | 135/4634 | 383/18723 | 2.32e-06 | 4.26e-05 | 135 |
| GO:001604911 | Liver | Cirrhotic | cell growth | 160/4634 | 482/18723 | 1.50e-05 | 2.07e-04 | 160 |
| GO:000155811 | Liver | Cirrhotic | regulation of cell growth | 132/4634 | 414/18723 | 5.53e-04 | 4.36e-03 | 132 |
| Page: 1 2 3 4 5 |
| Pathway ID | Tissue | Disease Stage | Description | Gene Ratio | Bg Ratio | pvalue | p.adjust | qvalue | Count |
| hsa0436016 | Esophagus | ESCC | Axon guidance | 108/4205 | 182/8465 | 5.13e-03 | 1.30e-02 | 6.67e-03 | 108 |
| hsa0436017 | Esophagus | ESCC | Axon guidance | 108/4205 | 182/8465 | 5.13e-03 | 1.30e-02 | 6.67e-03 | 108 |
| Page: 1 |
Top |
Cell-cell communication analysis |
| Identification of potential cell-cell interactions between two cell types and their ligand-receptor pairs for different disease states |
| Ligand | Receptor | LRpair | Pathway | Tissue | Disease Stage |
| SEMA3B | NRP1_PLXNA2 | SEMA3B_NRP1_PLXNA2 | SEMA3 | CRC | ADJ |
| SEMA3B | NRP1_PLXNA4 | SEMA3B_NRP1_PLXNA4 | SEMA3 | CRC | ADJ |
| SEMA3B | NRP2_PLXNA2 | SEMA3B_NRP2_PLXNA2 | SEMA3 | CRC | ADJ |
| SEMA3B | NRP1_PLXNA2 | SEMA3B_NRP1_PLXNA2 | SEMA3 | CRC | FAP |
| SEMA3B | NRP1_PLXNA4 | SEMA3B_NRP1_PLXNA4 | SEMA3 | CRC | FAP |
| SEMA3B | NRP2_PLXNA2 | SEMA3B_NRP2_PLXNA2 | SEMA3 | CRC | FAP |
| SEMA3B | NRP1_PLXNA1 | SEMA3B_NRP1_PLXNA1 | SEMA3 | CRC | MSI-H |
| SEMA3B | NRP1_PLXNA2 | SEMA3B_NRP1_PLXNA2 | SEMA3 | CRC | MSI-H |
| SEMA3B | NRP2_PLXNA2 | SEMA3B_NRP2_PLXNA2 | SEMA3 | CRC | MSI-H |
| SEMA3B | NRP1_PLXNA2 | SEMA3B_NRP1_PLXNA2 | SEMA3 | CRC | MSS |
| SEMA3B | NRP1_PLXNA2 | SEMA3B_NRP1_PLXNA2 | SEMA3 | Endometrium | ADJ |
| SEMA3B | NRP1_PLXNA2 | SEMA3B_NRP1_PLXNA2 | SEMA3 | Endometrium | AEH |
| SEMA3B | NRP2_PLXNA2 | SEMA3B_NRP2_PLXNA2 | SEMA3 | Endometrium | AEH |
| SEMA3B | NRP1_PLXNA2 | SEMA3B_NRP1_PLXNA2 | SEMA3 | Esophagus | ESCC |
| SEMA3B | NRP2_PLXNA2 | SEMA3B_NRP2_PLXNA2 | SEMA3 | Esophagus | ESCC |
| SEMA3B | NRP1_PLXNA2 | SEMA3B_NRP1_PLXNA2 | SEMA3 | GC | ADJ |
| SEMA3B | NRP1_PLXNA4 | SEMA3B_NRP1_PLXNA4 | SEMA3 | Lung | AAH |
| SEMA3B | NRP1_PLXNA4 | SEMA3B_NRP1_PLXNA4 | SEMA3 | Lung | ADJ |
| SEMA3B | NRP1_PLXNA2 | SEMA3B_NRP1_PLXNA2 | SEMA3 | Lung | AIS |
| SEMA3B | NRP1_PLXNA4 | SEMA3B_NRP1_PLXNA4 | SEMA3 | Lung | AIS |
| Page: 1 2 |
Top |
Single-cell gene regulatory network inference analysis |
| Find out the significant the regulons (TFs) and the target genes of each regulon across cell types for different disease states |
| TF | Cell Type | Tissue | Disease Stage | Target Gene | RSS | Regulon Activity |
| ∗The dot plots of a searched regulon are shown for all cell subpopulations in each disease state of each tissue based on the regulon specific score inferred using pySCENIC and by calculating the average expression. |
| Page: 1 |
Top |
Somatic mutation of malignant transformation related genes |
| Annotation of somatic variants for genes involved in malignant transformation |
| Hugo Symbol | Variant Class | Variant Classification | dbSNP RS | HGVSc | HGVSp | HGVSp Short | SWISSPROT | BIOTYPE | SIFT | PolyPhen | Tumor Sample Barcode | Tissue | Histology | Sex | Age | Stage | Therapy Types | Drugs | Outcome |
| SEMA3B | SNV | Missense_Mutation | novel | c.2159N>T | p.Ala720Val | p.A720V | protein_coding | tolerated(0.25) | benign(0.005) | TCGA-BS-A0TJ-01 | Endometrium | uterine corpus endometrioid carcinoma | Female | <65 | I/II | Unknown | Unknown | SD | |
| SEMA3B | SNV | Missense_Mutation | novel | c.1036N>A | p.Val346Met | p.V346M | protein_coding | tolerated(0.19) | benign(0.211) | TCGA-BS-A0UV-01 | Endometrium | uterine corpus endometrioid carcinoma | Female | <65 | III/IV | Unknown | Unknown | SD | |
| SEMA3B | SNV | Missense_Mutation | novel | c.976N>T | p.Pro326Ser | p.P326S | protein_coding | deleterious(0) | possibly_damaging(0.849) | TCGA-D1-A175-01 | Endometrium | uterine corpus endometrioid carcinoma | Female | <65 | I/II | Chemotherapy | paclitaxel | SD | |
| SEMA3B | SNV | Missense_Mutation | novel | c.385N>A | p.Leu129Met | p.L129M | protein_coding | deleterious(0.03) | probably_damaging(0.981) | TCGA-DF-A2KU-01 | Endometrium | uterine corpus endometrioid carcinoma | Female | Unknown | I/II | Unknown | Unknown | SD | |
| SEMA3B | SNV | Missense_Mutation | novel | c.473N>G | p.Pro158Arg | p.P158R | protein_coding | tolerated(0.07) | benign(0.001) | TCGA-DI-A1NO-01 | Endometrium | uterine corpus endometrioid carcinoma | Female | >=65 | III/IV | Unknown | Unknown | PD | |
| SEMA3B | SNV | Missense_Mutation | novel | c.1759N>A | p.Gly587Ser | p.G587S | protein_coding | deleterious(0.02) | probably_damaging(1) | TCGA-EO-A22U-01 | Endometrium | uterine corpus endometrioid carcinoma | Female | >=65 | I/II | Unknown | Unknown | SD | |
| SEMA3B | SNV | Missense_Mutation | novel | c.458T>C | p.Val153Ala | p.V153A | protein_coding | tolerated(0.09) | benign(0.039) | TCGA-FI-A2D5-01 | Endometrium | uterine corpus endometrioid carcinoma | Female | <65 | III/IV | Chemotherapy | carboplatinum | PD | |
| SEMA3B | deletion | Frame_Shift_Del | novel | c.1230delN | p.Leu412SerfsTer52 | p.L412Sfs*52 | protein_coding | TCGA-D1-A160-01 | Endometrium | uterine corpus endometrioid carcinoma | Female | >=65 | I/II | Unknown | Unknown | SD | |||
| SEMA3B | SNV | Missense_Mutation | rs782201786 | c.1718N>C | p.Gly573Ala | p.G573A | protein_coding | deleterious(0.03) | possibly_damaging(0.492) | TCGA-CC-A7IL-01 | Liver | liver hepatocellular carcinoma | Male | <65 | III/IV | Unknown | Unknown | PD | |
| SEMA3B | SNV | Missense_Mutation | novel | c.1796N>T | p.Pro599Leu | p.P599L | protein_coding | deleterious(0) | possibly_damaging(0.783) | TCGA-55-7911-01 | Lung | lung adenocarcinoma | Female | >=65 | I/II | Unknown | Unknown | PD |
| Page: 1 2 3 4 5 6 |
Top |
Related drugs of malignant transformation related genes |
| Identification of chemicals and drugs interact with genes involved in malignant transfromation |
| (DGIdb 4.0) |
| Entrez ID | Symbol | Category | Interaction Types | Drug Claim Name | Drug Name | PMIDs |
| Page: 1 |

Copyright 2023-Present -The University of Texas Health Science Center at Houston |