
|
|||||
|
 | |
| |
| |
| |
| |
| |
|
Gene: PTGIS |
Gene summary for PTGIS |
| Gene information | Species | Human | Gene symbol | PTGIS | Gene ID | 5740 |
| Gene name | prostaglandin I2 synthase | |
| Gene Alias | CYP8 | |
| Cytomap | 20q13.13 | |
| Gene Type | protein-coding | GO ID | GO:0001516 | UniProtAcc | Q16647 |
Top |
Malignant transformation analysis |
| Identification of the aberrant gene expression in precancerous and cancerous lesions by comparing the gene expression of stem-like cells in diseased tissues with normal stem cells |
| Entrez ID | Symbol | Replicates | Species | Organ | Tissue | Adj P-value | Log2FC | Malignancy |
| 5740 | PTGIS | P2T-E | Human | Esophagus | ESCC | 4.00e-26 | 5.06e-01 | 0.1177 |
| 5740 | PTGIS | P16T-E | Human | Esophagus | ESCC | 5.30e-21 | 3.71e-01 | 0.1153 |
| 5740 | PTGIS | P56T-E | Human | Esophagus | ESCC | 2.17e-07 | 7.54e-01 | 0.1613 |
| 5740 | PTGIS | P76T-E | Human | Esophagus | ESCC | 2.54e-03 | 1.69e-01 | 0.1207 |
| 5740 | PTGIS | P79T-E | Human | Esophagus | ESCC | 2.52e-03 | 1.00e-01 | 0.1154 |
| 5740 | PTGIS | HCC1_Meng | Human | Liver | HCC | 1.25e-03 | -9.90e-03 | 0.0246 |
| 5740 | PTGIS | HCC2_Meng | Human | Liver | HCC | 7.89e-23 | 2.14e-01 | 0.0107 |
| 5740 | PTGIS | cirrhotic3 | Human | Liver | Cirrhotic | 5.13e-20 | 4.48e-01 | 0.0215 |
| 5740 | PTGIS | HCC1 | Human | Liver | HCC | 8.27e-05 | 8.80e-01 | 0.5336 |
| 5740 | PTGIS | HCC2 | Human | Liver | HCC | 4.15e-09 | 7.27e-01 | 0.5341 |
| 5740 | PTGIS | HCC5 | Human | Liver | HCC | 4.34e-05 | 4.93e-01 | 0.4932 |
| 5740 | PTGIS | ATC13 | Human | Thyroid | ATC | 1.17e-31 | 8.93e-01 | 0.34 |
| 5740 | PTGIS | ATC2 | Human | Thyroid | ATC | 9.94e-09 | 1.17e+00 | 0.34 |
| 5740 | PTGIS | ATC5 | Human | Thyroid | ATC | 1.21e-24 | 9.15e-01 | 0.34 |
| Page: 1 |
| Tissue | Expression Dynamics | Abbreviation |
| Esophagus | 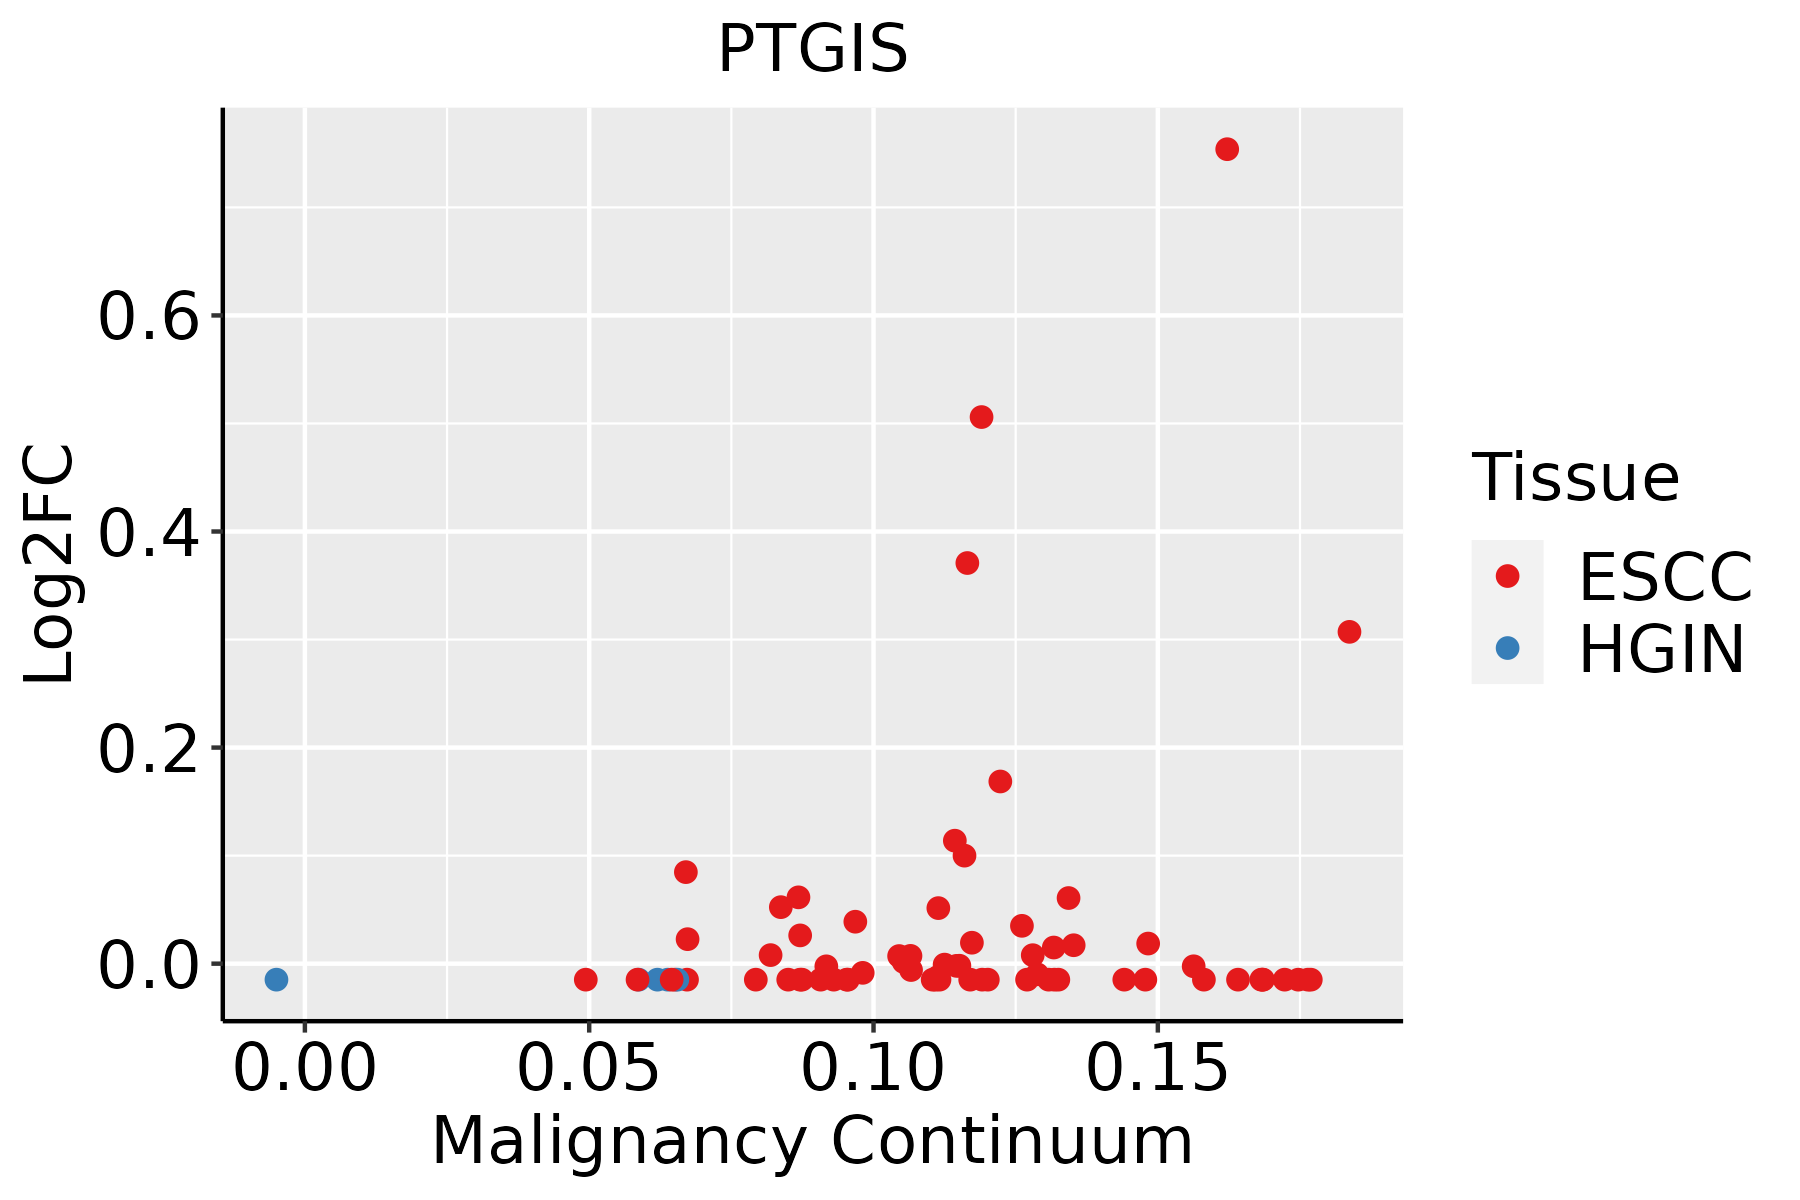 | ESCC: Esophageal squamous cell carcinoma |
| HGIN: High-grade intraepithelial neoplasias | ||
| LGIN: Low-grade intraepithelial neoplasias | ||
| Liver | 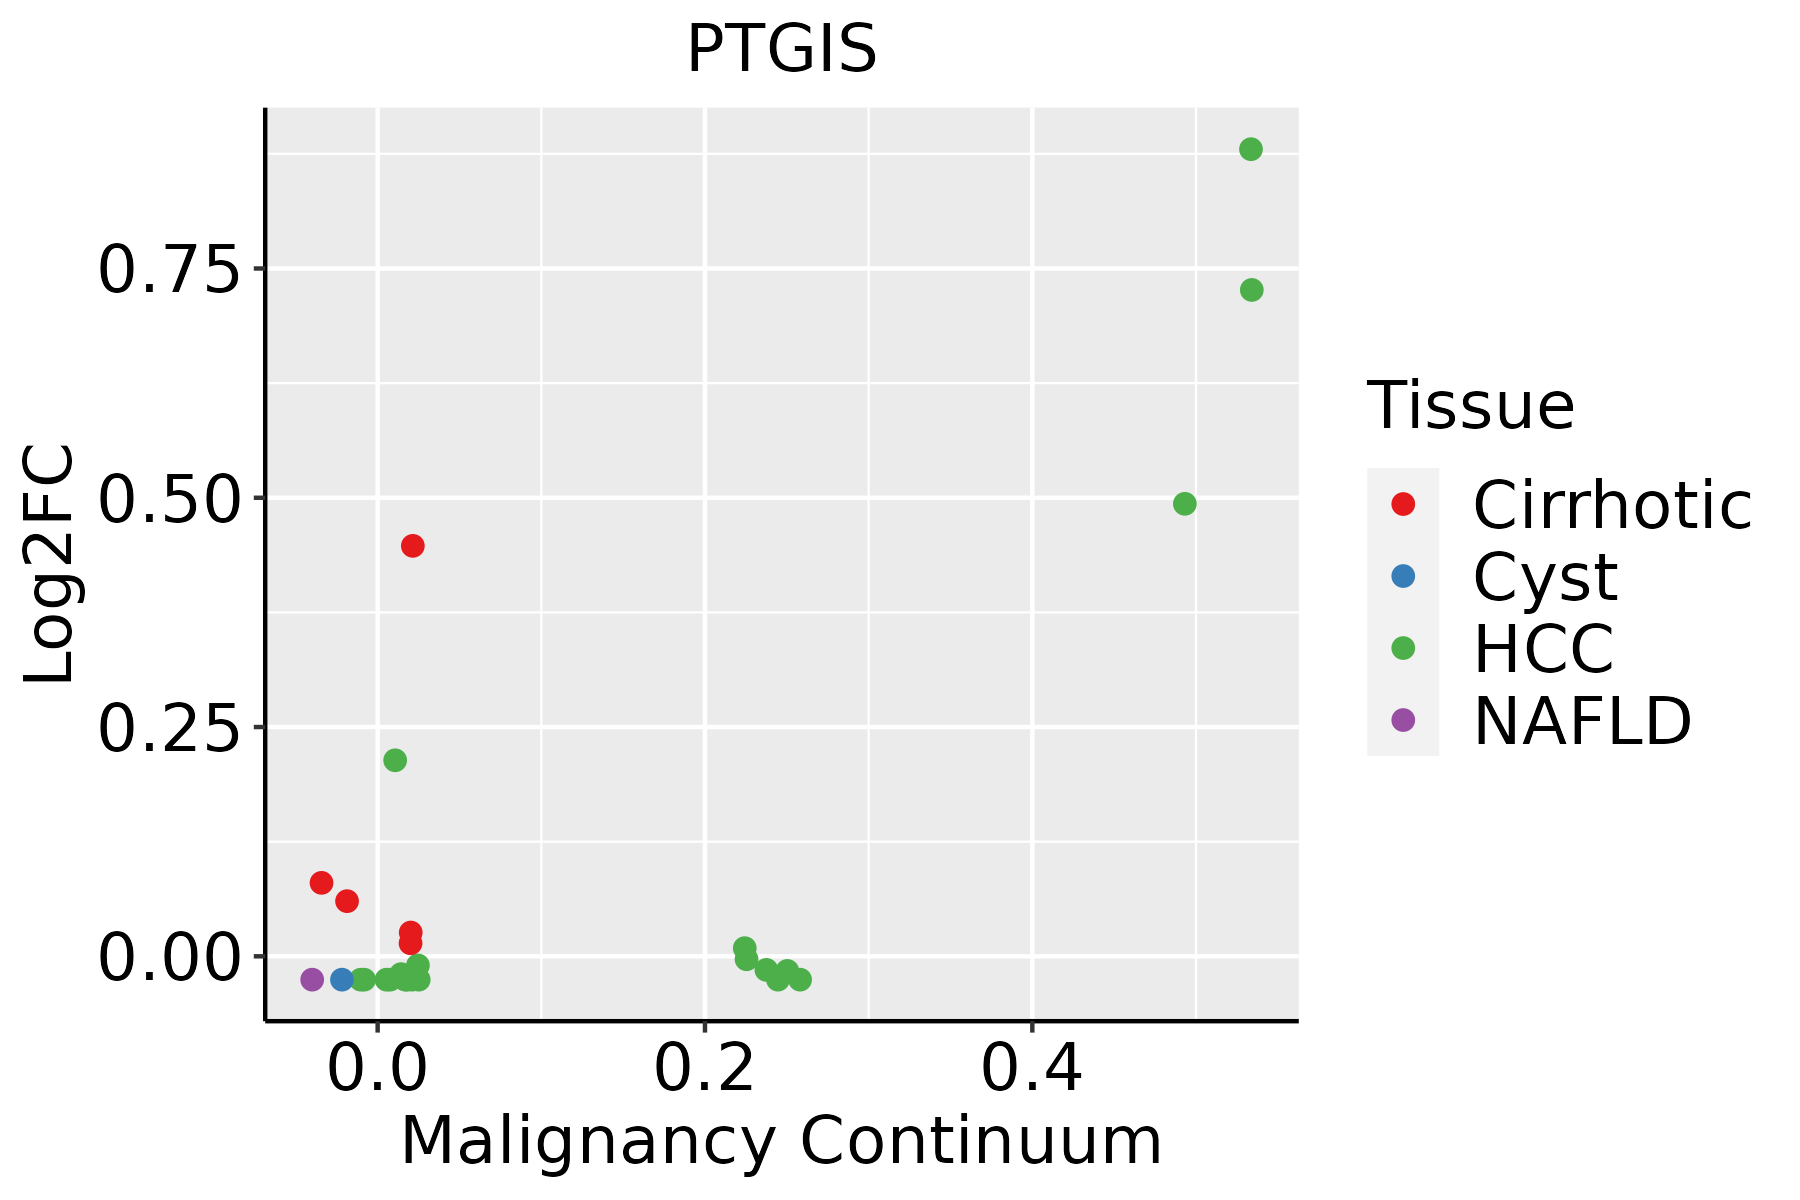 | HCC: Hepatocellular carcinoma |
| NAFLD: Non-alcoholic fatty liver disease | ||
| Thyroid | 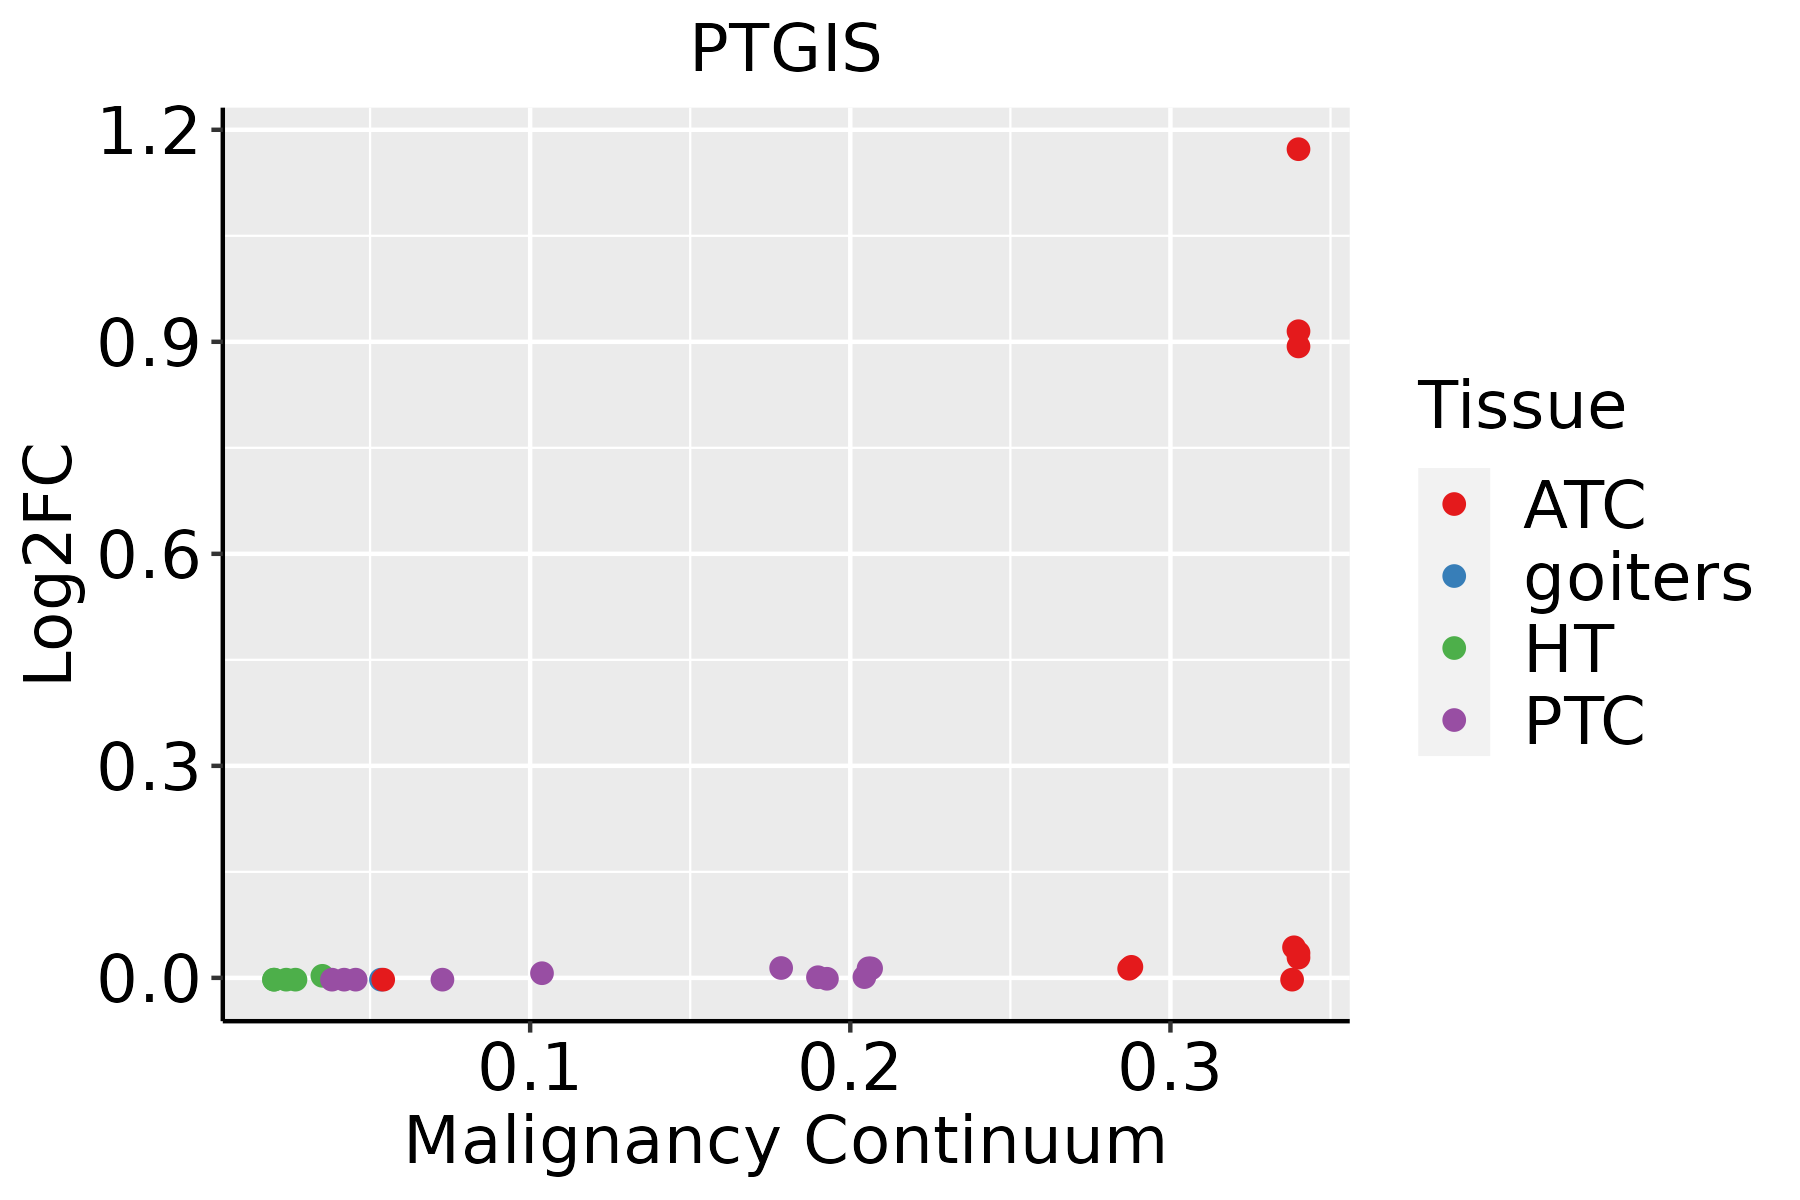 | ATC: Anaplastic thyroid cancer |
| HT: Hashimoto's thyroiditis | ||
| PTC: Papillary thyroid cancer |
| ∗log2FC in expression of this searched gene in stem-like cells from each diseased tissue sample relative to stem-like cells in normal samples in each tissue plotted against the malignancy continuum. Samples are colored based on if they are from different disease stage. |
Top |
Malignant transformation related pathway analysis |
| Find out the enriched GO biological processes and KEGG pathways involved in transition from healthy to precancer to cancer |
| Tissue | Disease Stage | Enriched GO biological Processes |
| Colorectum | AD |  |
| Colorectum | SER |  |
| Colorectum | MSS |  |
| Colorectum | MSI-H |  |
| Colorectum | FAP |  |
| ∗Top 15 enriched GO BP terms are showed in the bar plot of each disease state in each tissue. Each row represents a significant GO biological process which is colored according to the -log10(p.adjust). |
| Page: 1 2 3 4 5 6 7 8 9 |
| GO ID | Tissue | Disease Stage | Description | Gene Ratio | Bg Ratio | pvalue | p.adjust | Count |
| GO:0070482111 | Esophagus | ESCC | response to oxygen levels | 218/8552 | 347/18723 | 6.91e-11 | 2.17e-09 | 218 |
| GO:0036293111 | Esophagus | ESCC | response to decreased oxygen levels | 201/8552 | 322/18723 | 8.37e-10 | 2.04e-08 | 201 |
| GO:0030522110 | Esophagus | ESCC | intracellular receptor signaling pathway | 170/8552 | 265/18723 | 8.58e-10 | 2.09e-08 | 170 |
| GO:0001666111 | Esophagus | ESCC | response to hypoxia | 192/8552 | 307/18723 | 1.59e-09 | 3.69e-08 | 192 |
| GO:0006753110 | Esophagus | ESCC | nucleoside phosphate metabolic process | 288/8552 | 497/18723 | 1.80e-08 | 3.50e-07 | 288 |
| GO:0009117111 | Esophagus | ESCC | nucleotide metabolic process | 282/8552 | 489/18723 | 4.70e-08 | 8.50e-07 | 282 |
| GO:0071453110 | Esophagus | ESCC | cellular response to oxygen levels | 114/8552 | 177/18723 | 3.63e-07 | 5.06e-06 | 114 |
| GO:0036294110 | Esophagus | ESCC | cellular response to decreased oxygen levels | 105/8552 | 161/18723 | 4.20e-07 | 5.73e-06 | 105 |
| GO:00510908 | Esophagus | ESCC | regulation of DNA-binding transcription factor activity | 252/8552 | 440/18723 | 5.22e-07 | 6.97e-06 | 252 |
| GO:007145616 | Esophagus | ESCC | cellular response to hypoxia | 97/8552 | 151/18723 | 3.12e-06 | 3.51e-05 | 97 |
| GO:000916516 | Esophagus | ESCC | nucleotide biosynthetic process | 150/8552 | 254/18723 | 1.12e-05 | 1.06e-04 | 150 |
| GO:190129316 | Esophagus | ESCC | nucleoside phosphate biosynthetic process | 151/8552 | 256/18723 | 1.15e-05 | 1.08e-04 | 151 |
| GO:00066318 | Esophagus | ESCC | fatty acid metabolic process | 217/8552 | 390/18723 | 4.21e-05 | 3.39e-04 | 217 |
| GO:00463948 | Esophagus | ESCC | carboxylic acid biosynthetic process | 175/8552 | 314/18723 | 1.98e-04 | 1.26e-03 | 175 |
| GO:00160538 | Esophagus | ESCC | organic acid biosynthetic process | 175/8552 | 316/18723 | 3.04e-04 | 1.82e-03 | 175 |
| GO:000669211 | Esophagus | ESCC | prostanoid metabolic process | 33/8552 | 49/18723 | 1.80e-03 | 8.26e-03 | 33 |
| GO:000669311 | Esophagus | ESCC | prostaglandin metabolic process | 33/8552 | 49/18723 | 1.80e-03 | 8.26e-03 | 33 |
| GO:000680917 | Esophagus | ESCC | nitric oxide biosynthetic process | 47/8552 | 76/18723 | 3.29e-03 | 1.35e-02 | 47 |
| GO:200105717 | Esophagus | ESCC | reactive nitrogen species metabolic process | 50/8552 | 82/18723 | 3.76e-03 | 1.53e-02 | 50 |
| GO:00434332 | Esophagus | ESCC | negative regulation of DNA-binding transcription factor activity | 103/8552 | 185/18723 | 3.86e-03 | 1.57e-02 | 103 |
| Page: 1 2 3 4 5 6 |
| Pathway ID | Tissue | Disease Stage | Description | Gene Ratio | Bg Ratio | pvalue | p.adjust | qvalue | Count |
| Page: 1 |
Top |
Cell-cell communication analysis |
| Identification of potential cell-cell interactions between two cell types and their ligand-receptor pairs for different disease states |
| Ligand | Receptor | LRpair | Pathway | Tissue | Disease Stage |
| Page: 1 |
Top |
Single-cell gene regulatory network inference analysis |
| Find out the significant the regulons (TFs) and the target genes of each regulon across cell types for different disease states |
| TF | Cell Type | Tissue | Disease Stage | Target Gene | RSS | Regulon Activity |
| ∗The dot plots of a searched regulon are shown for all cell subpopulations in each disease state of each tissue based on the regulon specific score inferred using pySCENIC and by calculating the average expression. |
| Page: 1 |
Top |
Somatic mutation of malignant transformation related genes |
| Annotation of somatic variants for genes involved in malignant transformation |
| Hugo Symbol | Variant Class | Variant Classification | dbSNP RS | HGVSc | HGVSp | HGVSp Short | SWISSPROT | BIOTYPE | SIFT | PolyPhen | Tumor Sample Barcode | Tissue | Histology | Sex | Age | Stage | Therapy Types | Drugs | Outcome |
| PTGIS | insertion | Nonsense_Mutation | novel | c.1249_1250insTTATAACTACACCCCAGGAGTG | p.Lys417IlefsTer8 | p.K417Ifs*8 | Q16647 | protein_coding | TCGA-A5-A0G3-01 | Endometrium | uterine corpus endometrioid carcinoma | Female | <65 | III/IV | Chemotherapy | carboplatin | PD | ||
| PTGIS | SNV | Missense_Mutation | rs754311420 | c.563N>A | p.Arg188His | p.R188H | Q16647 | protein_coding | tolerated(0.28) | benign(0.003) | TCGA-4R-AA8I-01 | Liver | liver hepatocellular carcinoma | Male | >=65 | I/II | Unknown | Unknown | PD |
| PTGIS | SNV | Missense_Mutation | rs745642215 | c.928C>T | p.Arg310Cys | p.R310C | Q16647 | protein_coding | deleterious(0.01) | benign(0.088) | TCGA-ZS-A9CG-01 | Liver | liver hepatocellular carcinoma | Male | <65 | I/II | Unknown | Unknown | SD |
| PTGIS | SNV | Missense_Mutation | c.1058N>A | p.Ala353Asp | p.A353D | Q16647 | protein_coding | deleterious(0) | probably_damaging(1) | TCGA-35-5375-01 | Lung | lung adenocarcinoma | Male | <65 | III/IV | Unknown | Unknown | SD | |
| PTGIS | SNV | Missense_Mutation | rs780217825 | c.1118N>A | p.Arg373Gln | p.R373Q | Q16647 | protein_coding | tolerated(0.53) | benign(0.141) | TCGA-44-7670-01 | Lung | lung adenocarcinoma | Female | <65 | I/II | Chemotherapy | docetaxel | SD |
| PTGIS | SNV | Missense_Mutation | rs144185728 | c.272N>A | p.Arg91His | p.R91H | Q16647 | protein_coding | deleterious(0.02) | benign(0.007) | TCGA-55-6975-01 | Lung | lung adenocarcinoma | Male | <65 | I/II | Unknown | Unknown | PD |
| PTGIS | SNV | Missense_Mutation | novel | c.1004T>C | p.Leu335Pro | p.L335P | Q16647 | protein_coding | deleterious(0.04) | benign(0.397) | TCGA-55-8089-01 | Lung | lung adenocarcinoma | Male | <65 | I/II | Unknown | Unknown | SD |
| PTGIS | SNV | Missense_Mutation | c.648N>T | p.Lys216Asn | p.K216N | Q16647 | protein_coding | tolerated(0.1) | probably_damaging(0.996) | TCGA-55-A490-01 | Lung | lung adenocarcinoma | Male | >=65 | I/II | Chemotherapy | carboplatin | SD | |
| PTGIS | SNV | Missense_Mutation | c.562C>A | p.Arg188Ser | p.R188S | Q16647 | protein_coding | tolerated(0.91) | benign(0.13) | TCGA-69-7978-01 | Lung | lung adenocarcinoma | Male | <65 | I/II | Unknown | Unknown | SD | |
| PTGIS | SNV | Missense_Mutation | rs747873847 | c.622N>T | p.Arg208Cys | p.R208C | Q16647 | protein_coding | deleterious(0) | probably_damaging(0.996) | TCGA-MP-A4SY-01 | Lung | lung adenocarcinoma | Male | <65 | I/II | Unknown | Unknown | PD |
| Page: 1 2 3 4 5 6 |
Top |
Related drugs of malignant transformation related genes |
| Identification of chemicals and drugs interact with genes involved in malignant transfromation |
| (DGIdb 4.0) |
| Entrez ID | Symbol | Category | Interaction Types | Drug Claim Name | Drug Name | PMIDs |
| 5740 | PTGIS | DRUGGABLE GENOME, CYTOCHROME P450, ENZYME | PHENYLBUTAZONE | PHENYLBUTAZONE | ||
| 5740 | PTGIS | DRUGGABLE GENOME, CYTOCHROME P450, ENZYME | PHENYLBUTAZONE | PHENYLBUTAZONE | ||
| 5740 | PTGIS | DRUGGABLE GENOME, CYTOCHROME P450, ENZYME | inhibitor | 252827453 |
| Page: 1 |

Copyright 2023-Present -The University of Texas Health Science Center at Houston |