
|
|||||
|
 | |
| |
| |
| |
| |
| |
|
Gene: PTAR1 |
Gene summary for PTAR1 |
| Gene information | Species | Human | Gene symbol | PTAR1 | Gene ID | 375743 |
| Gene name | protein prenyltransferase alpha subunit repeat containing 1 | |
| Gene Alias | PTAR1 | |
| Cytomap | 9q21.12 | |
| Gene Type | protein-coding | GO ID | GO:0006464 | UniProtAcc | Q7Z6K3 |
Top |
Malignant transformation analysis |
| Identification of the aberrant gene expression in precancerous and cancerous lesions by comparing the gene expression of stem-like cells in diseased tissues with normal stem cells |
| Entrez ID | Symbol | Replicates | Species | Organ | Tissue | Adj P-value | Log2FC | Malignancy |
| 375743 | PTAR1 | CCI_2 | Human | Cervix | CC | 7.72e-04 | 6.77e-01 | 0.5249 |
| 375743 | PTAR1 | CCI_3 | Human | Cervix | CC | 1.34e-03 | 5.54e-01 | 0.516 |
| 375743 | PTAR1 | HTA11_3410_2000001011 | Human | Colorectum | AD | 4.32e-22 | -6.25e-01 | 0.0155 |
| 375743 | PTAR1 | HTA11_2487_2000001011 | Human | Colorectum | SER | 1.86e-08 | -5.57e-01 | -0.1808 |
| 375743 | PTAR1 | HTA11_3361_2000001011 | Human | Colorectum | AD | 2.70e-06 | -5.53e-01 | -0.1207 |
| 375743 | PTAR1 | HTA11_83_2000001011 | Human | Colorectum | SER | 6.29e-04 | -5.15e-01 | -0.1526 |
| 375743 | PTAR1 | HTA11_696_2000001011 | Human | Colorectum | AD | 9.24e-12 | -4.62e-01 | -0.1464 |
| 375743 | PTAR1 | HTA11_866_2000001011 | Human | Colorectum | AD | 5.47e-14 | -4.63e-01 | -0.1001 |
| 375743 | PTAR1 | HTA11_1391_2000001011 | Human | Colorectum | AD | 7.12e-08 | -4.63e-01 | -0.059 |
| 375743 | PTAR1 | HTA11_866_3004761011 | Human | Colorectum | AD | 1.20e-11 | -5.27e-01 | 0.096 |
| 375743 | PTAR1 | HTA11_10711_2000001011 | Human | Colorectum | AD | 1.05e-09 | -5.90e-01 | 0.0338 |
| 375743 | PTAR1 | HTA11_7696_3000711011 | Human | Colorectum | AD | 3.42e-22 | -5.53e-01 | 0.0674 |
| 375743 | PTAR1 | HTA11_99999971662_82457 | Human | Colorectum | MSS | 1.65e-15 | -5.05e-01 | 0.3859 |
| 375743 | PTAR1 | HTA11_99999973899_84307 | Human | Colorectum | MSS | 1.42e-05 | -5.84e-01 | 0.2585 |
| 375743 | PTAR1 | HTA11_99999974143_84620 | Human | Colorectum | MSS | 2.11e-26 | -5.89e-01 | 0.3005 |
| 375743 | PTAR1 | F007 | Human | Colorectum | FAP | 7.98e-04 | -3.61e-01 | 0.1176 |
| 375743 | PTAR1 | A002-C-010 | Human | Colorectum | FAP | 8.59e-08 | -2.98e-01 | 0.242 |
| 375743 | PTAR1 | A001-C-207 | Human | Colorectum | FAP | 1.08e-05 | -3.52e-01 | 0.1278 |
| 375743 | PTAR1 | A015-C-203 | Human | Colorectum | FAP | 2.01e-32 | -5.18e-01 | -0.1294 |
| 375743 | PTAR1 | A015-C-204 | Human | Colorectum | FAP | 1.17e-07 | -3.88e-01 | -0.0228 |
| Page: 1 2 3 4 5 6 |
| Tissue | Expression Dynamics | Abbreviation |
| Cervix |  | CC: Cervix cancer |
| HSIL_HPV: HPV-infected high-grade squamous intraepithelial lesions | ||
| N_HPV: HPV-infected normal cervix | ||
| Colorectum (GSE201348) |  | FAP: Familial adenomatous polyposis |
| CRC: Colorectal cancer | ||
| Colorectum (HTA11) |  | AD: Adenomas |
| SER: Sessile serrated lesions | ||
| MSI-H: Microsatellite-high colorectal cancer | ||
| MSS: Microsatellite stable colorectal cancer | ||
| Esophagus |  | ESCC: Esophageal squamous cell carcinoma |
| HGIN: High-grade intraepithelial neoplasias | ||
| LGIN: Low-grade intraepithelial neoplasias | ||
| Skin | 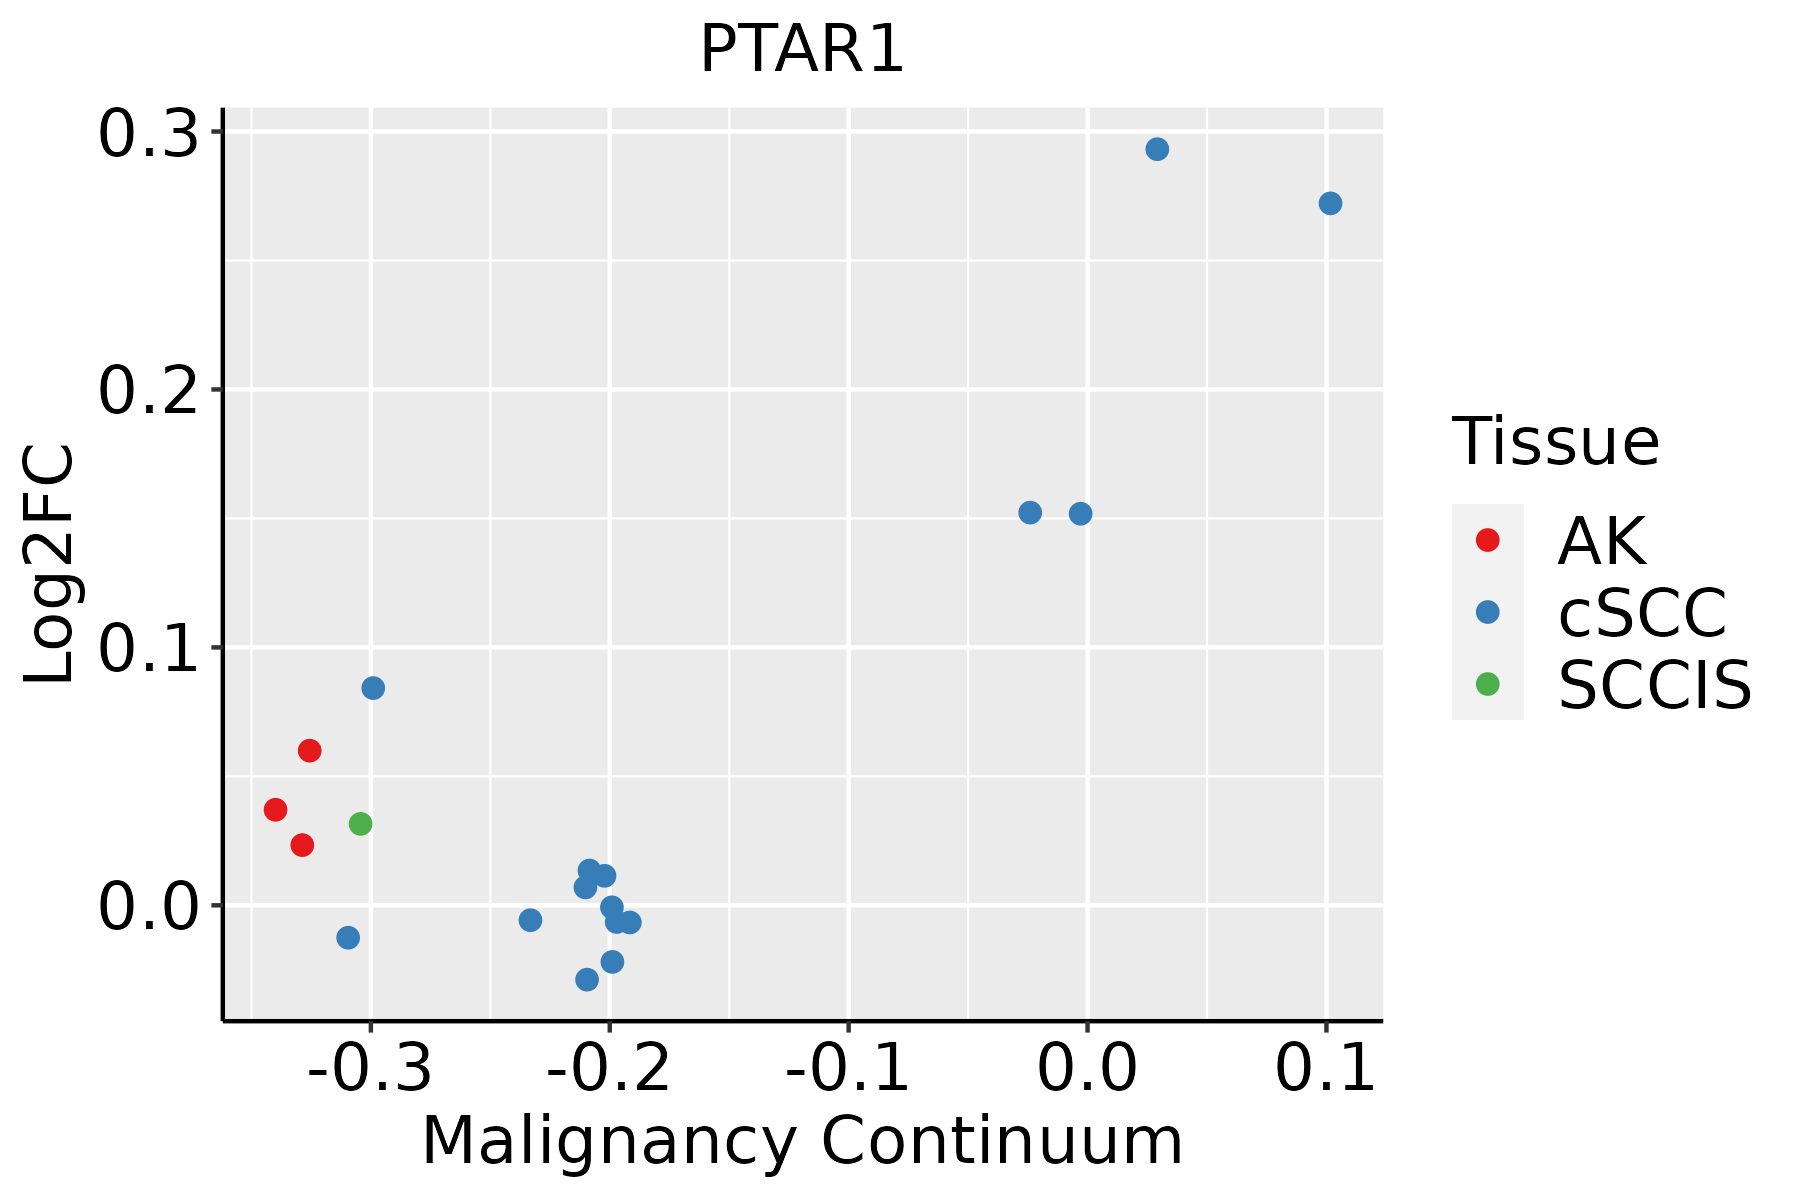 | AK: Actinic keratosis |
| cSCC: Cutaneous squamous cell carcinoma | ||
| SCCIS:squamous cell carcinoma in situ | ||
| Thyroid | 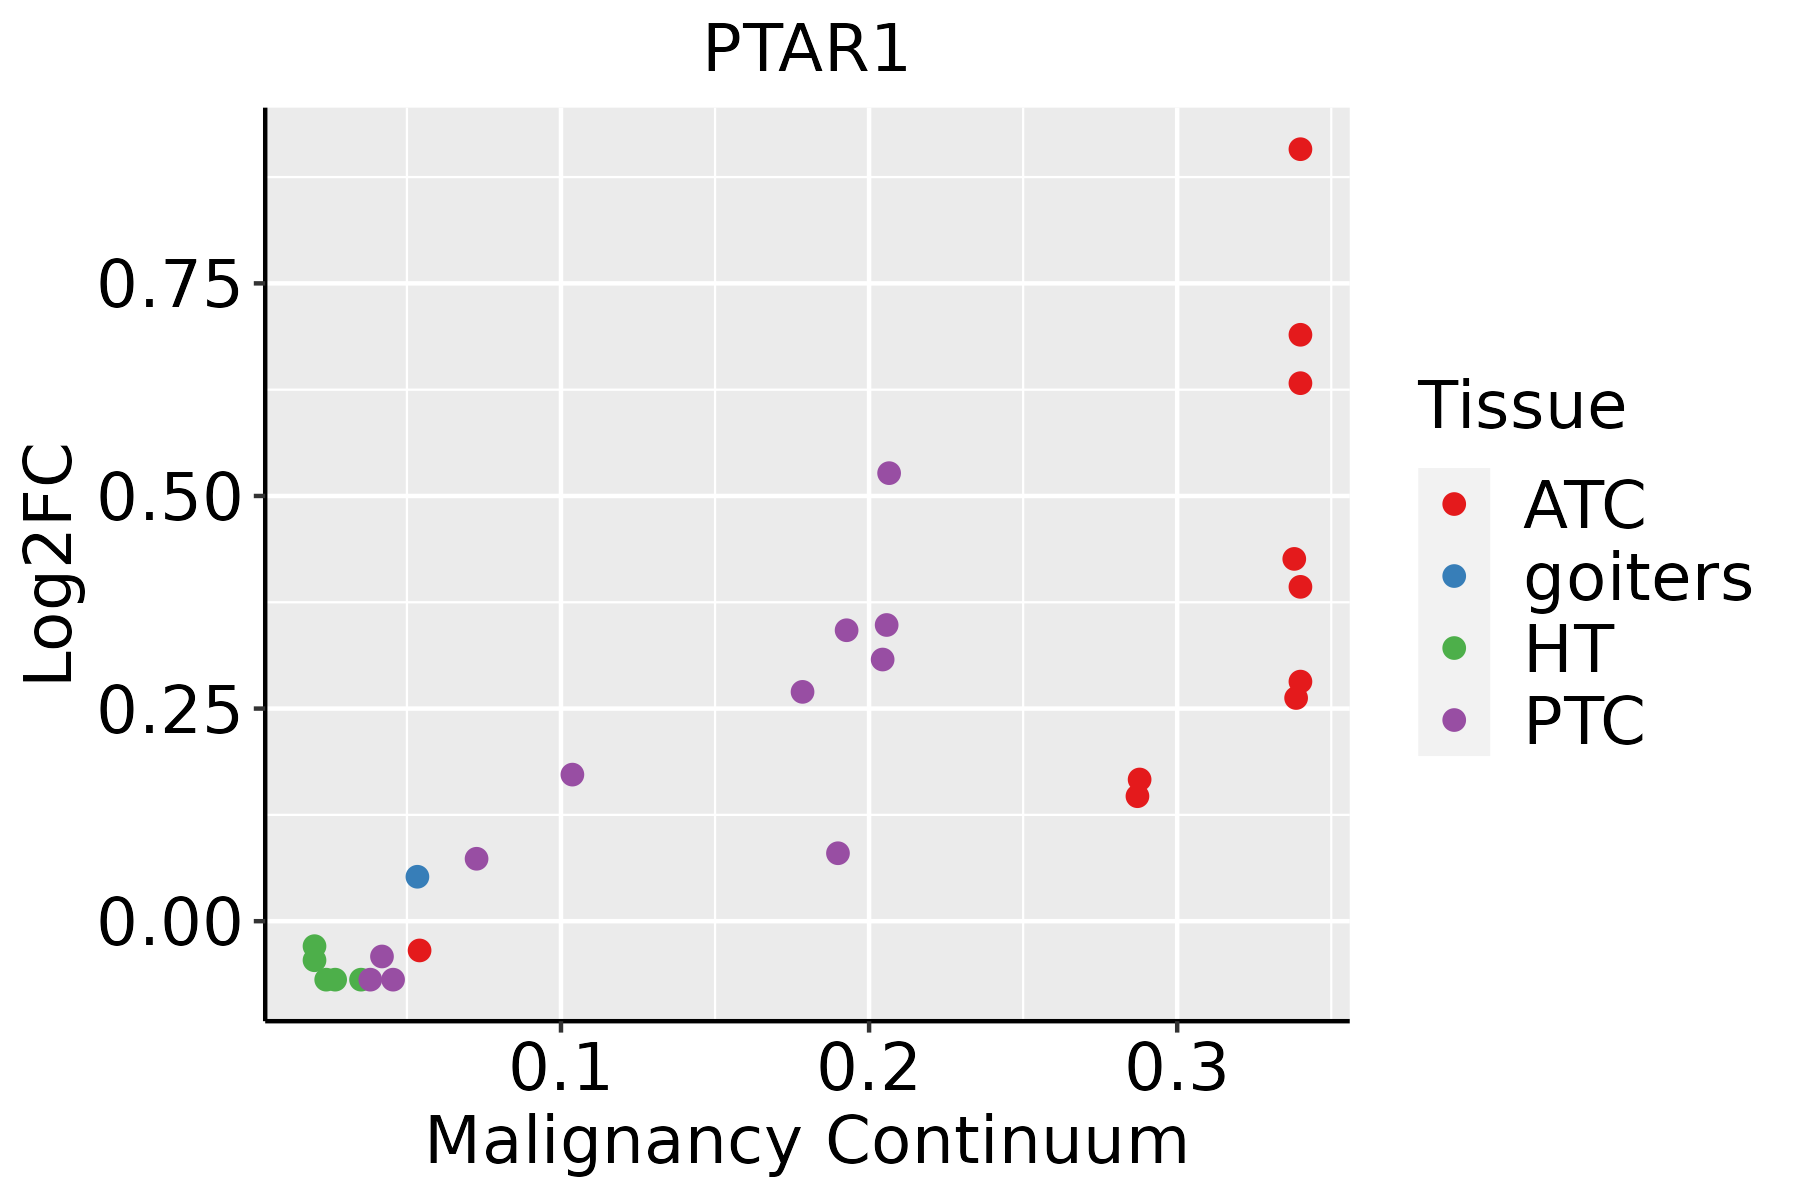 | ATC: Anaplastic thyroid cancer |
| HT: Hashimoto's thyroiditis | ||
| PTC: Papillary thyroid cancer |
| ∗log2FC in expression of this searched gene in stem-like cells from each diseased tissue sample relative to stem-like cells in normal samples in each tissue plotted against the malignancy continuum. Samples are colored based on if they are from different disease stage. |
Top |
Malignant transformation related pathway analysis |
| Find out the enriched GO biological processes and KEGG pathways involved in transition from healthy to precancer to cancer |
| Tissue | Disease Stage | Enriched GO biological Processes |
| Colorectum | AD |  |
| Colorectum | SER |  |
| Colorectum | MSS |  |
| Colorectum | MSI-H |  |
| Colorectum | FAP |  |
| ∗Top 15 enriched GO BP terms are showed in the bar plot of each disease state in each tissue. Each row represents a significant GO biological process which is colored according to the -log10(p.adjust). |
| Page: 1 2 3 4 5 6 7 8 9 |
| GO ID | Tissue | Disease Stage | Description | Gene Ratio | Bg Ratio | pvalue | p.adjust | Count |
| Page: 1 |
| Pathway ID | Tissue | Disease Stage | Description | Gene Ratio | Bg Ratio | pvalue | p.adjust | qvalue | Count |
| Page: 1 |
Top |
Cell-cell communication analysis |
| Identification of potential cell-cell interactions between two cell types and their ligand-receptor pairs for different disease states |
| Ligand | Receptor | LRpair | Pathway | Tissue | Disease Stage |
| Page: 1 |
Top |
Single-cell gene regulatory network inference analysis |
| Find out the significant the regulons (TFs) and the target genes of each regulon across cell types for different disease states |
| TF | Cell Type | Tissue | Disease Stage | Target Gene | RSS | Regulon Activity |
| ∗The dot plots of a searched regulon are shown for all cell subpopulations in each disease state of each tissue based on the regulon specific score inferred using pySCENIC and by calculating the average expression. |
| Page: 1 |
Top |
Somatic mutation of malignant transformation related genes |
| Annotation of somatic variants for genes involved in malignant transformation |
| Hugo Symbol | Variant Class | Variant Classification | dbSNP RS | HGVSc | HGVSp | HGVSp Short | SWISSPROT | BIOTYPE | SIFT | PolyPhen | Tumor Sample Barcode | Tissue | Histology | Sex | Age | Stage | Therapy Types | Drugs | Outcome |
| PTAR1 | SNV | Missense_Mutation | novel | c.889N>C | p.Glu297Gln | p.E297Q | Q7Z6K3 | protein_coding | tolerated(0.09) | benign(0.166) | TCGA-CR-6480-01 | Oral cavity | head & neck squamous cell carcinoma | Male | <65 | I/II | Chemotherapy | paclitaxel | SD |
| PTAR1 | SNV | Missense_Mutation | novel | c.789G>C | p.Leu263Phe | p.L263F | Q7Z6K3 | protein_coding | tolerated(0.17) | benign(0.157) | TCGA-CV-6951-01 | Oral cavity | head & neck squamous cell carcinoma | Male | <65 | I/II | Unknown | Unknown | PD |
| PTAR1 | SNV | Missense_Mutation | c.785N>A | p.Pro262His | p.P262H | Q7Z6K3 | protein_coding | tolerated(0.61) | benign(0.001) | TCGA-BR-6452-01 | Stomach | stomach adenocarcinoma | Female | >=65 | I/II | Unknown | Unknown | SD | |
| PTAR1 | insertion | Frame_Shift_Ins | novel | c.763_764insCA | p.Ser255ThrfsTer4 | p.S255Tfs*4 | Q7Z6K3 | protein_coding | TCGA-VQ-AA6D-01 | Stomach | stomach adenocarcinoma | Female | <65 | III/IV | Chemotherapy | fluorouracil | CR | ||
| PTAR1 | SNV | Missense_Mutation | novel | c.21G>T | p.Glu7Asp | p.E7D | Q7Z6K3 | protein_coding | deleterious_low_confidence(0.02) | benign(0.317) | TCGA-DJ-A2QB-01 | Thyroid | thyroid carcinoma | Female | <65 | I/II | Unknown | Unknown | SD |
| PTAR1 | insertion | Frame_Shift_Ins | novel | c.102_103insTTCCTACTAT | p.Ile35PhefsTer8 | p.I35Ffs*8 | Q7Z6K3 | protein_coding | TCGA-EL-A3ZP-01 | Thyroid | thyroid carcinoma | Male | <65 | I/II | Unknown | Unknown | SD |
| Page: 1 2 3 4 |
Top |
Related drugs of malignant transformation related genes |
| Identification of chemicals and drugs interact with genes involved in malignant transfromation |
| (DGIdb 4.0) |
| Entrez ID | Symbol | Category | Interaction Types | Drug Claim Name | Drug Name | PMIDs |
| Page: 1 |

Copyright 2023-Present -The University of Texas Health Science Center at Houston |