
|
|||||
|
 | |
| |
| |
| |
| |
| |
|
Gene: PECR |
Gene summary for PECR |
| Gene information | Species | Human | Gene symbol | PECR | Gene ID | 55825 |
| Gene name | peroxisomal trans-2-enoyl-CoA reductase | |
| Gene Alias | DCRRP | |
| Cytomap | 2q35 | |
| Gene Type | protein-coding | GO ID | GO:0006066 | UniProtAcc | Q9BY49 |
Top |
Malignant transformation analysis |
| Identification of the aberrant gene expression in precancerous and cancerous lesions by comparing the gene expression of stem-like cells in diseased tissues with normal stem cells |
| Entrez ID | Symbol | Replicates | Species | Organ | Tissue | Adj P-value | Log2FC | Malignancy |
| 55825 | PECR | S43 | Human | Liver | Cirrhotic | 2.67e-10 | -2.12e-01 | -0.0187 |
| 55825 | PECR | HCC1_Meng | Human | Liver | HCC | 4.48e-80 | 1.79e-02 | 0.0246 |
| 55825 | PECR | HCC2_Meng | Human | Liver | HCC | 2.32e-18 | -1.43e-01 | 0.0107 |
| 55825 | PECR | HCC1 | Human | Liver | HCC | 5.02e-08 | 3.28e+00 | 0.5336 |
| 55825 | PECR | HCC2 | Human | Liver | HCC | 5.27e-17 | 2.90e+00 | 0.5341 |
| 55825 | PECR | Pt14.d | Human | Liver | HCC | 2.61e-02 | -1.96e-01 | 0.0143 |
| 55825 | PECR | S015 | Human | Liver | HCC | 1.68e-06 | 6.45e-01 | 0.2375 |
| 55825 | PECR | S016 | Human | Liver | HCC | 7.99e-05 | 5.05e-01 | 0.2243 |
| 55825 | PECR | male-WTA | Human | Thyroid | PTC | 1.89e-18 | 2.96e-01 | 0.1037 |
| 55825 | PECR | PTC01 | Human | Thyroid | PTC | 1.20e-06 | 1.93e-01 | 0.1899 |
| 55825 | PECR | PTC04 | Human | Thyroid | PTC | 3.21e-03 | 9.44e-02 | 0.1927 |
| 55825 | PECR | PTC05 | Human | Thyroid | PTC | 1.16e-13 | 3.06e-01 | 0.2065 |
| 55825 | PECR | PTC06 | Human | Thyroid | PTC | 1.74e-18 | 6.15e-01 | 0.2057 |
| 55825 | PECR | PTC07 | Human | Thyroid | PTC | 4.88e-29 | 6.78e-01 | 0.2044 |
| Page: 1 |
| Tissue | Expression Dynamics | Abbreviation |
| Liver | 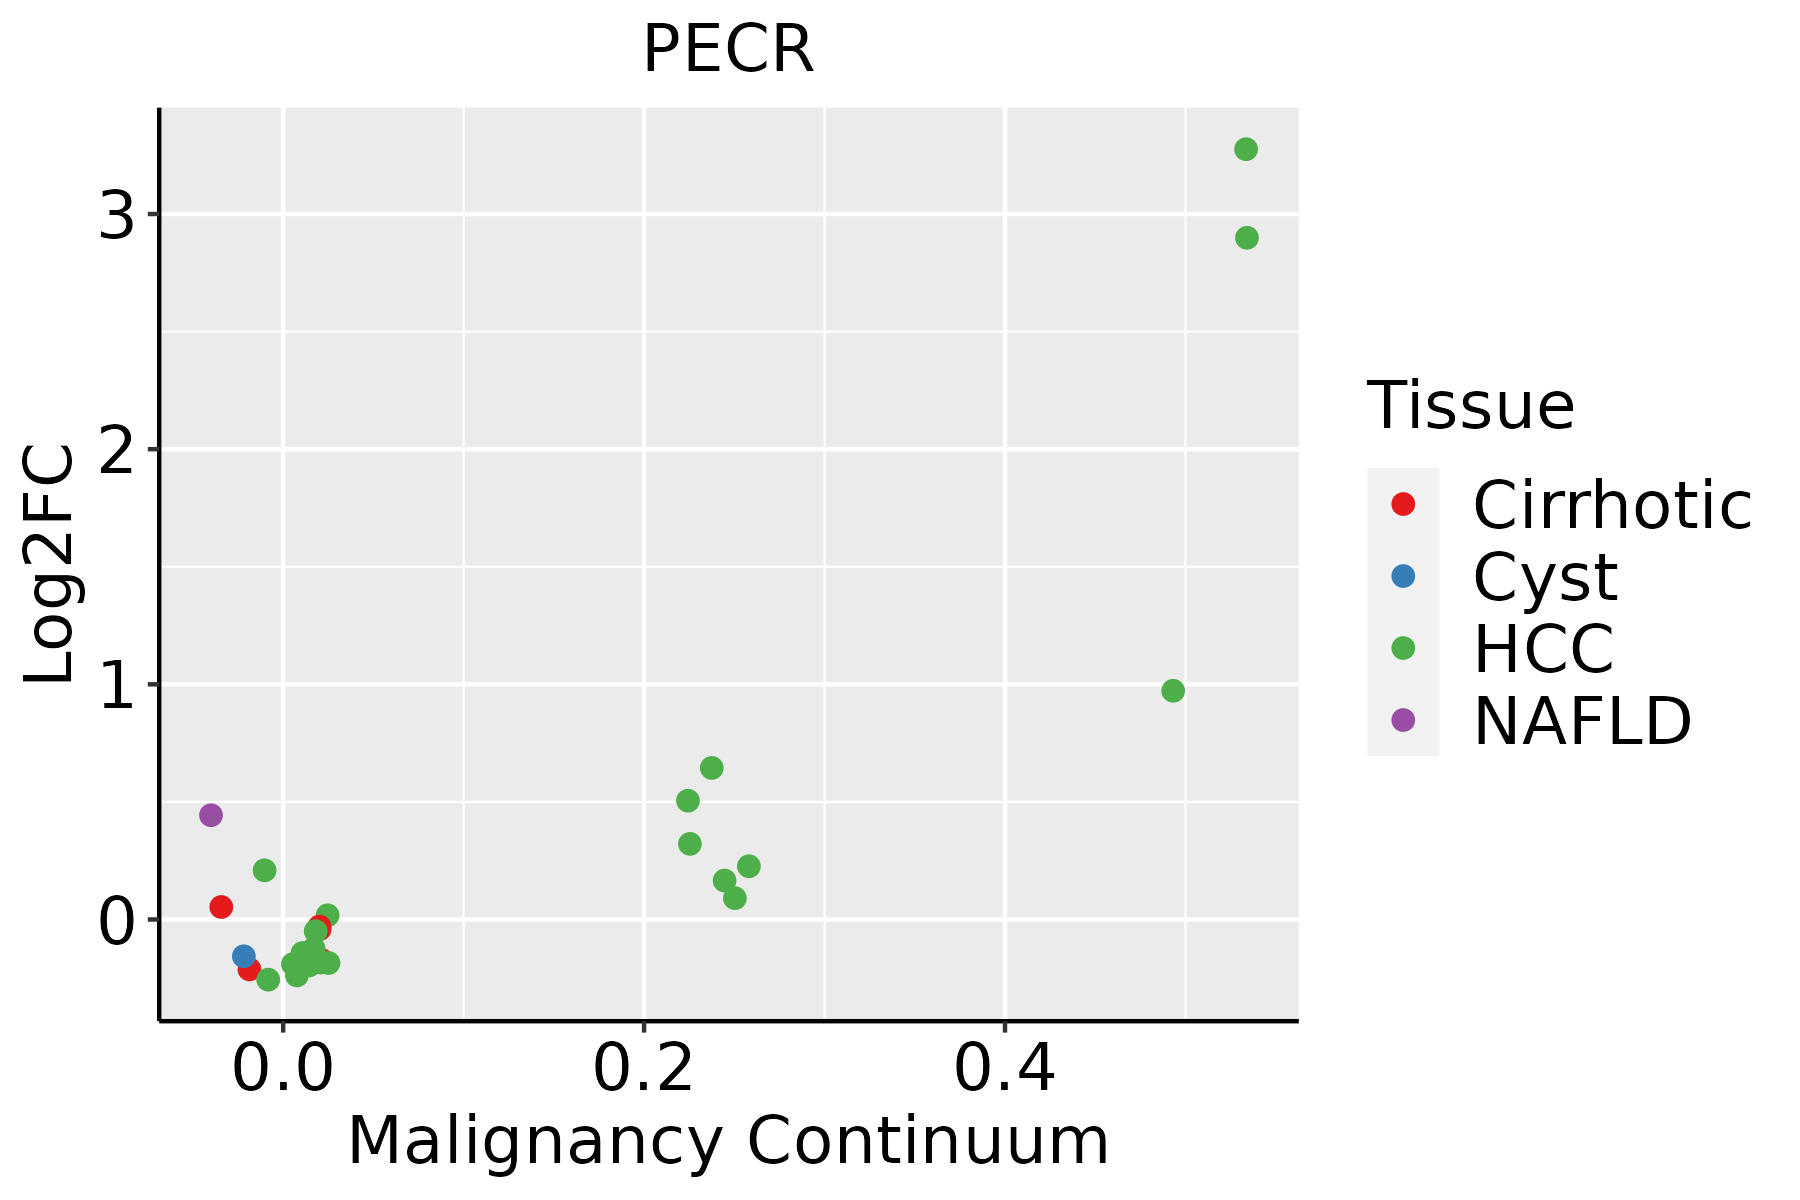 | HCC: Hepatocellular carcinoma |
| NAFLD: Non-alcoholic fatty liver disease | ||
| Thyroid | 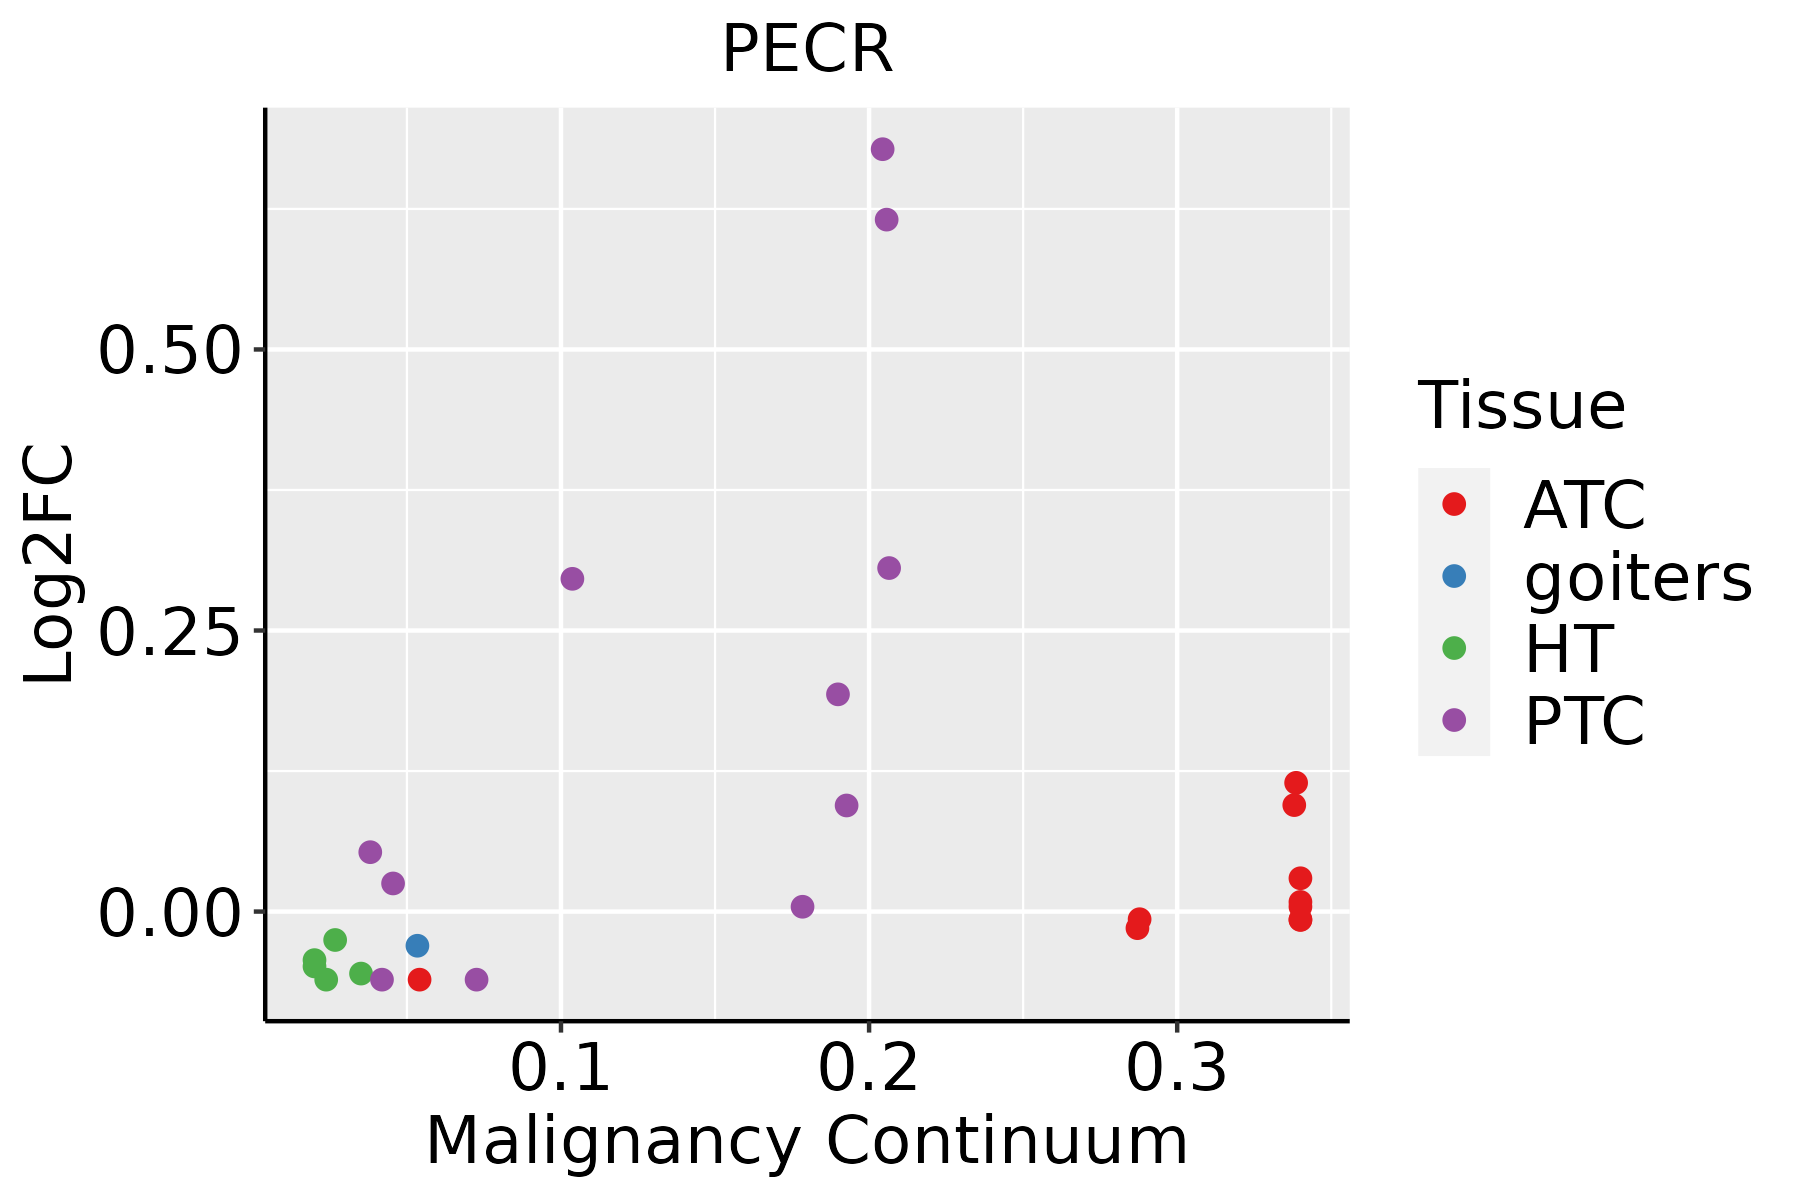 | ATC: Anaplastic thyroid cancer |
| HT: Hashimoto's thyroiditis | ||
| PTC: Papillary thyroid cancer |
| ∗log2FC in expression of this searched gene in stem-like cells from each diseased tissue sample relative to stem-like cells in normal samples in each tissue plotted against the malignancy continuum. Samples are colored based on if they are from different disease stage. |
Top |
Malignant transformation related pathway analysis |
| Find out the enriched GO biological processes and KEGG pathways involved in transition from healthy to precancer to cancer |
| Tissue | Disease Stage | Enriched GO biological Processes |
| Colorectum | AD |  |
| Colorectum | SER |  |
| Colorectum | MSS |  |
| Colorectum | MSI-H |  |
| Colorectum | FAP |  |
| ∗Top 15 enriched GO BP terms are showed in the bar plot of each disease state in each tissue. Each row represents a significant GO biological process which is colored according to the -log10(p.adjust). |
| Page: 1 2 3 4 5 6 7 8 9 |
| GO ID | Tissue | Disease Stage | Description | Gene Ratio | Bg Ratio | pvalue | p.adjust | Count |
| GO:000663112 | Liver | Cirrhotic | fatty acid metabolic process | 165/4634 | 390/18723 | 1.29e-14 | 1.26e-12 | 165 |
| GO:001605312 | Liver | Cirrhotic | organic acid biosynthetic process | 139/4634 | 316/18723 | 4.28e-14 | 3.83e-12 | 139 |
| GO:004639412 | Liver | Cirrhotic | carboxylic acid biosynthetic process | 137/4634 | 314/18723 | 1.40e-13 | 1.14e-11 | 137 |
| GO:000606612 | Liver | Cirrhotic | alcohol metabolic process | 141/4634 | 353/18723 | 1.57e-10 | 8.03e-09 | 141 |
| GO:007233011 | Liver | Cirrhotic | monocarboxylic acid biosynthetic process | 93/4634 | 214/18723 | 1.43e-09 | 6.16e-08 | 93 |
| GO:000663311 | Liver | Cirrhotic | fatty acid biosynthetic process | 70/4634 | 163/18723 | 2.57e-07 | 6.41e-06 | 70 |
| GO:00067202 | Liver | Cirrhotic | isoprenoid metabolic process | 46/4634 | 116/18723 | 2.71e-04 | 2.41e-03 | 46 |
| GO:00067212 | Liver | Cirrhotic | terpenoid metabolic process | 38/4634 | 97/18723 | 1.16e-03 | 7.89e-03 | 38 |
| GO:00343085 | Liver | Cirrhotic | primary alcohol metabolic process | 37/4634 | 102/18723 | 6.17e-03 | 3.07e-02 | 37 |
| GO:001605321 | Liver | HCC | organic acid biosynthetic process | 200/7958 | 316/18723 | 5.24e-14 | 3.22e-12 | 200 |
| GO:000663122 | Liver | HCC | fatty acid metabolic process | 238/7958 | 390/18723 | 8.24e-14 | 4.84e-12 | 238 |
| GO:004639421 | Liver | HCC | carboxylic acid biosynthetic process | 198/7958 | 314/18723 | 1.19e-13 | 6.78e-12 | 198 |
| GO:000606621 | Liver | HCC | alcohol metabolic process | 208/7958 | 353/18723 | 2.80e-10 | 9.50e-09 | 208 |
| GO:007233021 | Liver | HCC | monocarboxylic acid biosynthetic process | 129/7958 | 214/18723 | 1.08e-07 | 2.09e-06 | 129 |
| GO:000663321 | Liver | HCC | fatty acid biosynthetic process | 96/7958 | 163/18723 | 1.71e-05 | 1.85e-04 | 96 |
| GO:000672011 | Liver | HCC | isoprenoid metabolic process | 65/7958 | 116/18723 | 2.23e-03 | 1.11e-02 | 65 |
| GO:003430812 | Liver | HCC | primary alcohol metabolic process | 55/7958 | 102/18723 | 1.30e-02 | 4.67e-02 | 55 |
| Page: 1 |
| Pathway ID | Tissue | Disease Stage | Description | Gene Ratio | Bg Ratio | pvalue | p.adjust | qvalue | Count |
| hsa041462 | Liver | Cirrhotic | Peroxisome | 36/2530 | 82/8465 | 4.79e-03 | 1.74e-02 | 1.07e-02 | 36 |
| hsa041463 | Liver | Cirrhotic | Peroxisome | 36/2530 | 82/8465 | 4.79e-03 | 1.74e-02 | 1.07e-02 | 36 |
| hsa041464 | Liver | HCC | Peroxisome | 58/4020 | 82/8465 | 1.57e-05 | 1.05e-04 | 5.85e-05 | 58 |
| hsa041465 | Liver | HCC | Peroxisome | 58/4020 | 82/8465 | 1.57e-05 | 1.05e-04 | 5.85e-05 | 58 |
| Page: 1 |
Top |
Cell-cell communication analysis |
| Identification of potential cell-cell interactions between two cell types and their ligand-receptor pairs for different disease states |
| Ligand | Receptor | LRpair | Pathway | Tissue | Disease Stage |
| Page: 1 |
Top |
Single-cell gene regulatory network inference analysis |
| Find out the significant the regulons (TFs) and the target genes of each regulon across cell types for different disease states |
| TF | Cell Type | Tissue | Disease Stage | Target Gene | RSS | Regulon Activity |
| ∗The dot plots of a searched regulon are shown for all cell subpopulations in each disease state of each tissue based on the regulon specific score inferred using pySCENIC and by calculating the average expression. |
| Page: 1 |
Top |
Somatic mutation of malignant transformation related genes |
| Annotation of somatic variants for genes involved in malignant transformation |
| Hugo Symbol | Variant Class | Variant Classification | dbSNP RS | HGVSc | HGVSp | HGVSp Short | SWISSPROT | BIOTYPE | SIFT | PolyPhen | Tumor Sample Barcode | Tissue | Histology | Sex | Age | Stage | Therapy Types | Drugs | Outcome |
| PECR | insertion | Frame_Shift_Ins | novel | c.259-1_259insACTT | p.Val87ThrfsTer4 | p.V87Tfs*4 | Q9BY49 | protein_coding | TCGA-DJ-A3VK-01 | Thyroid | thyroid carcinoma | Male | <65 | III/IV | Unknown | Unknown | SD | ||
| PECR | insertion | In_Frame_Ins | novel | c.358_359insTGTACCAATTTACATTCCTAT | p.Ser120delinsMetTyrGlnPheThrPheLeuCys | p.S120delinsMYQFTFLC | Q9BY49 | protein_coding | TCGA-FY-A4B0-01 | Thyroid | thyroid carcinoma | Male | >=65 | I/II | Hormone Therapy | synthroid | SD |
| Page: 1 2 3 4 |
Top |
Related drugs of malignant transformation related genes |
| Identification of chemicals and drugs interact with genes involved in malignant transfromation |
| (DGIdb 4.0) |
| Entrez ID | Symbol | Category | Interaction Types | Drug Claim Name | Drug Name | PMIDs |
| Page: 1 |

Copyright 2023-Present -The University of Texas Health Science Center at Houston |