
|
|||||
|
 | |
| |
| |
| |
| |
| |
|
Gene: PDP2 |
Gene summary for PDP2 |
| Gene information | Species | Human | Gene symbol | PDP2 | Gene ID | 57546 |
| Gene name | pyruvate dehyrogenase phosphatase catalytic subunit 2 | |
| Gene Alias | PDPC 2 | |
| Cytomap | 16q22.1 | |
| Gene Type | protein-coding | GO ID | GO:0006464 | UniProtAcc | Q9P2J9 |
Top |
Malignant transformation analysis |
| Identification of the aberrant gene expression in precancerous and cancerous lesions by comparing the gene expression of stem-like cells in diseased tissues with normal stem cells |
| Entrez ID | Symbol | Replicates | Species | Organ | Tissue | Adj P-value | Log2FC | Malignancy |
| 57546 | PDP2 | HCC1_Meng | Human | Liver | HCC | 9.99e-11 | 1.12e-02 | 0.0246 |
| 57546 | PDP2 | HCC1 | Human | Liver | HCC | 1.52e-17 | 1.90e+00 | 0.5336 |
| 57546 | PDP2 | HCC2 | Human | Liver | HCC | 4.28e-40 | 3.39e+00 | 0.5341 |
| 57546 | PDP2 | HCC5 | Human | Liver | HCC | 1.83e-33 | 2.52e+00 | 0.4932 |
| 57546 | PDP2 | S028 | Human | Liver | HCC | 1.69e-11 | 3.53e-01 | 0.2503 |
| 57546 | PDP2 | S029 | Human | Liver | HCC | 3.16e-02 | 1.84e-01 | 0.2581 |
| Page: 1 |
| Tissue | Expression Dynamics | Abbreviation |
| Liver | 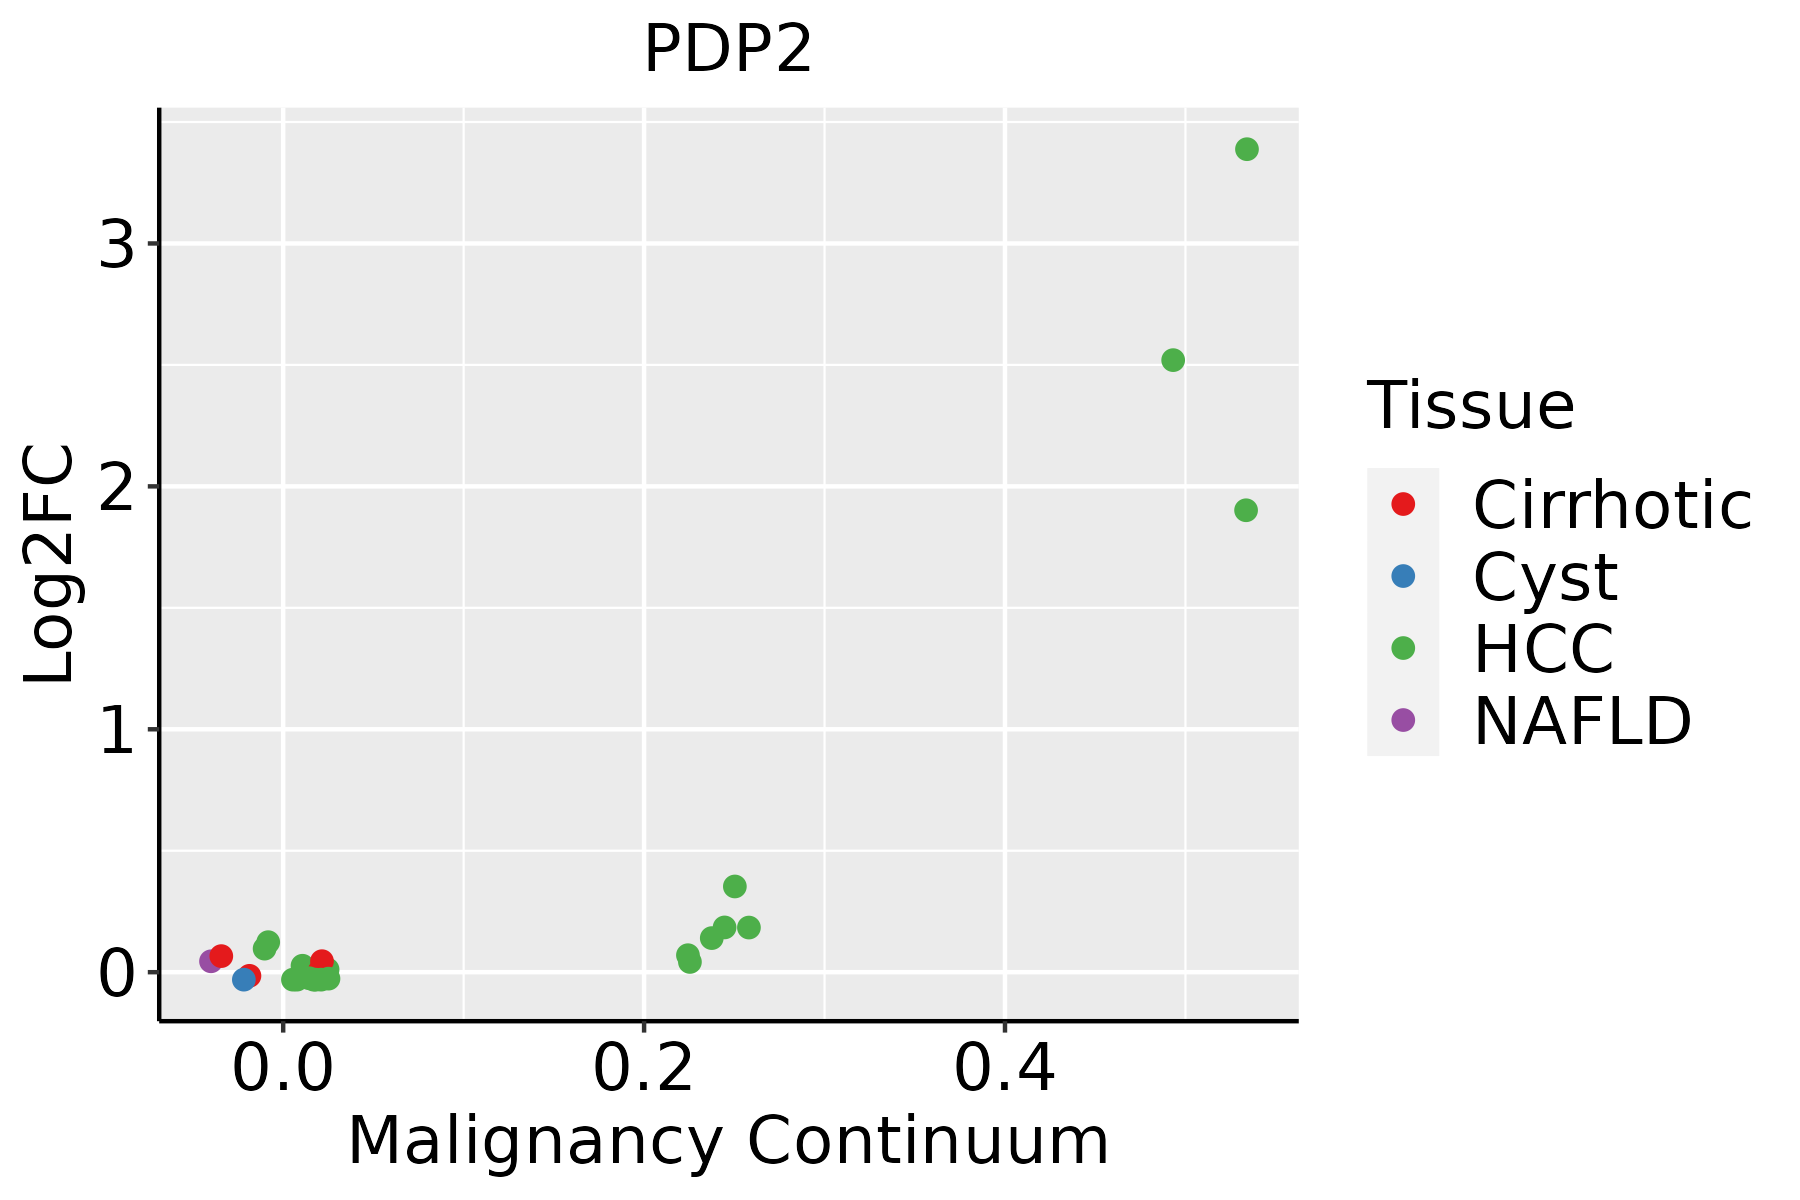 | HCC: Hepatocellular carcinoma |
| NAFLD: Non-alcoholic fatty liver disease |
| ∗log2FC in expression of this searched gene in stem-like cells from each diseased tissue sample relative to stem-like cells in normal samples in each tissue plotted against the malignancy continuum. Samples are colored based on if they are from different disease stage. |
Top |
Malignant transformation related pathway analysis |
| Find out the enriched GO biological processes and KEGG pathways involved in transition from healthy to precancer to cancer |
| Tissue | Disease Stage | Enriched GO biological Processes |
| Colorectum | AD |  |
| Colorectum | SER |  |
| Colorectum | MSS |  |
| Colorectum | MSI-H |  |
| Colorectum | FAP |  |
| ∗Top 15 enriched GO BP terms are showed in the bar plot of each disease state in each tissue. Each row represents a significant GO biological process which is colored according to the -log10(p.adjust). |
| Page: 1 2 3 4 5 6 7 8 9 |
| GO ID | Tissue | Disease Stage | Description | Gene Ratio | Bg Ratio | pvalue | p.adjust | Count |
| GO:001631121 | Liver | HCC | dephosphorylation | 230/7958 | 417/18723 | 1.00e-07 | 1.96e-06 | 230 |
| GO:000647021 | Liver | HCC | protein dephosphorylation | 162/7958 | 281/18723 | 1.91e-07 | 3.46e-06 | 162 |
| Page: 1 |
| Pathway ID | Tissue | Disease Stage | Description | Gene Ratio | Bg Ratio | pvalue | p.adjust | qvalue | Count |
| Page: 1 |
Top |
Cell-cell communication analysis |
| Identification of potential cell-cell interactions between two cell types and their ligand-receptor pairs for different disease states |
| Ligand | Receptor | LRpair | Pathway | Tissue | Disease Stage |
| Page: 1 |
Top |
Single-cell gene regulatory network inference analysis |
| Find out the significant the regulons (TFs) and the target genes of each regulon across cell types for different disease states |
| TF | Cell Type | Tissue | Disease Stage | Target Gene | RSS | Regulon Activity |
| ∗The dot plots of a searched regulon are shown for all cell subpopulations in each disease state of each tissue based on the regulon specific score inferred using pySCENIC and by calculating the average expression. |
| Page: 1 |
Top |
Somatic mutation of malignant transformation related genes |
| Annotation of somatic variants for genes involved in malignant transformation |
| Hugo Symbol | Variant Class | Variant Classification | dbSNP RS | HGVSc | HGVSp | HGVSp Short | SWISSPROT | BIOTYPE | SIFT | PolyPhen | Tumor Sample Barcode | Tissue | Histology | Sex | Age | Stage | Therapy Types | Drugs | Outcome |
| PDP2 | SNV | Missense_Mutation | c.710N>T | p.Arg237Ile | p.R237I | Q9P2J9 | protein_coding | deleterious(0) | probably_damaging(1) | TCGA-05-5425-01 | Lung | lung adenocarcinoma | Male | >=65 | I/II | Targeted Molecular therapy | gefitinib | PD | |
| PDP2 | SNV | Missense_Mutation | rs376435687 | c.289N>A | p.Asp97Asn | p.D97N | Q9P2J9 | protein_coding | tolerated(0.16) | benign(0.003) | TCGA-97-8547-01 | Lung | lung adenocarcinoma | Female | >=65 | III/IV | Chemotherapy | taxol | CR |
| PDP2 | SNV | Missense_Mutation | c.371N>C | p.Arg124Pro | p.R124P | Q9P2J9 | protein_coding | deleterious(0) | possibly_damaging(0.88) | TCGA-22-4601-01 | Lung | lung squamous cell carcinoma | Female | >=65 | III/IV | Unknown | Unknown | PD | |
| PDP2 | SNV | Missense_Mutation | c.116N>T | p.Trp39Leu | p.W39L | Q9P2J9 | protein_coding | tolerated_low_confidence(0.13) | benign(0) | TCGA-22-5472-01 | Lung | lung squamous cell carcinoma | Male | >=65 | I/II | Chemotherapy | carboplatin | PD | |
| PDP2 | SNV | Missense_Mutation | c.13G>T | p.Val5Leu | p.V5L | Q9P2J9 | protein_coding | tolerated_low_confidence(0.06) | benign(0.001) | TCGA-85-6175-01 | Lung | lung squamous cell carcinoma | Female | <65 | I/II | Unknown | Unknown | PD | |
| PDP2 | SNV | Missense_Mutation | novel | c.1112A>C | p.Glu371Ala | p.E371A | Q9P2J9 | protein_coding | tolerated(0.5) | benign(0.155) | TCGA-85-6798-01 | Lung | lung squamous cell carcinoma | Male | <65 | III/IV | Chemotherapy | etoposide | PD |
| PDP2 | deletion | Frame_Shift_Del | c.1347delG | p.Leu450SerfsTer25 | p.L450Sfs*25 | Q9P2J9 | protein_coding | TCGA-MP-A4SV-01 | Lung | lung adenocarcinoma | Male | >=65 | I/II | Unknown | Unknown | SD | |||
| PDP2 | SNV | Missense_Mutation | c.856N>A | p.Asp286Asn | p.D286N | Q9P2J9 | protein_coding | deleterious(0) | probably_damaging(1) | TCGA-EJ-5519-01 | Prostate | prostate adenocarcinoma | Male | <65 | 8 | Unknown | Unknown | SD | |
| PDP2 | SNV | Missense_Mutation | c.920N>A | p.Arg307His | p.R307H | Q9P2J9 | protein_coding | tolerated(0.56) | benign(0.005) | TCGA-BR-8382-01 | Stomach | stomach adenocarcinoma | Female | >=65 | III/IV | Unknown | Unknown | SD | |
| PDP2 | SNV | Missense_Mutation | c.219T>G | p.Phe73Leu | p.F73L | Q9P2J9 | protein_coding | tolerated(0.32) | benign(0.007) | TCGA-BR-8680-01 | Stomach | stomach adenocarcinoma | Male | <65 | III/IV | Chemotherapy | oxaliplatin | CR |
| Page: 1 2 3 4 5 |
Top |
Related drugs of malignant transformation related genes |
| Identification of chemicals and drugs interact with genes involved in malignant transfromation |
| (DGIdb 4.0) |
| Entrez ID | Symbol | Category | Interaction Types | Drug Claim Name | Drug Name | PMIDs |
| Page: 1 |

Copyright 2023-Present -The University of Texas Health Science Center at Houston |