| Tissue | Expression Dynamics | Abbreviation |
| Cervix | 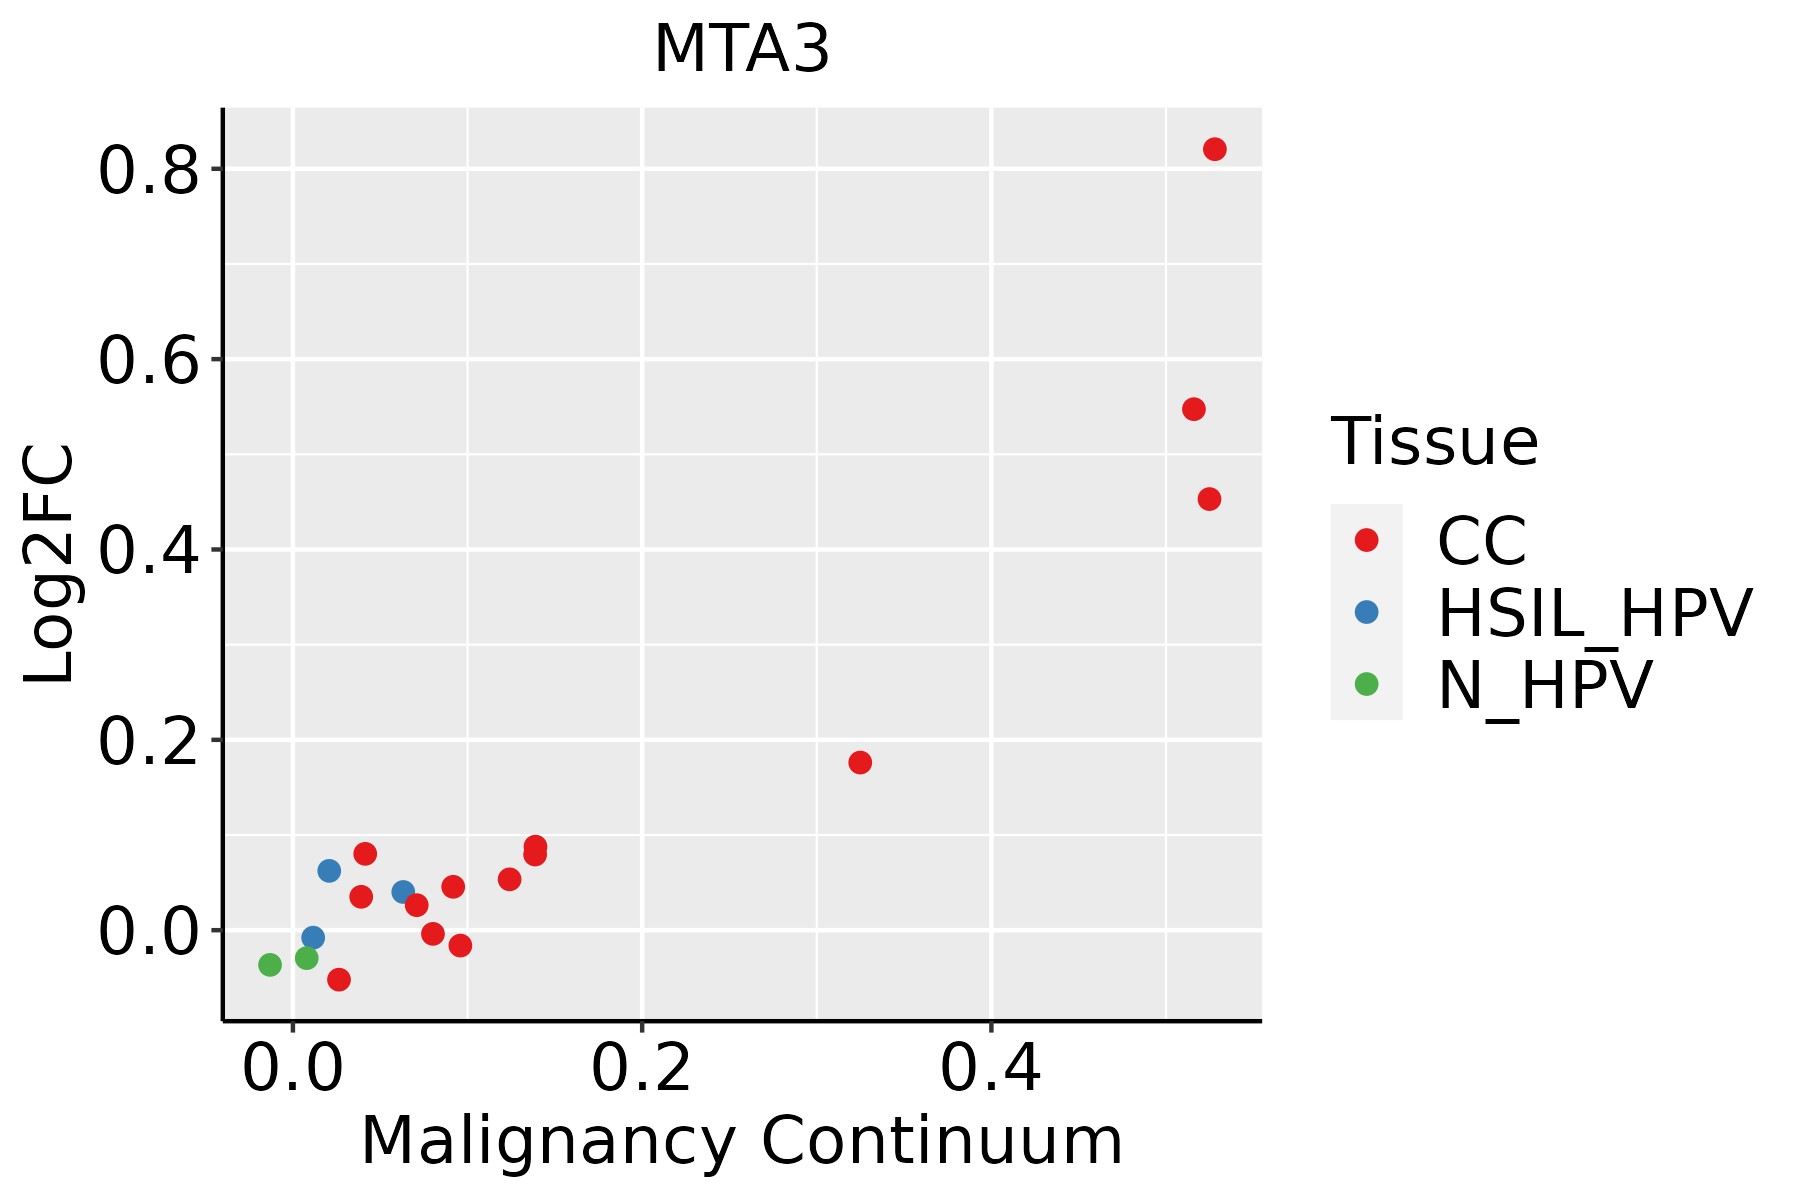 | CC: Cervix cancer |
| HSIL_HPV: HPV-infected high-grade squamous intraepithelial lesions |
| N_HPV: HPV-infected normal cervix |
| Colorectum (GSE201348) |  | FAP: Familial adenomatous polyposis |
| CRC: Colorectal cancer |
| Colorectum (HTA11) | 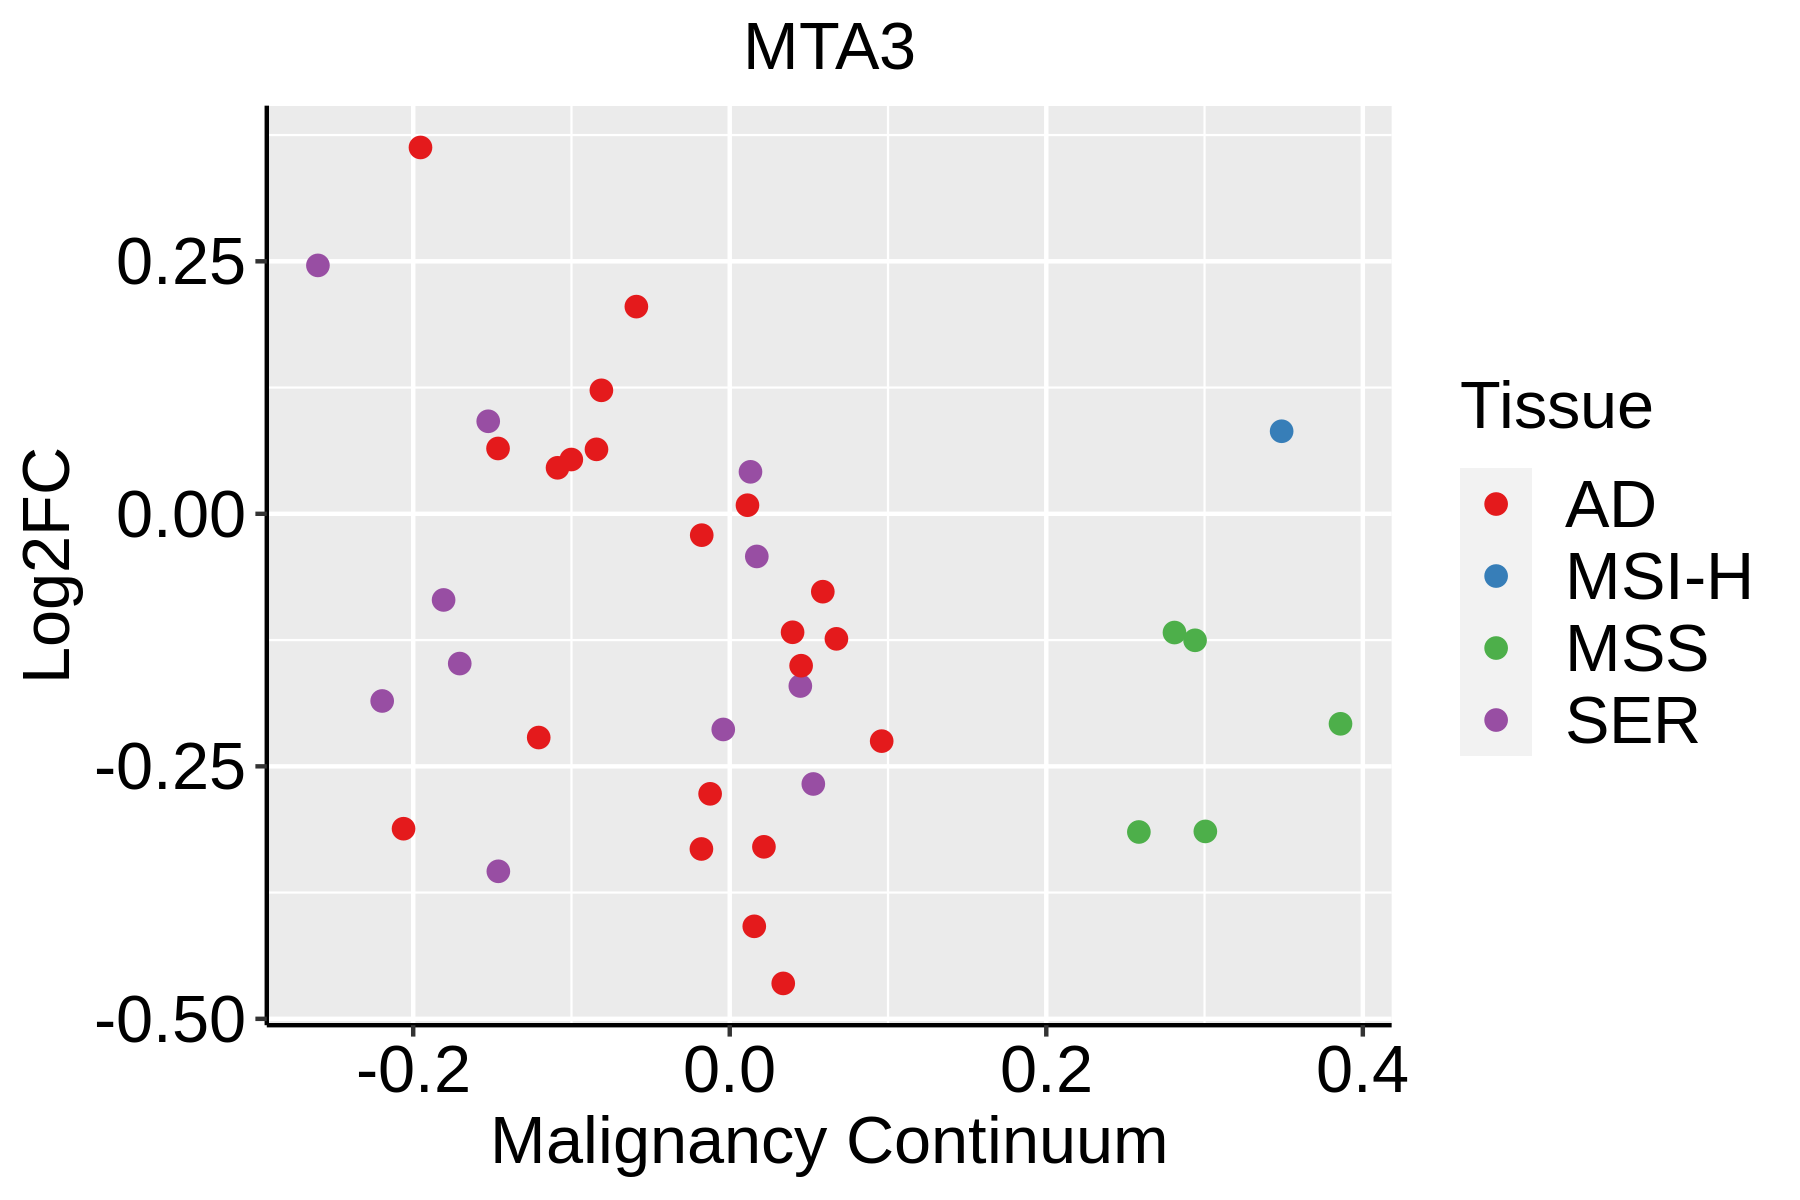 | AD: Adenomas |
| SER: Sessile serrated lesions |
| MSI-H: Microsatellite-high colorectal cancer |
| MSS: Microsatellite stable colorectal cancer |
| Endometrium | 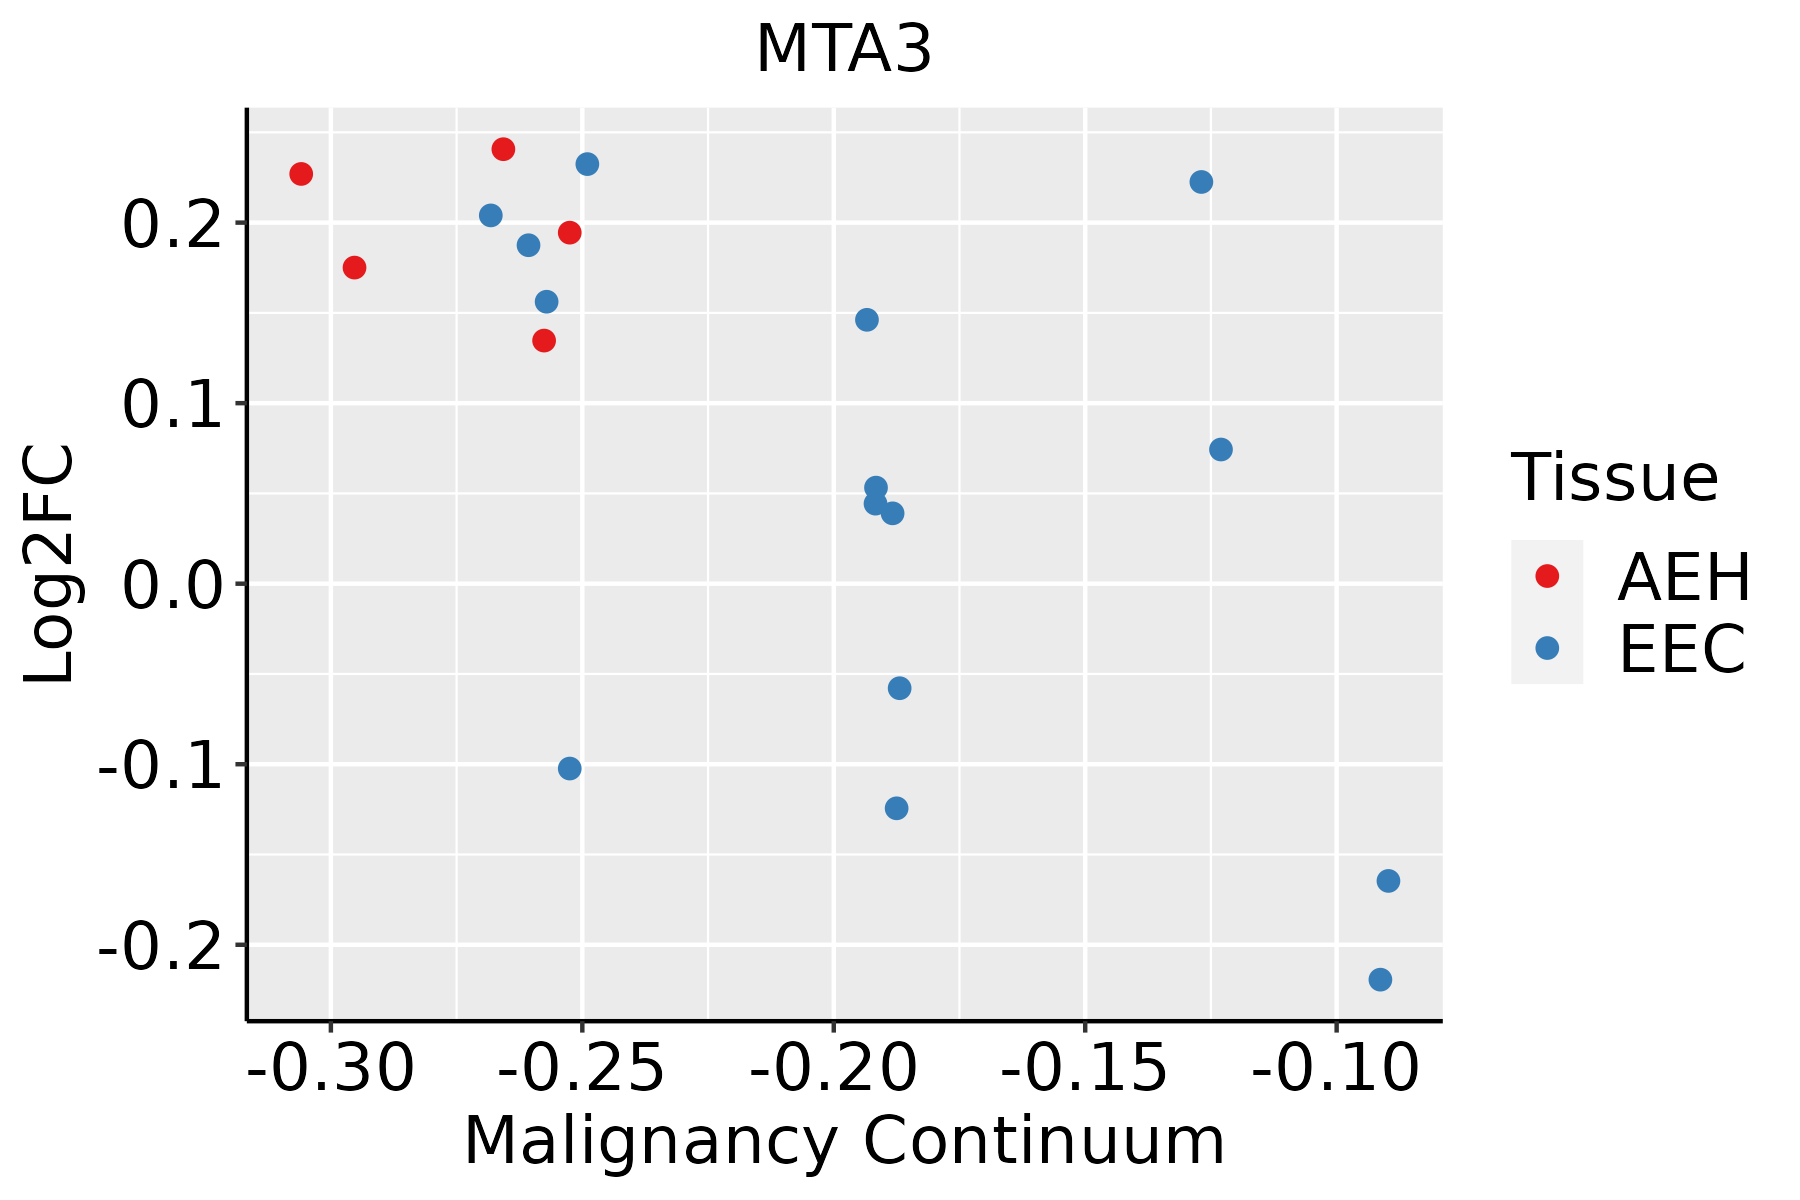 | AEH: Atypical endometrial hyperplasia |
| EEC: Endometrioid Cancer |
| Esophagus | 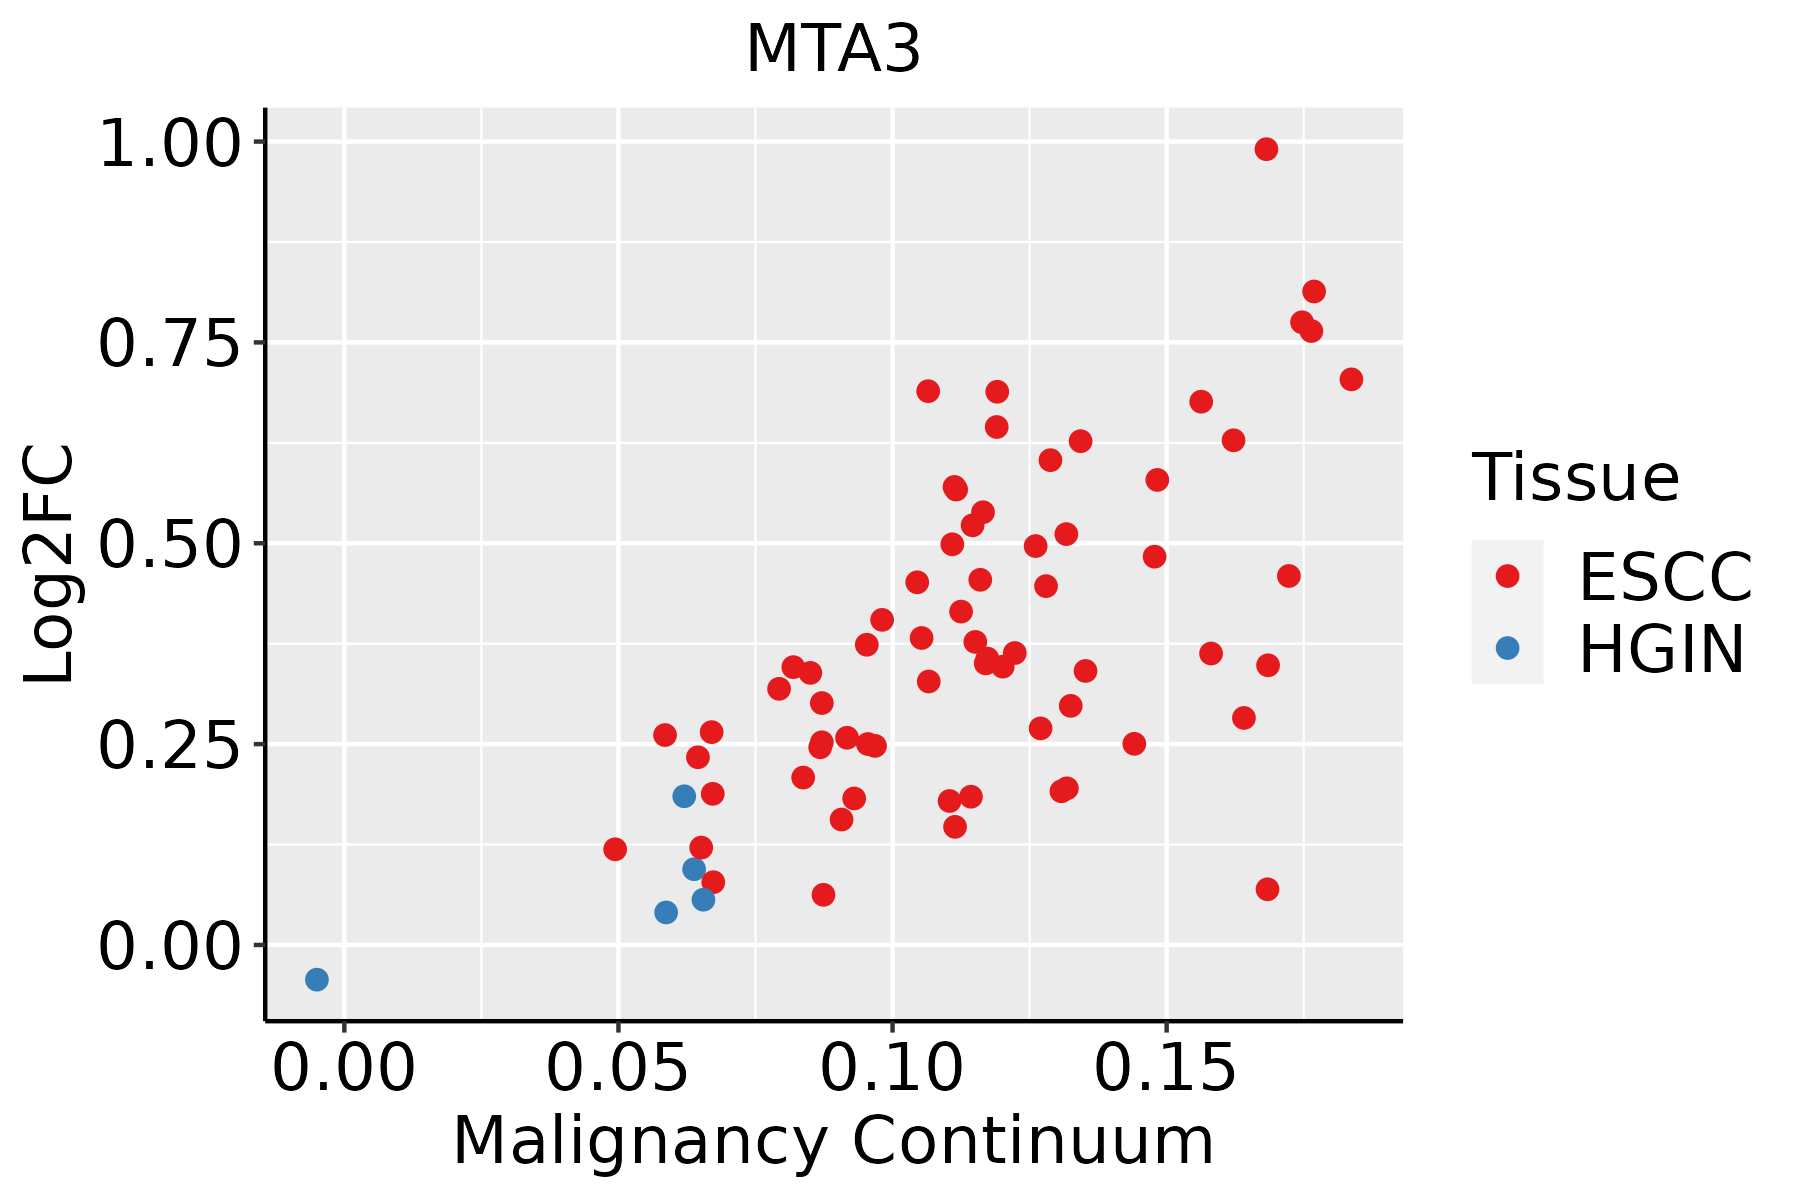 | ESCC: Esophageal squamous cell carcinoma |
| HGIN: High-grade intraepithelial neoplasias |
| LGIN: Low-grade intraepithelial neoplasias |
| Lung |  | AAH: Atypical adenomatous hyperplasia |
| AIS: Adenocarcinoma in situ |
| IAC: Invasive lung adenocarcinoma |
| MIA: Minimally invasive adenocarcinoma |
| Oral Cavity |  | EOLP: Erosive Oral lichen planus |
| LP: leukoplakia |
| NEOLP: Non-erosive oral lichen planus |
| OSCC: Oral squamous cell carcinoma |
| GO ID | Tissue | Disease Stage | Description | Gene Ratio | Bg Ratio | pvalue | p.adjust | Count |
| GO:00447725 | Cervix | CC | mitotic cell cycle phase transition | 89/2311 | 424/18723 | 2.70e-07 | 1.12e-05 | 89 |
| GO:00457876 | Cervix | CC | positive regulation of cell cycle | 66/2311 | 313/18723 | 7.78e-06 | 1.81e-04 | 66 |
| GO:00073466 | Cervix | CC | regulation of mitotic cell cycle | 88/2311 | 457/18723 | 1.26e-05 | 2.60e-04 | 88 |
| GO:19019903 | Cervix | CC | regulation of mitotic cell cycle phase transition | 63/2311 | 299/18723 | 1.27e-05 | 2.60e-04 | 63 |
| GO:00459316 | Cervix | CC | positive regulation of mitotic cell cycle | 32/2311 | 121/18723 | 1.88e-05 | 3.47e-04 | 32 |
| GO:19019922 | Cervix | CC | positive regulation of mitotic cell cycle phase transition | 26/2311 | 93/18723 | 3.97e-05 | 6.18e-04 | 26 |
| GO:00900685 | Cervix | CC | positive regulation of cell cycle process | 50/2311 | 236/18723 | 8.25e-05 | 1.11e-03 | 50 |
| GO:19019873 | Cervix | CC | regulation of cell cycle phase transition | 74/2311 | 390/18723 | 9.80e-05 | 1.27e-03 | 74 |
| GO:00165705 | Cervix | CC | histone modification | 84/2311 | 463/18723 | 1.70e-04 | 2.01e-03 | 84 |
| GO:19019892 | Cervix | CC | positive regulation of cell cycle phase transition | 28/2311 | 115/18723 | 2.82e-04 | 3.07e-03 | 28 |
| GO:1902751 | Cervix | CC | positive regulation of cell cycle G2/M phase transition | 11/2311 | 30/18723 | 5.71e-04 | 5.45e-03 | 11 |
| GO:0010971 | Cervix | CC | positive regulation of G2/M transition of mitotic cell cycle | 10/2311 | 27/18723 | 9.25e-04 | 7.84e-03 | 10 |
| GO:00448392 | Cervix | CC | cell cycle G2/M phase transition | 31/2311 | 148/18723 | 2.07e-03 | 1.51e-02 | 31 |
| GO:00000862 | Cervix | CC | G2/M transition of mitotic cell cycle | 29/2311 | 137/18723 | 2.40e-03 | 1.70e-02 | 29 |
| GO:0007346 | Colorectum | AD | regulation of mitotic cell cycle | 119/3918 | 457/18723 | 4.60e-03 | 3.14e-02 | 119 |
| GO:0045787 | Colorectum | AD | positive regulation of cell cycle | 85/3918 | 313/18723 | 4.76e-03 | 3.22e-02 | 85 |
| GO:0045931 | Colorectum | AD | positive regulation of mitotic cell cycle | 37/3918 | 121/18723 | 7.88e-03 | 4.73e-02 | 37 |
| GO:0016570 | Colorectum | MSS | histone modification | 113/3467 | 463/18723 | 8.37e-04 | 8.68e-03 | 113 |
| GO:00457871 | Colorectum | MSS | positive regulation of cell cycle | 80/3467 | 313/18723 | 1.15e-03 | 1.12e-02 | 80 |
| GO:00073461 | Colorectum | MSS | regulation of mitotic cell cycle | 108/3467 | 457/18723 | 3.30e-03 | 2.50e-02 | 108 |
| TF | Cell Type | Tissue | Disease Stage | Target Gene | RSS | Regulon Activity |
| MTA3 | TUF | Colorectum | FAP | IGSF3,BMX,NAV2, etc. | 1.21e-01 |  |
| MTA3 | GC | Colorectum | ADJ | S100Z,CUX1,RAPGEF5, etc. | 2.84e-01 |  |
| MTA3 | GC | Colorectum | CRC | S100Z,CUX1,RAPGEF5, etc. | 6.82e-02 |  |
| MTA3 | GC | Colorectum | FAP | S100Z,CUX1,RAPGEF5, etc. | 2.11e-01 | |
| MTA3 | INMON | Esophagus | ESCC | C9orf47,IPO8,IFI27, etc. | 9.90e-02 |  |
| MTA3 | CHO | Liver | Healthy | KREMEN1,C12orf10,PRRC1, etc. | 2.35e-01 |  |
| MTA3 | MAST | Lung | IAC | AC018362.1,PLEK2,FCER1A, etc. | 3.96e-02 |  |
| MTA3 | CD8TEXP | Oral cavity | ADJ | NFIC,TTC21A,SGO1-AS1, etc. | 1.18e-02 |  |
| MTA3 | CD8TEXINT | Oral cavity | Healthy | NFIC,TTC21A,SGO1-AS1, etc. | 9.54e-03 |  |
| MTA3 | CD4TN | Oral cavity | Healthy | NFIC,TTC21A,SGO1-AS1, etc. | 1.58e-02 | |
| Hugo Symbol | Variant Class | Variant Classification | dbSNP RS | HGVSc | HGVSp | HGVSp Short | SWISSPROT | BIOTYPE | SIFT | PolyPhen | Tumor Sample Barcode | Tissue | Histology | Sex | Age | Stage | Therapy Types | Drugs | Outcome |
| MTA3 | SNV | Missense_Mutation | novel | c.852N>C | p.Glu284Asp | p.E284D | Q9BTC8 | protein_coding | tolerated(0.17) | probably_damaging(0.97) | TCGA-BS-A0UF-01 | Endometrium | uterine corpus endometrioid carcinoma | Female | >=65 | I/II | Unknown | Unknown | SD |
| MTA3 | SNV | Missense_Mutation | | c.1215N>G | p.Ile405Met | p.I405M | Q9BTC8 | protein_coding | deleterious(0.01) | benign(0.183) | TCGA-BS-A0UF-01 | Endometrium | uterine corpus endometrioid carcinoma | Female | >=65 | I/II | Unknown | Unknown | SD |
| MTA3 | SNV | Missense_Mutation | | c.1275N>T | p.Glu425Asp | p.E425D | Q9BTC8 | protein_coding | tolerated(0.26) | benign(0.003) | TCGA-D1-A103-01 | Endometrium | uterine corpus endometrioid carcinoma | Female | >=65 | I/II | Unknown | Unknown | SD |
| MTA3 | SNV | Missense_Mutation | novel | c.296C>A | p.Ser99Tyr | p.S99Y | Q9BTC8 | protein_coding | deleterious(0) | probably_damaging(0.999) | TCGA-DF-A2KU-01 | Endometrium | uterine corpus endometrioid carcinoma | Female | Unknown | I/II | Unknown | Unknown | SD |
| MTA3 | SNV | Missense_Mutation | novel | c.1738N>G | p.Ser580Gly | p.S580G | Q9BTC8 | protein_coding | tolerated_low_confidence(0.06) | benign(0.099) | TCGA-DI-A1BU-01 | Endometrium | uterine corpus endometrioid carcinoma | Female | <65 | I/II | Chemotherapy | paclitaxel | SD |
| MTA3 | SNV | Missense_Mutation | | c.922G>A | p.Glu308Lys | p.E308K | Q9BTC8 | protein_coding | deleterious(0.01) | possibly_damaging(0.626) | TCGA-E6-A1LX-01 | Endometrium | uterine corpus endometrioid carcinoma | Female | <65 | I/II | Unknown | Unknown | SD |
| MTA3 | SNV | Missense_Mutation | novel | c.697N>T | p.Thr233Ser | p.T233S | Q9BTC8 | protein_coding | deleterious(0.01) | probably_damaging(0.97) | TCGA-EY-A1GU-01 | Endometrium | uterine corpus endometrioid carcinoma | Female | >=65 | I/II | Unknown | Unknown | SD |
| MTA3 | SNV | Missense_Mutation | novel | c.238N>A | p.Asp80Asn | p.D80N | Q9BTC8 | protein_coding | deleterious(0.05) | benign(0.425) | TCGA-FI-A2D0-01 | Endometrium | uterine corpus endometrioid carcinoma | Female | <65 | I/II | Unknown | Unknown | SD |
| MTA3 | insertion | Frame_Shift_Ins | novel | c.1093_1094insTACGTAATAA | p.Gly365ValfsTer19 | p.G365Vfs*19 | Q9BTC8 | protein_coding | | | TCGA-B5-A11I-01 | Endometrium | uterine corpus endometrioid carcinoma | Female | >=65 | III/IV | Chemotherapy | paclitaxel | PD |
| MTA3 | SNV | Missense_Mutation | | c.1052N>T | p.Ser351Phe | p.S351F | Q9BTC8 | protein_coding | tolerated(0.16) | probably_damaging(0.915) | TCGA-55-8089-01 | Lung | lung adenocarcinoma | Male | <65 | I/II | Unknown | Unknown | SD |


