
|
|||||
|
 | |
| |
| |
| |
| |
| |
|
Gene: LRRC59 |
Gene summary for LRRC59 |
| Gene information | Species | Human | Gene symbol | LRRC59 | Gene ID | 55379 |
| Gene name | leucine rich repeat containing 59 | |
| Gene Alias | PRO1855 | |
| Cytomap | 17q21.33 | |
| Gene Type | protein-coding | GO ID | GO:0007154 | UniProtAcc | Q96AG4 |
Top |
Malignant transformation analysis |
| Identification of the aberrant gene expression in precancerous and cancerous lesions by comparing the gene expression of stem-like cells in diseased tissues with normal stem cells |
| Entrez ID | Symbol | Replicates | Species | Organ | Tissue | Adj P-value | Log2FC | Malignancy |
| 55379 | LRRC59 | GSM4909282 | Human | Breast | IDC | 1.11e-16 | -2.98e-01 | -0.0288 |
| 55379 | LRRC59 | GSM4909290 | Human | Breast | IDC | 5.08e-05 | 3.72e-01 | 0.2096 |
| 55379 | LRRC59 | GSM4909291 | Human | Breast | IDC | 8.06e-41 | 9.53e-01 | 0.1753 |
| 55379 | LRRC59 | GSM4909294 | Human | Breast | IDC | 2.09e-02 | -1.88e-01 | 0.2022 |
| 55379 | LRRC59 | GSM4909296 | Human | Breast | IDC | 4.89e-10 | -2.35e-01 | 0.1524 |
| 55379 | LRRC59 | GSM4909297 | Human | Breast | IDC | 3.91e-08 | -1.72e-01 | 0.1517 |
| 55379 | LRRC59 | GSM4909301 | Human | Breast | IDC | 3.33e-02 | -1.75e-01 | 0.1577 |
| 55379 | LRRC59 | GSM4909311 | Human | Breast | IDC | 3.27e-17 | -2.08e-01 | 0.1534 |
| 55379 | LRRC59 | GSM4909312 | Human | Breast | IDC | 1.68e-05 | 1.14e-02 | 0.1552 |
| 55379 | LRRC59 | GSM4909319 | Human | Breast | IDC | 4.90e-23 | -2.03e-01 | 0.1563 |
| 55379 | LRRC59 | GSM4909320 | Human | Breast | IDC | 2.12e-02 | -1.82e-01 | 0.1575 |
| 55379 | LRRC59 | GSM4909321 | Human | Breast | IDC | 5.81e-09 | -1.74e-01 | 0.1559 |
| 55379 | LRRC59 | brca1 | Human | Breast | Precancer | 3.54e-18 | 5.81e-01 | -0.0338 |
| 55379 | LRRC59 | brca2 | Human | Breast | Precancer | 2.04e-08 | 3.58e-01 | -0.024 |
| 55379 | LRRC59 | brca3 | Human | Breast | Precancer | 4.89e-07 | 2.89e-01 | -0.0263 |
| 55379 | LRRC59 | M2 | Human | Breast | IDC | 3.65e-03 | 2.56e-01 | 0.21 |
| 55379 | LRRC59 | NCCBC14 | Human | Breast | DCIS | 6.27e-04 | 1.61e-01 | 0.2021 |
| 55379 | LRRC59 | NCCBC3 | Human | Breast | DCIS | 1.66e-02 | -8.19e-02 | 0.1198 |
| 55379 | LRRC59 | P1 | Human | Breast | IDC | 9.22e-11 | 5.19e-02 | 0.1527 |
| 55379 | LRRC59 | P2 | Human | Breast | IDC | 4.79e-16 | 6.68e-01 | 0.21 |
| Page: 1 2 3 4 5 6 7 8 |
| Tissue | Expression Dynamics | Abbreviation |
| Breast | 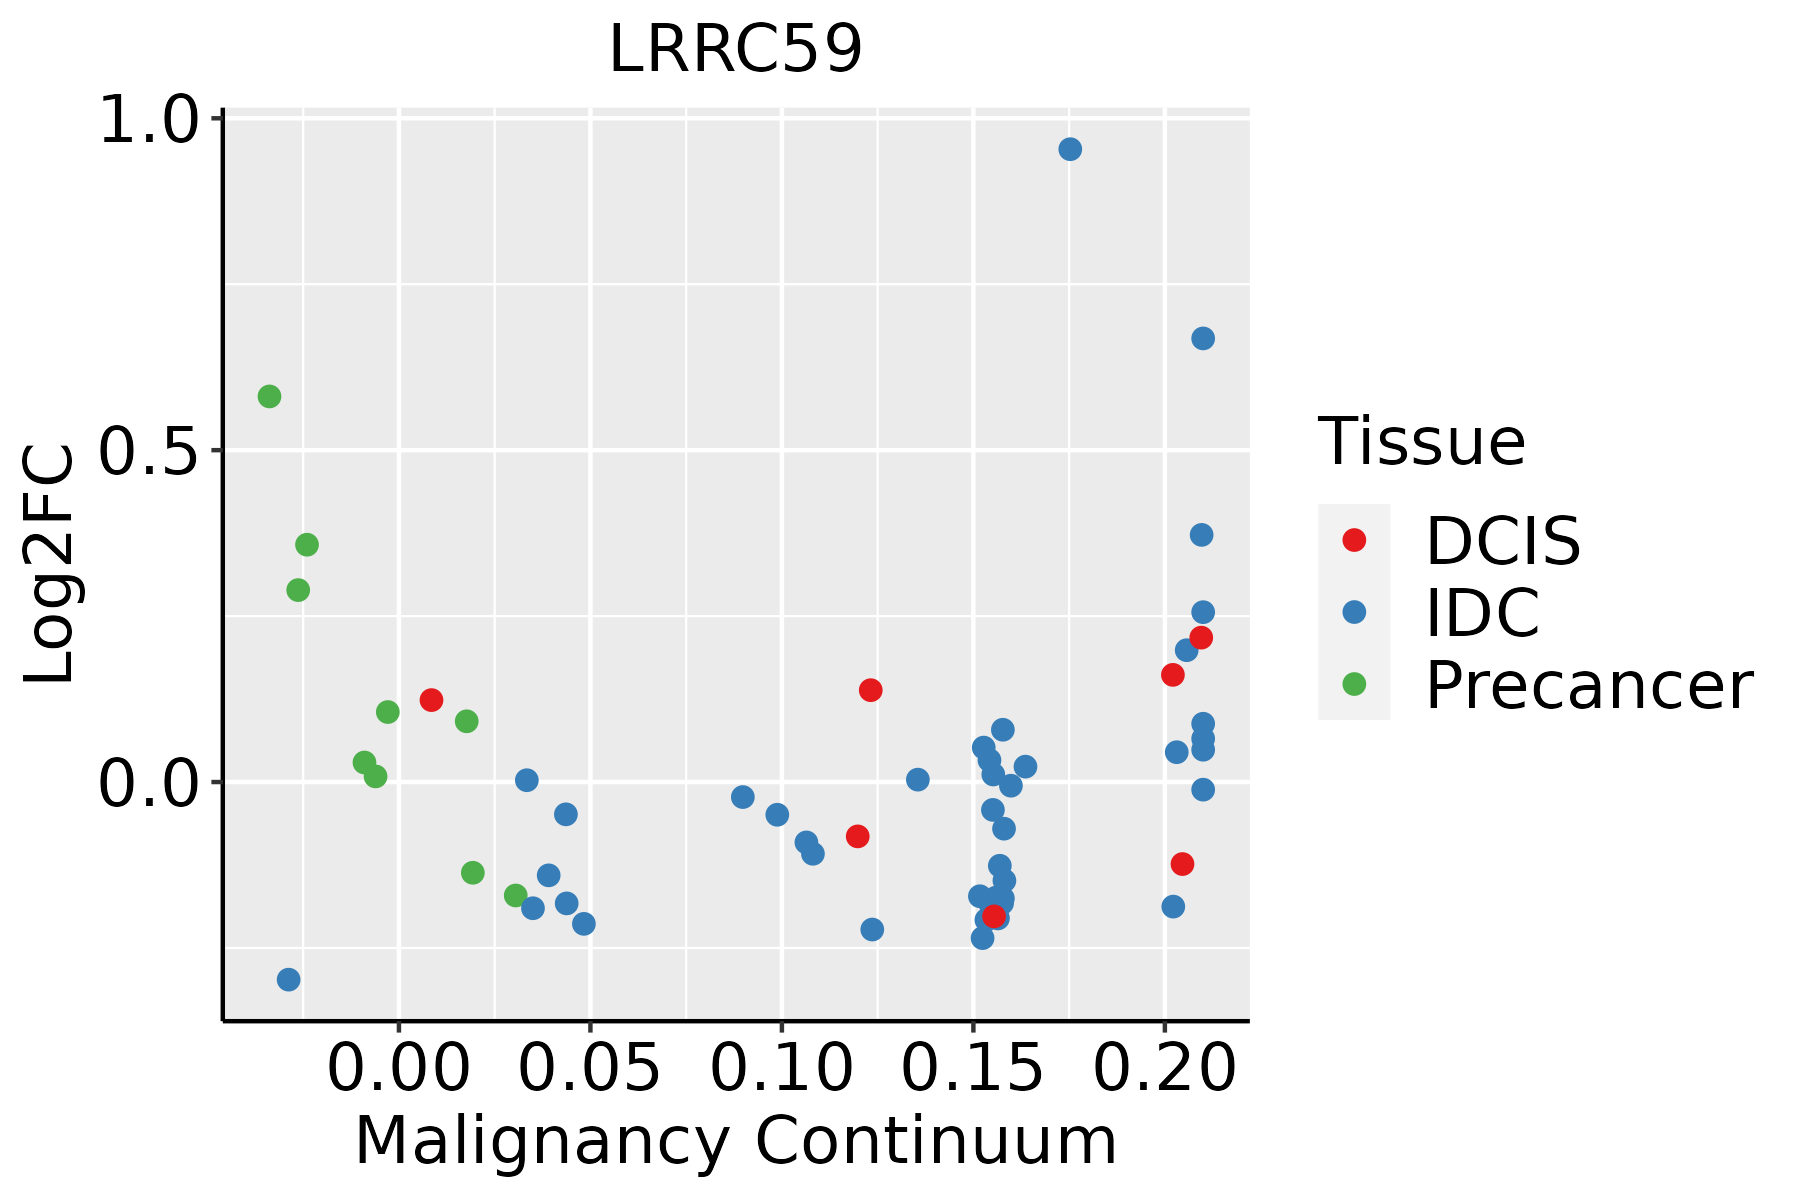 | IDC: Invasive ductal carcinoma |
| DCIS: Ductal carcinoma in situ | ||
| Precancer(BRCA1-mut): Precancerous lesion from BRCA1 mutation carriers | ||
| Esophagus |  | ESCC: Esophageal squamous cell carcinoma |
| HGIN: High-grade intraepithelial neoplasias | ||
| LGIN: Low-grade intraepithelial neoplasias | ||
| Liver |  | HCC: Hepatocellular carcinoma |
| NAFLD: Non-alcoholic fatty liver disease | ||
| Oral Cavity | 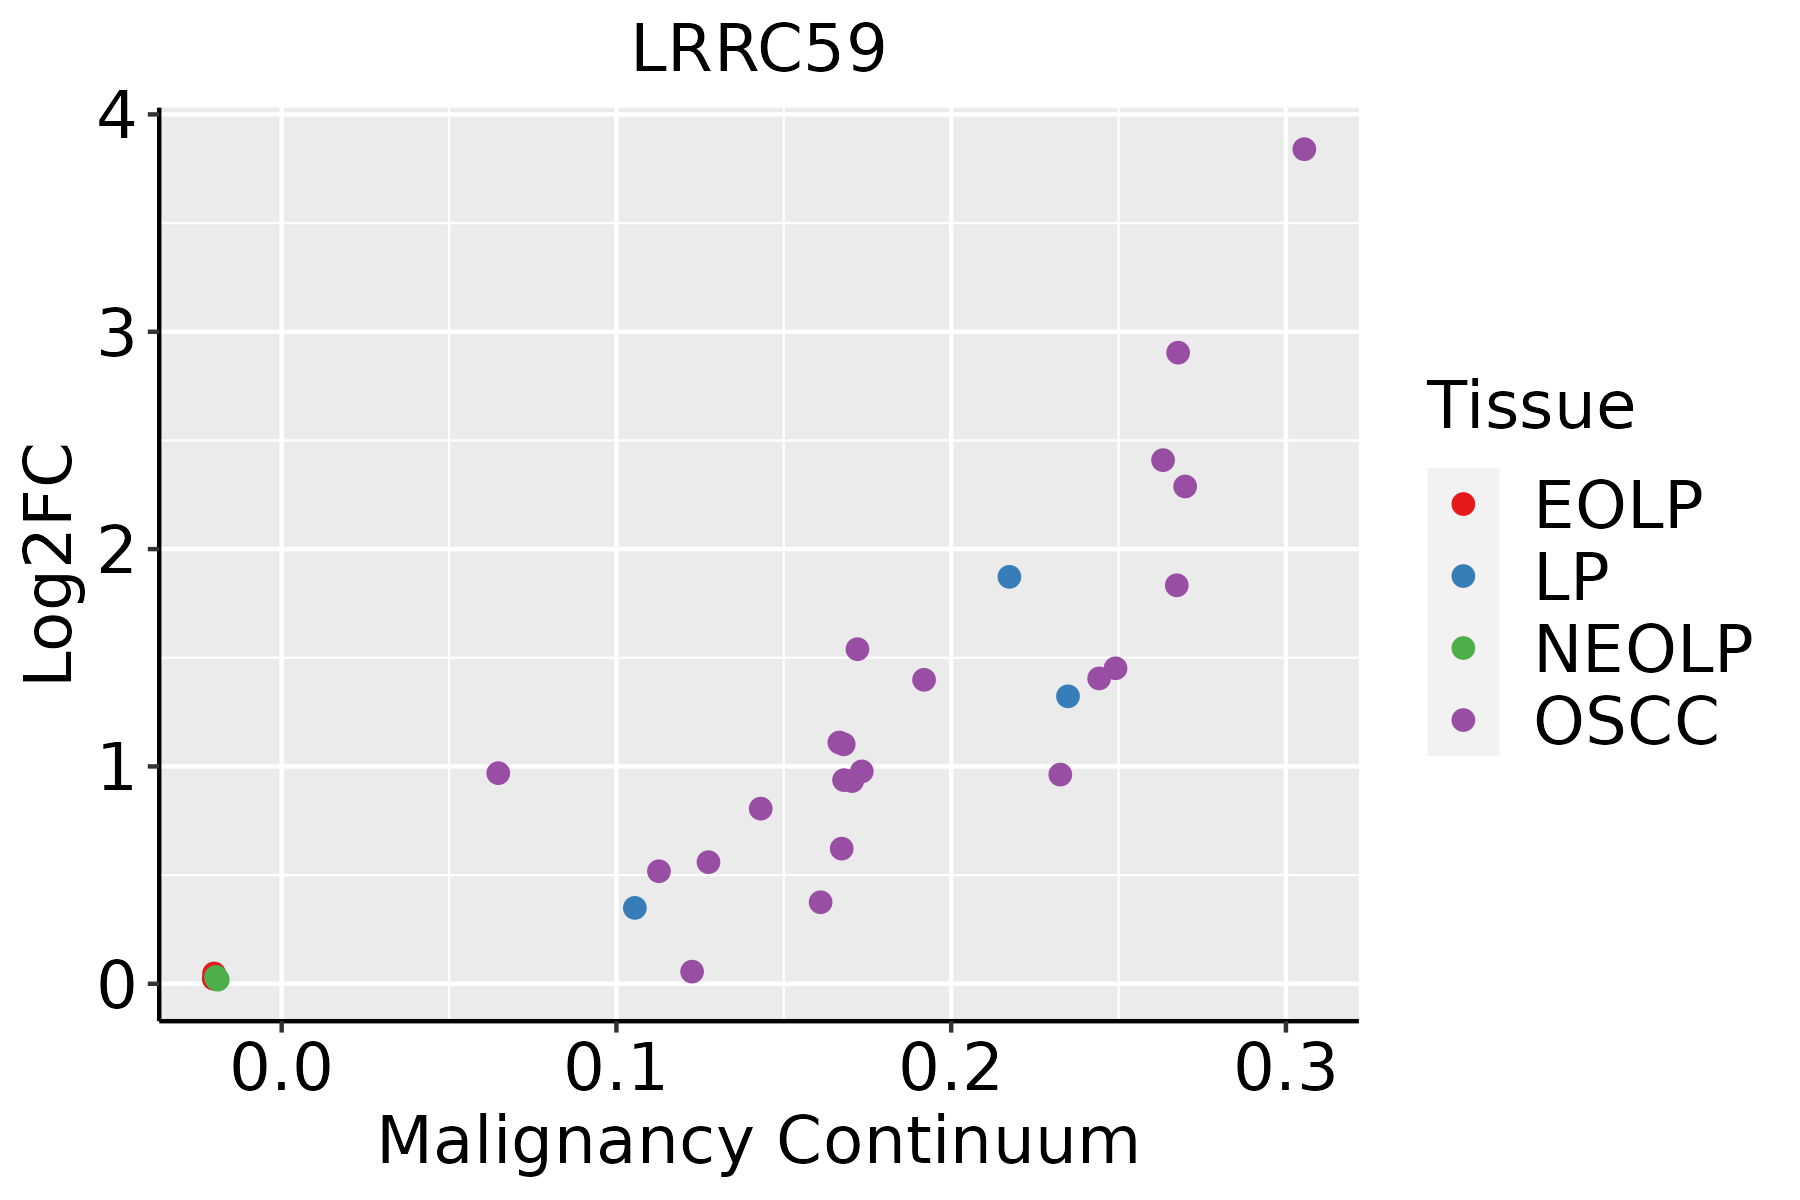 | EOLP: Erosive Oral lichen planus |
| LP: leukoplakia | ||
| NEOLP: Non-erosive oral lichen planus | ||
| OSCC: Oral squamous cell carcinoma | ||
| Prostate | 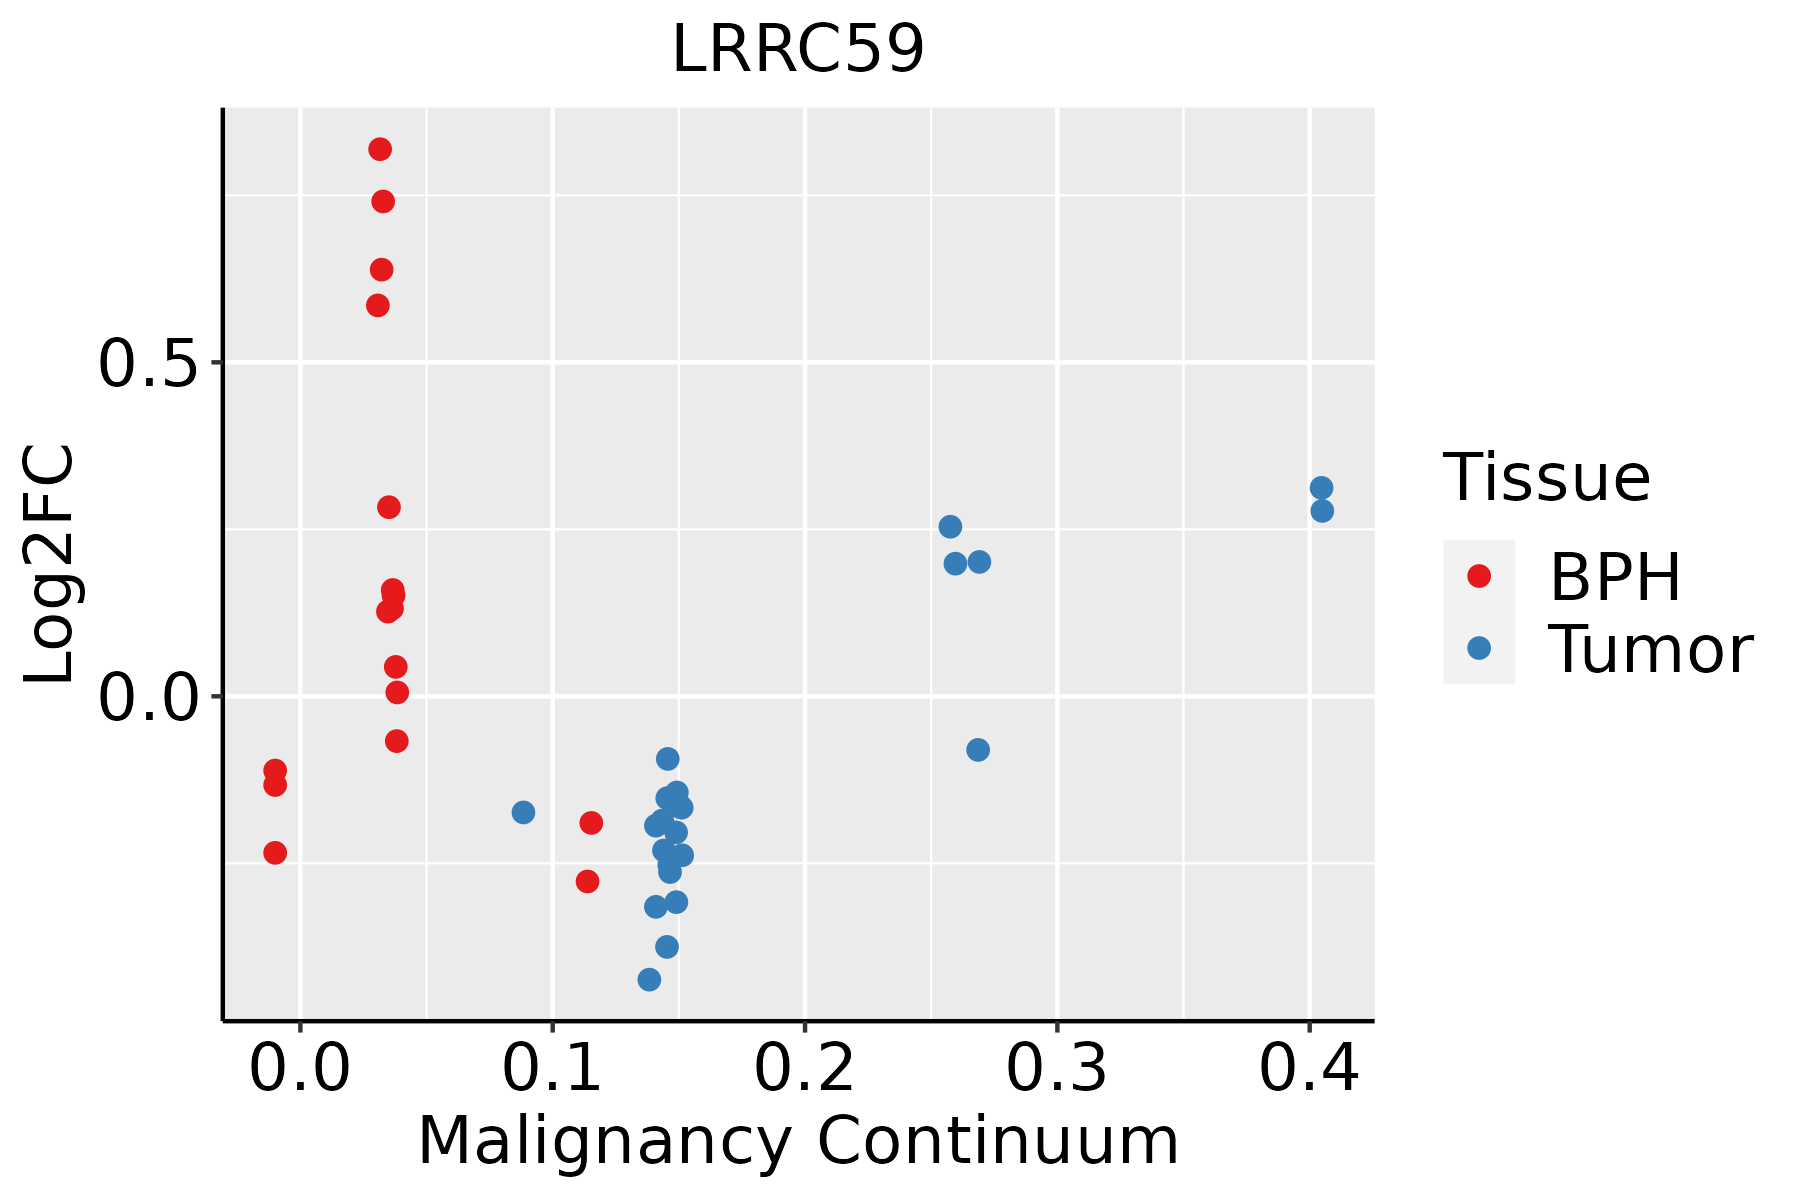 | BPH: Benign Prostatic Hyperplasia |
| Skin | 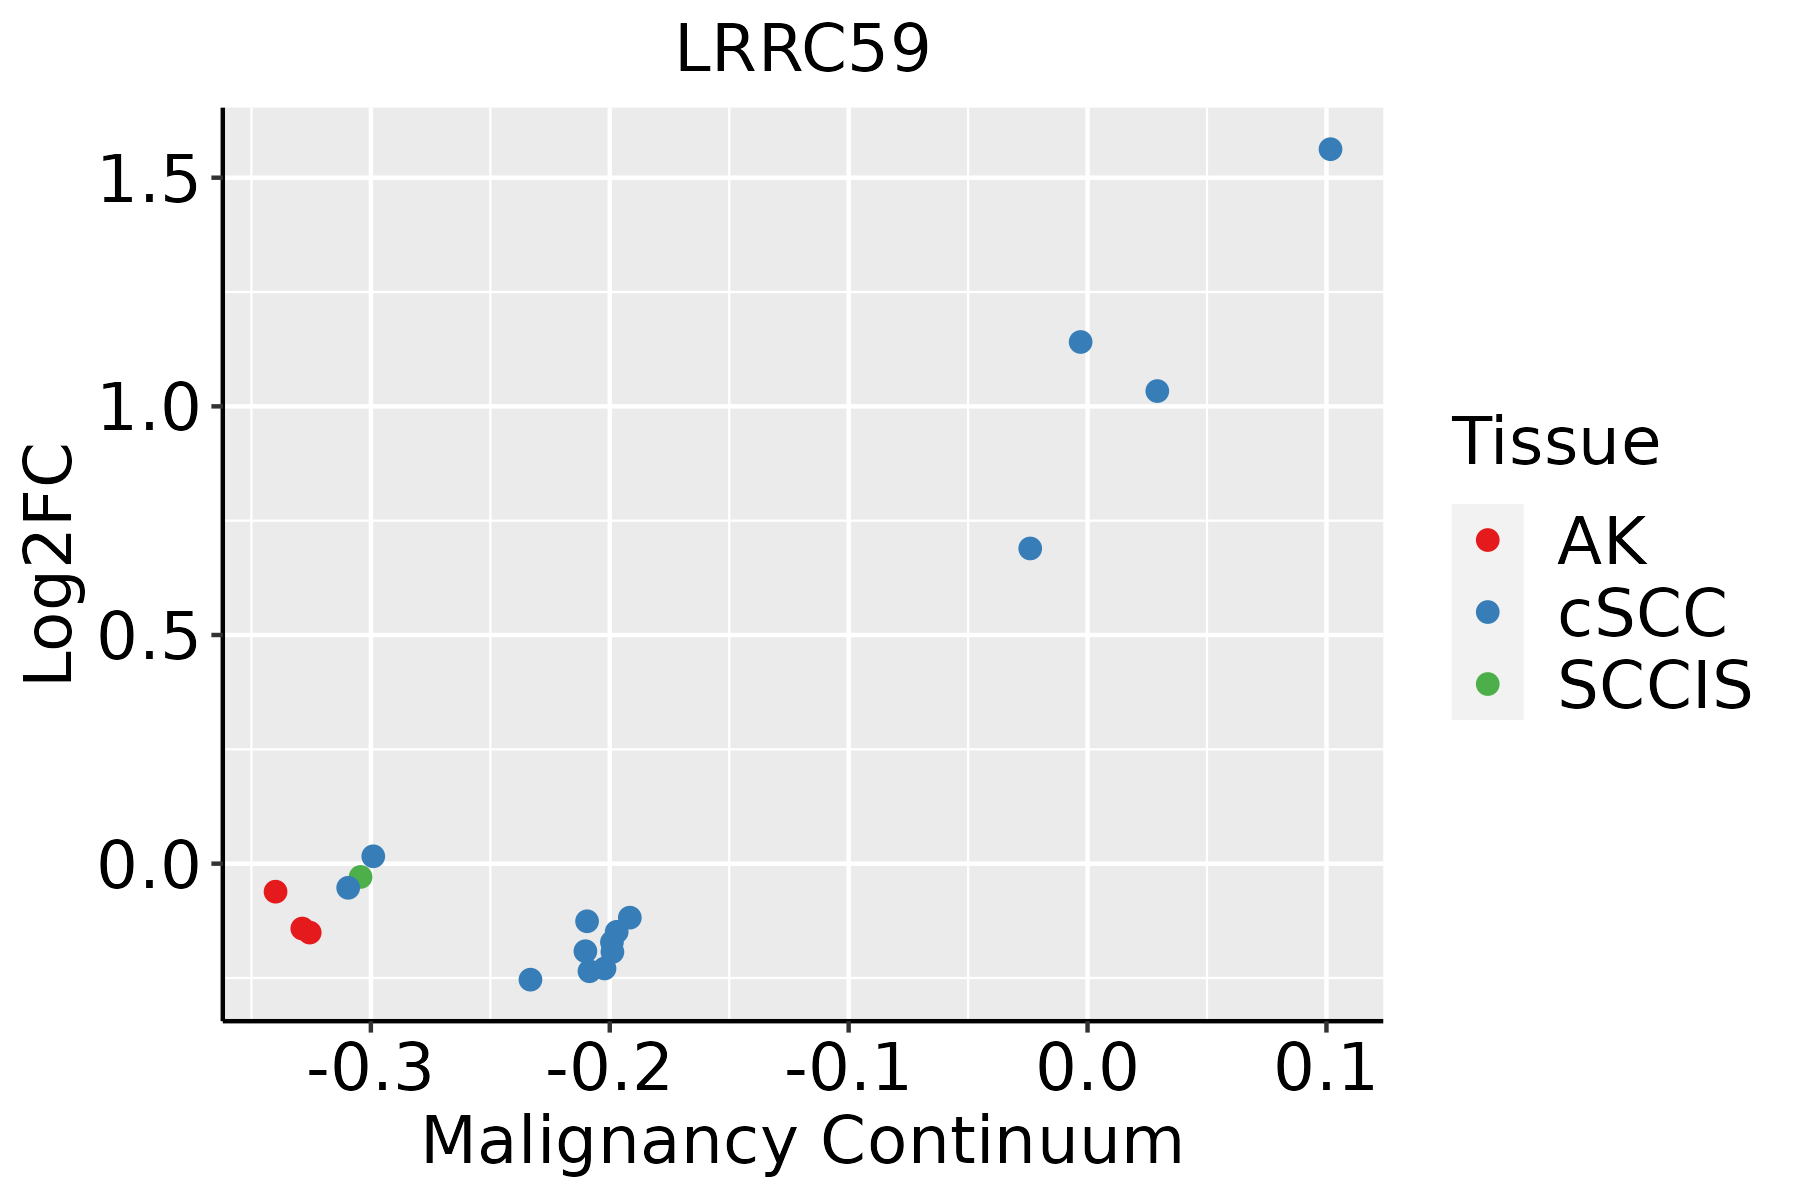 | AK: Actinic keratosis |
| cSCC: Cutaneous squamous cell carcinoma | ||
| SCCIS:squamous cell carcinoma in situ | ||
| Thyroid |  | ATC: Anaplastic thyroid cancer |
| HT: Hashimoto's thyroiditis | ||
| PTC: Papillary thyroid cancer |
| ∗log2FC in expression of this searched gene in stem-like cells from each diseased tissue sample relative to stem-like cells in normal samples in each tissue plotted against the malignancy continuum. Samples are colored based on if they are from different disease stage. |
Top |
Malignant transformation related pathway analysis |
| Find out the enriched GO biological processes and KEGG pathways involved in transition from healthy to precancer to cancer |
| Tissue | Disease Stage | Enriched GO biological Processes |
| Colorectum | AD |  |
| Colorectum | SER |  |
| Colorectum | MSS |  |
| Colorectum | MSI-H |  |
| Colorectum | FAP |  |
| ∗Top 15 enriched GO BP terms are showed in the bar plot of each disease state in each tissue. Each row represents a significant GO biological process which is colored according to the -log10(p.adjust). |
| Page: 1 2 3 4 5 6 7 8 9 |
| GO ID | Tissue | Disease Stage | Description | Gene Ratio | Bg Ratio | pvalue | p.adjust | Count |
| GO:000726510 | Esophagus | ESCC | Ras protein signal transduction | 201/8552 | 337/18723 | 1.44e-07 | 2.30e-06 | 201 |
| GO:00465789 | Esophagus | ESCC | regulation of Ras protein signal transduction | 106/8552 | 189/18723 | 2.49e-03 | 1.08e-02 | 106 |
| GO:005105610 | Esophagus | ESCC | regulation of small GTPase mediated signal transduction | 157/8552 | 302/18723 | 1.55e-02 | 4.98e-02 | 157 |
| GO:000726511 | Liver | Cirrhotic | Ras protein signal transduction | 119/4634 | 337/18723 | 8.16e-06 | 1.22e-04 | 119 |
| GO:000726521 | Liver | HCC | Ras protein signal transduction | 187/7958 | 337/18723 | 8.89e-07 | 1.35e-05 | 187 |
| GO:004657811 | Liver | HCC | regulation of Ras protein signal transduction | 100/7958 | 189/18723 | 2.42e-03 | 1.18e-02 | 100 |
| GO:00072659 | Oral cavity | OSCC | Ras protein signal transduction | 185/7305 | 337/18723 | 1.95e-09 | 4.60e-08 | 185 |
| GO:00465788 | Oral cavity | OSCC | regulation of Ras protein signal transduction | 90/7305 | 189/18723 | 9.58e-03 | 3.40e-02 | 90 |
| GO:000726515 | Oral cavity | LP | Ras protein signal transduction | 109/4623 | 337/18723 | 8.44e-04 | 7.36e-03 | 109 |
| GO:00072658 | Prostate | BPH | Ras protein signal transduction | 101/3107 | 337/18723 | 5.64e-10 | 2.79e-08 | 101 |
| GO:00510568 | Prostate | BPH | regulation of small GTPase mediated signal transduction | 78/3107 | 302/18723 | 2.69e-05 | 3.16e-04 | 78 |
| GO:00465787 | Prostate | BPH | regulation of Ras protein signal transduction | 53/3107 | 189/18723 | 5.08e-05 | 5.24e-04 | 53 |
| GO:0051057 | Prostate | BPH | positive regulation of small GTPase mediated signal transduction | 20/3107 | 72/18723 | 1.16e-02 | 4.70e-02 | 20 |
| GO:000726514 | Prostate | Tumor | Ras protein signal transduction | 101/3246 | 337/18723 | 6.29e-09 | 2.44e-07 | 101 |
| GO:005105613 | Prostate | Tumor | regulation of small GTPase mediated signal transduction | 80/3246 | 302/18723 | 3.96e-05 | 4.57e-04 | 80 |
| GO:004657814 | Prostate | Tumor | regulation of Ras protein signal transduction | 53/3246 | 189/18723 | 1.63e-04 | 1.46e-03 | 53 |
| GO:000726523 | Skin | cSCC | Ras protein signal transduction | 132/4864 | 337/18723 | 6.17e-08 | 1.57e-06 | 132 |
| GO:000726519 | Thyroid | PTC | Ras protein signal transduction | 162/5968 | 337/18723 | 3.16e-10 | 1.02e-08 | 162 |
| GO:005105617 | Thyroid | PTC | regulation of small GTPase mediated signal transduction | 132/5968 | 302/18723 | 9.26e-06 | 1.04e-04 | 132 |
| GO:004657817 | Thyroid | PTC | regulation of Ras protein signal transduction | 88/5968 | 189/18723 | 1.62e-05 | 1.70e-04 | 88 |
| Page: 1 2 |
| Pathway ID | Tissue | Disease Stage | Description | Gene Ratio | Bg Ratio | pvalue | p.adjust | qvalue | Count |
| Page: 1 |
Top |
Cell-cell communication analysis |
| Identification of potential cell-cell interactions between two cell types and their ligand-receptor pairs for different disease states |
| Ligand | Receptor | LRpair | Pathway | Tissue | Disease Stage |
| Page: 1 |
Top |
Single-cell gene regulatory network inference analysis |
| Find out the significant the regulons (TFs) and the target genes of each regulon across cell types for different disease states |
| TF | Cell Type | Tissue | Disease Stage | Target Gene | RSS | Regulon Activity |
| ∗The dot plots of a searched regulon are shown for all cell subpopulations in each disease state of each tissue based on the regulon specific score inferred using pySCENIC and by calculating the average expression. |
| Page: 1 |
Top |
Somatic mutation of malignant transformation related genes |
| Annotation of somatic variants for genes involved in malignant transformation |
| Hugo Symbol | Variant Class | Variant Classification | dbSNP RS | HGVSc | HGVSp | HGVSp Short | SWISSPROT | BIOTYPE | SIFT | PolyPhen | Tumor Sample Barcode | Tissue | Histology | Sex | Age | Stage | Therapy Types | Drugs | Outcome |
| LRRC59 | SNV | Missense_Mutation | rs751372015 | c.596N>A | p.Arg199Gln | p.R199Q | Q96AG4 | protein_coding | tolerated(0.11) | possibly_damaging(0.551) | TCGA-CG-5721-01 | Stomach | stomach adenocarcinoma | Male | <65 | III/IV | Unknown | Unknown | SD |
| LRRC59 | insertion | In_Frame_Ins | novel | c.346_347insGGGAAAAACAGGAGG | p.Lys116delinsArgGluLysGlnGluGlu | p.K116delinsREKQEE | Q96AG4 | protein_coding | TCGA-FY-A4B0-01 | Thyroid | thyroid carcinoma | Male | >=65 | I/II | Hormone Therapy | synthroid | SD |
| Page: 1 2 3 4 |
Top |
Related drugs of malignant transformation related genes |
| Identification of chemicals and drugs interact with genes involved in malignant transfromation |
| (DGIdb 4.0) |
| Entrez ID | Symbol | Category | Interaction Types | Drug Claim Name | Drug Name | PMIDs |
| 55379 | LRRC59 | NA | MELAGATRAN | MELAGATRAN | 22494098 |
| Page: 1 |

Copyright 2023-Present -The University of Texas Health Science Center at Houston |