
|
|||||
|
 | |
| |
| |
| |
| |
| |
|
Gene: KCNIP4 |
Gene summary for KCNIP4 |
| Gene information | Species | Human | Gene symbol | KCNIP4 | Gene ID | 80333 |
| Gene name | potassium voltage-gated channel interacting protein 4 | |
| Gene Alias | CALP | |
| Cytomap | 4p15.31-p15.2 | |
| Gene Type | protein-coding | GO ID | GO:0006810 | UniProtAcc | Q6PIL6 |
Top |
Malignant transformation analysis |
| Identification of the aberrant gene expression in precancerous and cancerous lesions by comparing the gene expression of stem-like cells in diseased tissues with normal stem cells |
| Entrez ID | Symbol | Replicates | Species | Organ | Tissue | Adj P-value | Log2FC | Malignancy |
| 80333 | KCNIP4 | AEH-subject3 | Human | Endometrium | AEH | 9.37e-03 | 1.93e-01 | -0.2576 |
| 80333 | KCNIP4 | AEH-subject4 | Human | Endometrium | AEH | 1.93e-13 | 4.93e-01 | -0.2657 |
| 80333 | KCNIP4 | AEH-subject5 | Human | Endometrium | AEH | 2.01e-02 | -2.74e-02 | -0.2953 |
| 80333 | KCNIP4 | EEC-subject5 | Human | Endometrium | EEC | 1.14e-09 | 4.06e-01 | -0.249 |
| 80333 | KCNIP4 | GSM6177620_NYU_UCEC1_lib1_lib1 | Human | Endometrium | EEC | 5.68e-03 | -1.12e-01 | -0.1869 |
| 80333 | KCNIP4 | GSM6177620_NYU_UCEC1_lib2_lib2 | Human | Endometrium | EEC | 2.48e-02 | -1.12e-01 | -0.1875 |
| 80333 | KCNIP4 | GSM6177620_NYU_UCEC1_lib3_lib3 | Human | Endometrium | EEC | 3.54e-03 | -1.12e-01 | -0.1883 |
| 80333 | KCNIP4 | GSM6177622_NYU_UCEC3_lib1_lib1 | Human | Endometrium | EEC | 4.86e-06 | -9.82e-02 | -0.1917 |
| 80333 | KCNIP4 | GSM6177622_NYU_UCEC3_lib2_lib2 | Human | Endometrium | EEC | 1.74e-05 | -1.00e-01 | -0.1916 |
| Page: 1 |
| Tissue | Expression Dynamics | Abbreviation |
| Endometrium | 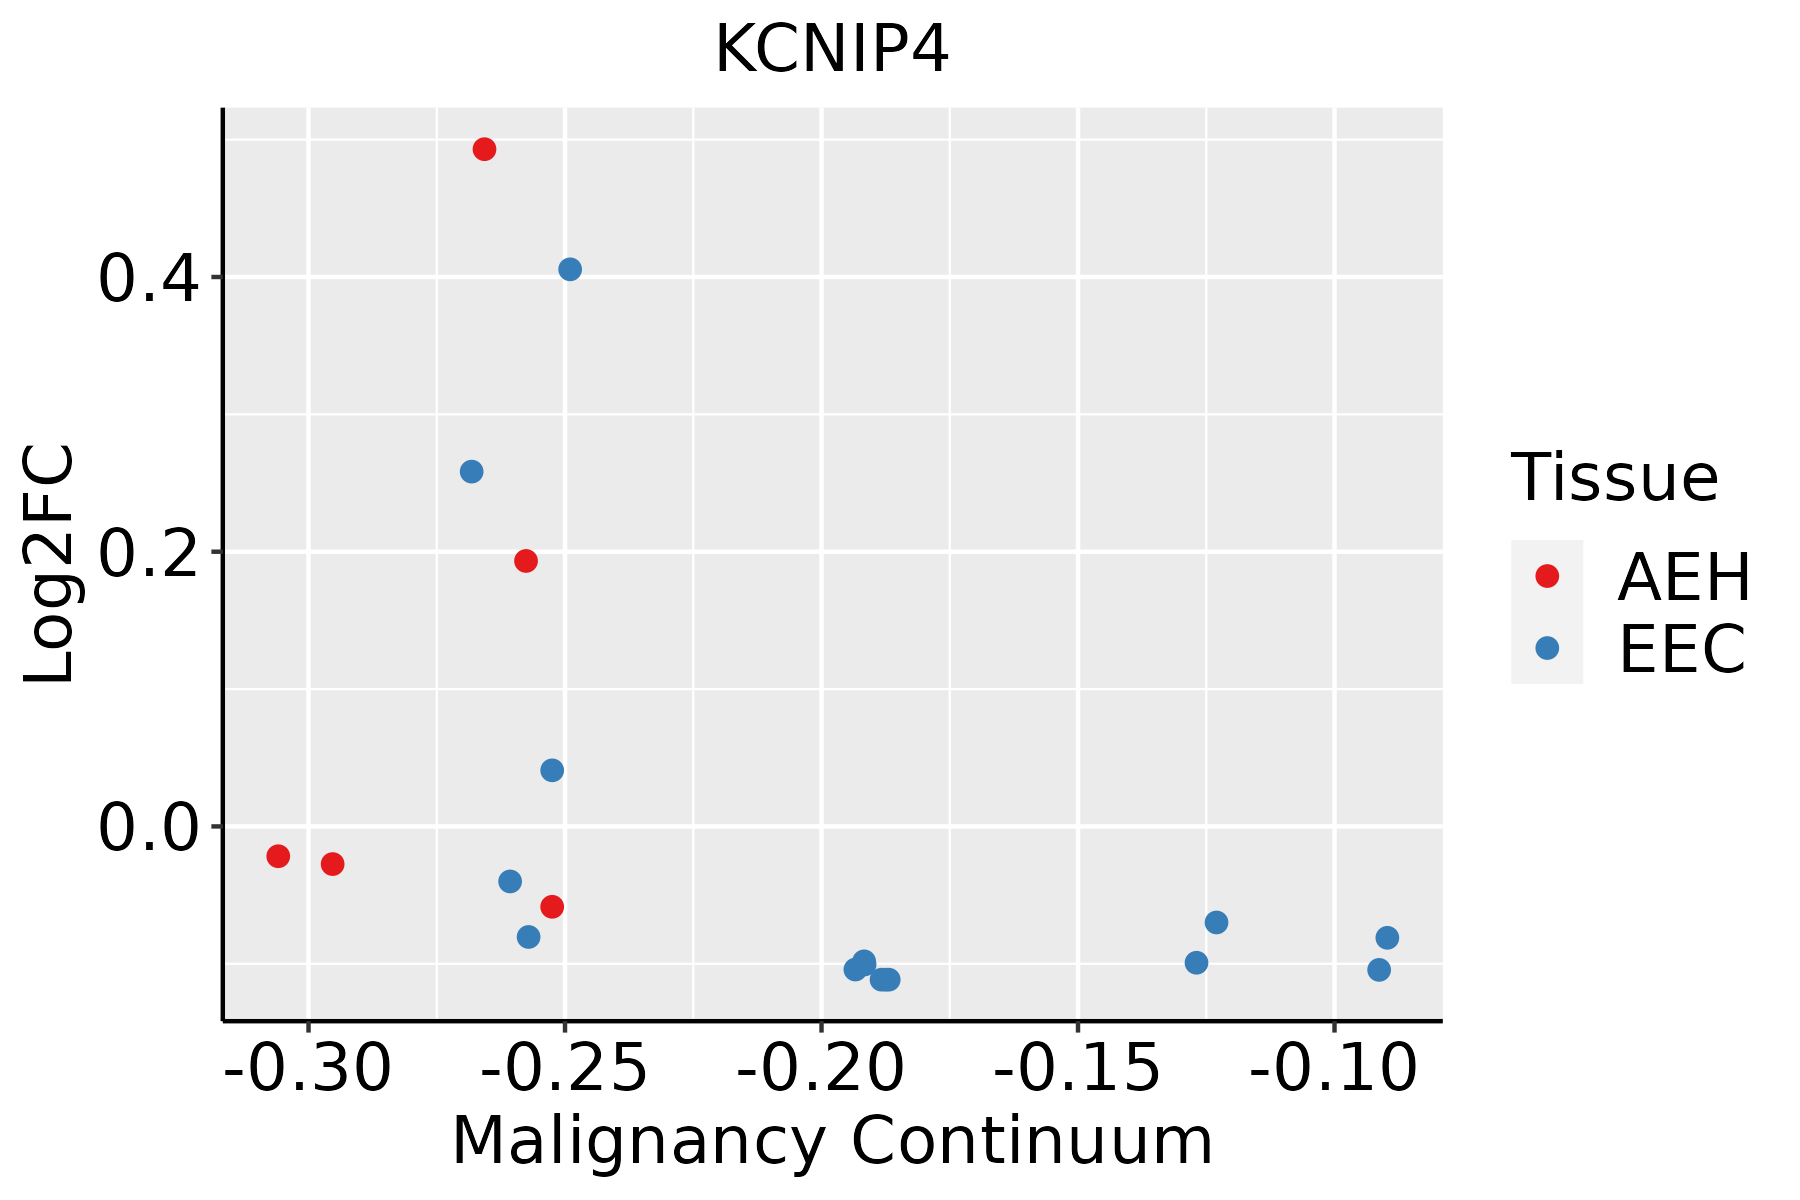 | AEH: Atypical endometrial hyperplasia |
| EEC: Endometrioid Cancer |
| ∗log2FC in expression of this searched gene in stem-like cells from each diseased tissue sample relative to stem-like cells in normal samples in each tissue plotted against the malignancy continuum. Samples are colored based on if they are from different disease stage. |
Top |
Malignant transformation related pathway analysis |
| Find out the enriched GO biological processes and KEGG pathways involved in transition from healthy to precancer to cancer |
| Tissue | Disease Stage | Enriched GO biological Processes |
| Colorectum | AD |  |
| Colorectum | SER |  |
| Colorectum | MSS |  |
| Colorectum | MSI-H |  |
| Colorectum | FAP |  |
| ∗Top 15 enriched GO BP terms are showed in the bar plot of each disease state in each tissue. Each row represents a significant GO biological process which is colored according to the -log10(p.adjust). |
| Page: 1 2 3 4 5 6 7 8 9 |
| GO ID | Tissue | Disease Stage | Description | Gene Ratio | Bg Ratio | pvalue | p.adjust | Count |
| GO:007265914 | Endometrium | AEH | protein localization to plasma membrane | 63/2100 | 284/18723 | 7.58e-08 | 3.92e-06 | 63 |
| GO:19907789 | Endometrium | AEH | protein localization to cell periphery | 68/2100 | 333/18723 | 6.38e-07 | 2.38e-05 | 68 |
| GO:00109597 | Endometrium | AEH | regulation of metal ion transport | 66/2100 | 406/18723 | 1.24e-03 | 1.07e-02 | 66 |
| GO:19013793 | Endometrium | AEH | regulation of potassium ion transmembrane transport | 20/2100 | 95/18723 | 3.91e-03 | 2.64e-02 | 20 |
| GO:00432661 | Endometrium | AEH | regulation of potassium ion transport | 21/2100 | 109/18723 | 9.13e-03 | 4.94e-02 | 21 |
| GO:19040623 | Endometrium | AEH | regulation of cation transmembrane transport | 55/2100 | 357/18723 | 9.18e-03 | 4.96e-02 | 55 |
| GO:007265915 | Endometrium | EEC | protein localization to plasma membrane | 64/2168 | 284/18723 | 1.05e-07 | 5.05e-06 | 64 |
| GO:199077814 | Endometrium | EEC | protein localization to cell periphery | 69/2168 | 333/18723 | 9.71e-07 | 3.31e-05 | 69 |
| GO:001095914 | Endometrium | EEC | regulation of metal ion transport | 70/2168 | 406/18723 | 4.12e-04 | 4.35e-03 | 70 |
| GO:190137911 | Endometrium | EEC | regulation of potassium ion transmembrane transport | 20/2168 | 95/18723 | 5.59e-03 | 3.38e-02 | 20 |
| Page: 1 |
| Pathway ID | Tissue | Disease Stage | Description | Gene Ratio | Bg Ratio | pvalue | p.adjust | qvalue | Count |
| Page: 1 |
Top |
Cell-cell communication analysis |
| Identification of potential cell-cell interactions between two cell types and their ligand-receptor pairs for different disease states |
| Ligand | Receptor | LRpair | Pathway | Tissue | Disease Stage |
| Page: 1 |
Top |
Single-cell gene regulatory network inference analysis |
| Find out the significant the regulons (TFs) and the target genes of each regulon across cell types for different disease states |
| TF | Cell Type | Tissue | Disease Stage | Target Gene | RSS | Regulon Activity |
| ∗The dot plots of a searched regulon are shown for all cell subpopulations in each disease state of each tissue based on the regulon specific score inferred using pySCENIC and by calculating the average expression. |
| Page: 1 |
Top |
Somatic mutation of malignant transformation related genes |
| Annotation of somatic variants for genes involved in malignant transformation |
| Hugo Symbol | Variant Class | Variant Classification | dbSNP RS | HGVSc | HGVSp | HGVSp Short | SWISSPROT | BIOTYPE | SIFT | PolyPhen | Tumor Sample Barcode | Tissue | Histology | Sex | Age | Stage | Therapy Types | Drugs | Outcome |
| KCNIP4 | SNV | Missense_Mutation | rs755731479 | c.92N>A | p.Arg31His | p.R31H | Q6PIL6 | protein_coding | deleterious(0.03) | possibly_damaging(0.655) | TCGA-CD-A4MG-01 | Stomach | stomach adenocarcinoma | Male | >=65 | I/II | Unknown | Unknown | PD |
| KCNIP4 | SNV | Missense_Mutation | novel | c.194N>T | p.Thr65Ile | p.T65I | Q6PIL6 | protein_coding | deleterious(0.04) | benign(0.02) | TCGA-HF-A5NB-01 | Stomach | stomach adenocarcinoma | Female | >=65 | III/IV | Chemotherapy | fluorouracil | SD |
| KCNIP4 | SNV | Missense_Mutation | rs755731479 | c.92N>A | p.Arg31His | p.R31H | Q6PIL6 | protein_coding | deleterious(0.03) | possibly_damaging(0.655) | TCGA-IN-AB1X-01 | Stomach | stomach adenocarcinoma | Female | >=65 | I/II | Chemotherapy | leucovorin | SD |
| KCNIP4 | SNV | Missense_Mutation | c.385T>G | p.Phe129Val | p.F129V | Q6PIL6 | protein_coding | deleterious(0) | probably_damaging(0.98) | TCGA-DJ-A3VM-01 | Thyroid | thyroid carcinoma | Female | >=65 | I/II | Unknown | Unknown | SD |
| Page: 1 2 3 4 |
Top |
Related drugs of malignant transformation related genes |
| Identification of chemicals and drugs interact with genes involved in malignant transfromation |
| (DGIdb 4.0) |
| Entrez ID | Symbol | Category | Interaction Types | Drug Claim Name | Drug Name | PMIDs |
| 80333 | KCNIP4 | ION CHANNEL | Ace Inhibitors, Plain | 28084903,26169577 |
| Page: 1 |

Copyright 2023-Present -The University of Texas Health Science Center at Houston |