
|
|||||
|
 | |
| |
| |
| |
| |
| |
|
Gene: INPPL1 |
Gene summary for INPPL1 |
| Gene information | Species | Human | Gene symbol | INPPL1 | Gene ID | 3636 |
| Gene name | inositol polyphosphate phosphatase like 1 | |
| Gene Alias | OPSMD | |
| Cytomap | 11q13.4 | |
| Gene Type | protein-coding | GO ID | GO:0001501 | UniProtAcc | O15357 |
Top |
Malignant transformation analysis |
| Identification of the aberrant gene expression in precancerous and cancerous lesions by comparing the gene expression of stem-like cells in diseased tissues with normal stem cells |
| Entrez ID | Symbol | Replicates | Species | Organ | Tissue | Adj P-value | Log2FC | Malignancy |
| 3636 | INPPL1 | HTA11_2487_2000001011 | Human | Colorectum | SER | 9.40e-03 | 1.30e-01 | -0.1808 |
| 3636 | INPPL1 | HTA11_347_2000001011 | Human | Colorectum | AD | 9.37e-13 | 2.70e-01 | -0.1954 |
| 3636 | INPPL1 | HTA11_1391_2000001011 | Human | Colorectum | AD | 6.75e-07 | 3.34e-01 | -0.059 |
| 3636 | INPPL1 | HTA11_866_3004761011 | Human | Colorectum | AD | 2.79e-08 | 3.17e-01 | 0.096 |
| 3636 | INPPL1 | HTA11_99999970781_79442 | Human | Colorectum | MSS | 9.30e-12 | 4.65e-01 | 0.294 |
| 3636 | INPPL1 | HTA11_99999971662_82457 | Human | Colorectum | MSS | 5.25e-10 | 5.32e-01 | 0.3859 |
| 3636 | INPPL1 | HTA11_99999973899_84307 | Human | Colorectum | MSS | 4.69e-02 | 3.21e-01 | 0.2585 |
| 3636 | INPPL1 | HTA11_99999974143_84620 | Human | Colorectum | MSS | 4.84e-02 | 2.83e-01 | 0.3005 |
| 3636 | INPPL1 | CRC-3-11773 | Human | Colorectum | CRC | 5.12e-06 | 4.59e-01 | 0.2564 |
| 3636 | INPPL1 | LZE7T | Human | Esophagus | ESCC | 2.52e-03 | 1.77e-01 | 0.0667 |
| 3636 | INPPL1 | LZE22D1 | Human | Esophagus | HGIN | 8.08e-04 | 1.66e-01 | 0.0595 |
| 3636 | INPPL1 | LZE22T | Human | Esophagus | ESCC | 2.32e-02 | 3.17e-01 | 0.068 |
| 3636 | INPPL1 | LZE24T | Human | Esophagus | ESCC | 4.45e-08 | 1.60e-01 | 0.0596 |
| 3636 | INPPL1 | P1T-E | Human | Esophagus | ESCC | 2.02e-04 | 1.69e-01 | 0.0875 |
| 3636 | INPPL1 | P2T-E | Human | Esophagus | ESCC | 1.74e-17 | 3.67e-01 | 0.1177 |
| 3636 | INPPL1 | P4T-E | Human | Esophagus | ESCC | 2.06e-05 | 1.05e-01 | 0.1323 |
| 3636 | INPPL1 | P5T-E | Human | Esophagus | ESCC | 5.82e-03 | -2.28e-02 | 0.1327 |
| 3636 | INPPL1 | P8T-E | Human | Esophagus | ESCC | 8.39e-17 | 2.05e-01 | 0.0889 |
| 3636 | INPPL1 | P10T-E | Human | Esophagus | ESCC | 4.95e-10 | 1.06e-01 | 0.116 |
| 3636 | INPPL1 | P12T-E | Human | Esophagus | ESCC | 5.97e-21 | 2.27e-01 | 0.1122 |
| Page: 1 2 3 4 5 |
| Tissue | Expression Dynamics | Abbreviation |
| Colorectum (GSE201348) |  | FAP: Familial adenomatous polyposis |
| CRC: Colorectal cancer | ||
| Colorectum (HTA11) |  | AD: Adenomas |
| SER: Sessile serrated lesions | ||
| MSI-H: Microsatellite-high colorectal cancer | ||
| MSS: Microsatellite stable colorectal cancer | ||
| Esophagus | 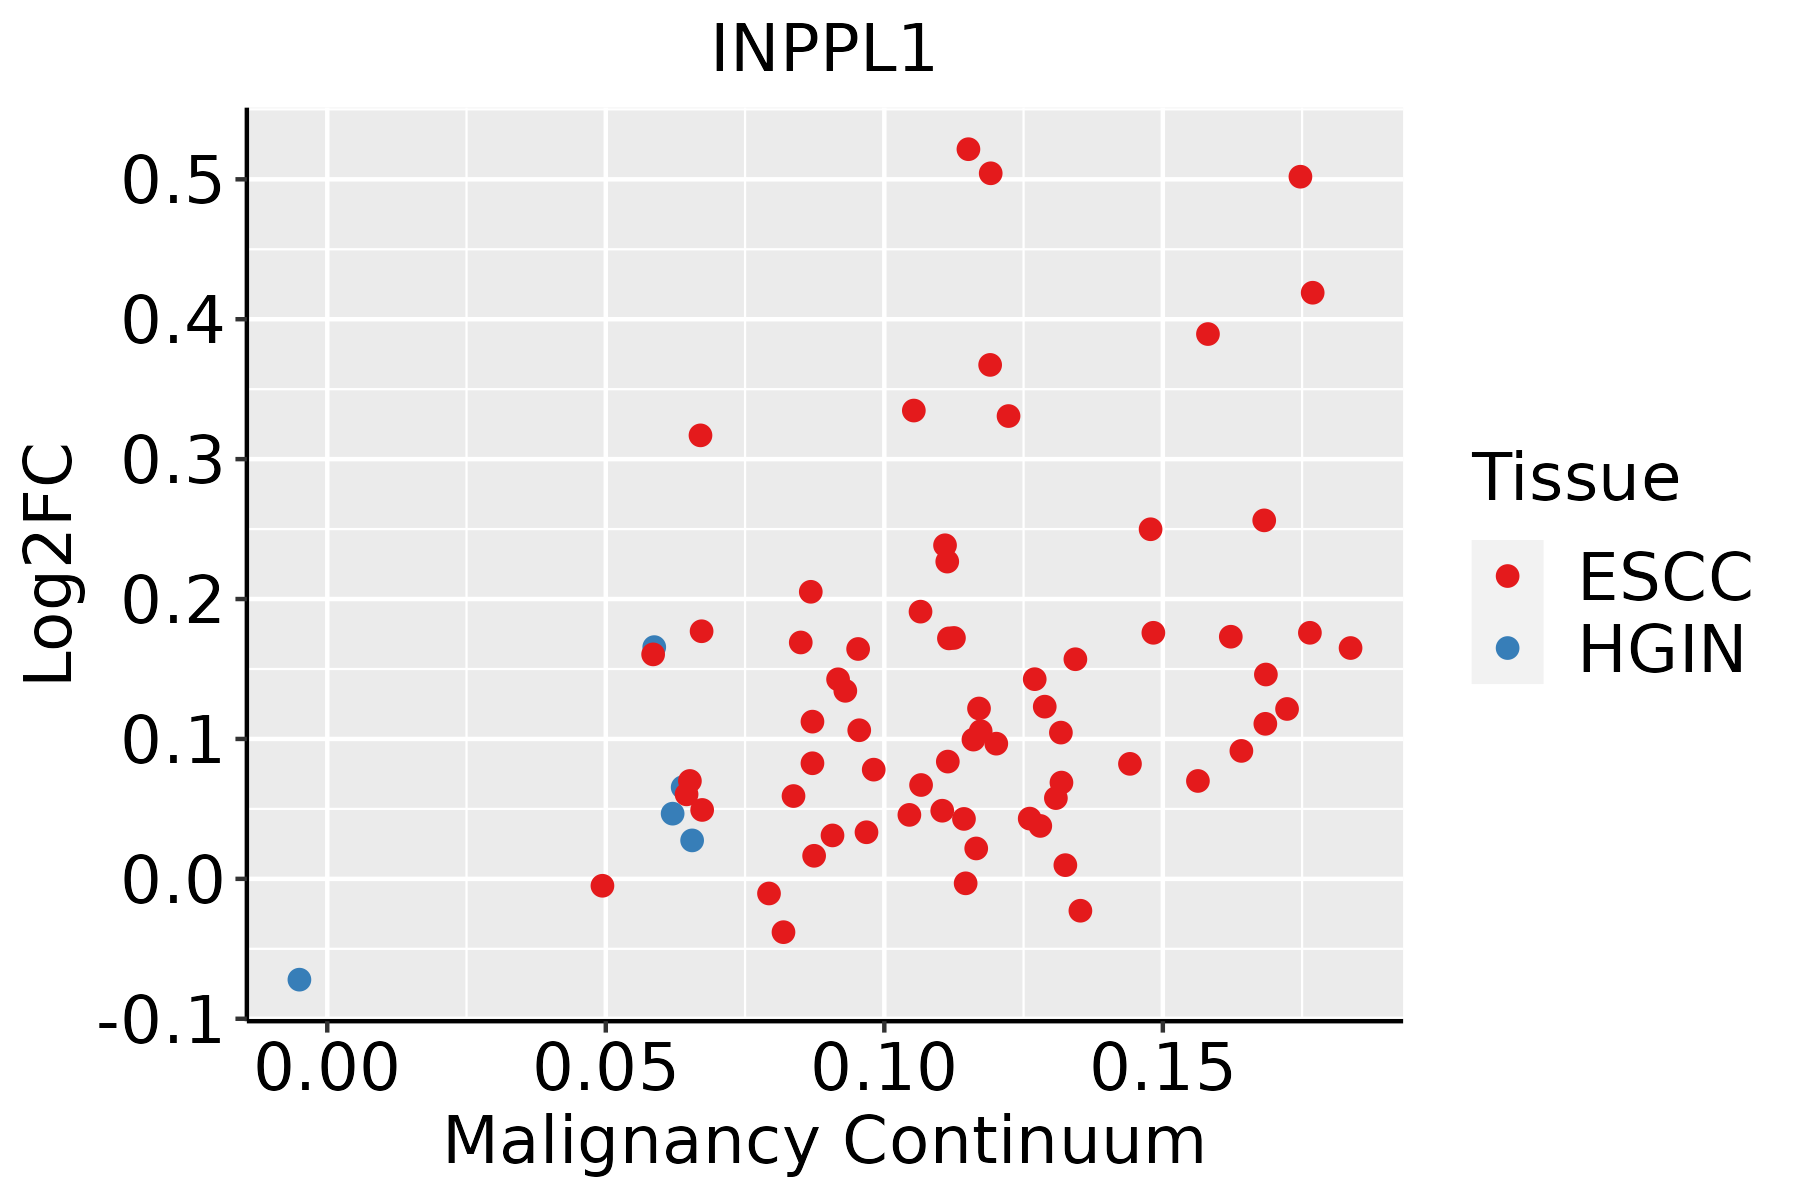 | ESCC: Esophageal squamous cell carcinoma |
| HGIN: High-grade intraepithelial neoplasias | ||
| LGIN: Low-grade intraepithelial neoplasias | ||
| Liver | 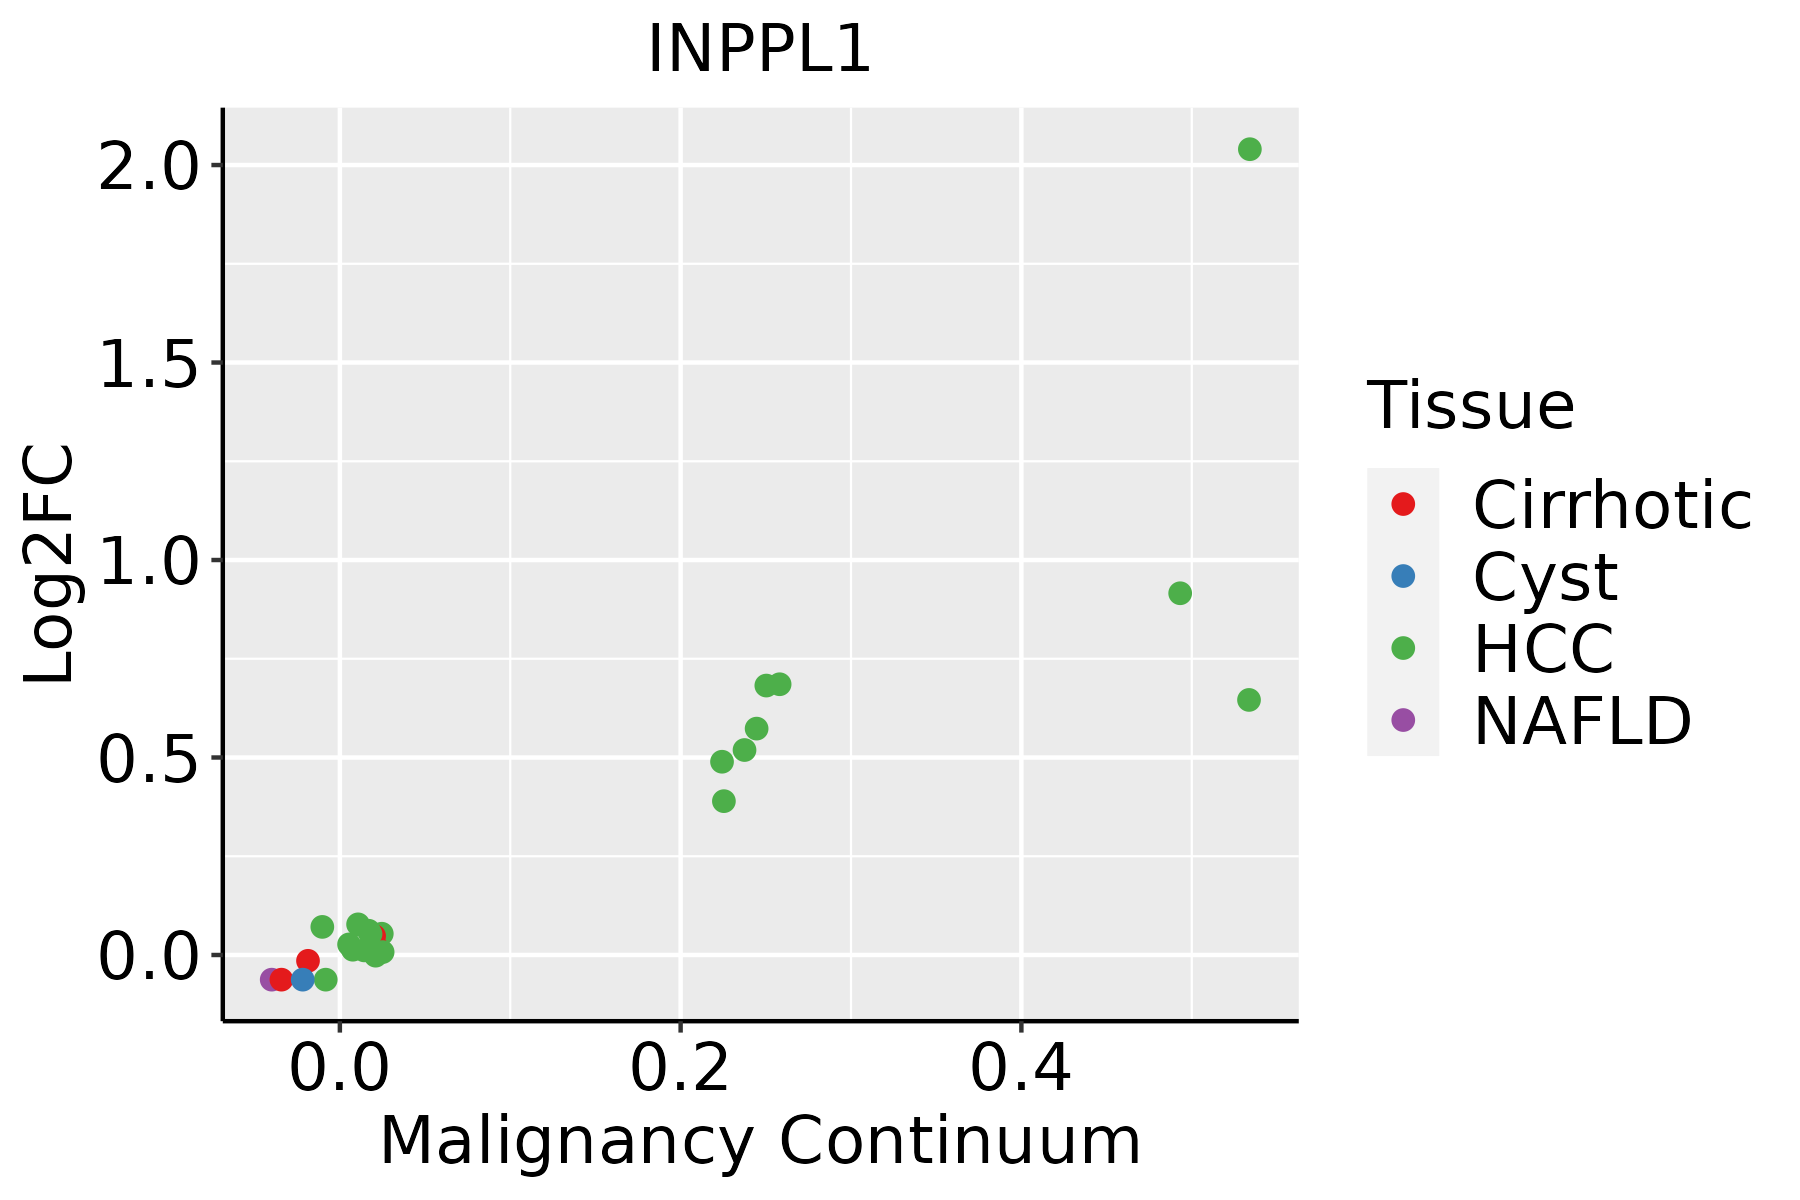 | HCC: Hepatocellular carcinoma |
| NAFLD: Non-alcoholic fatty liver disease | ||
| Oral Cavity | 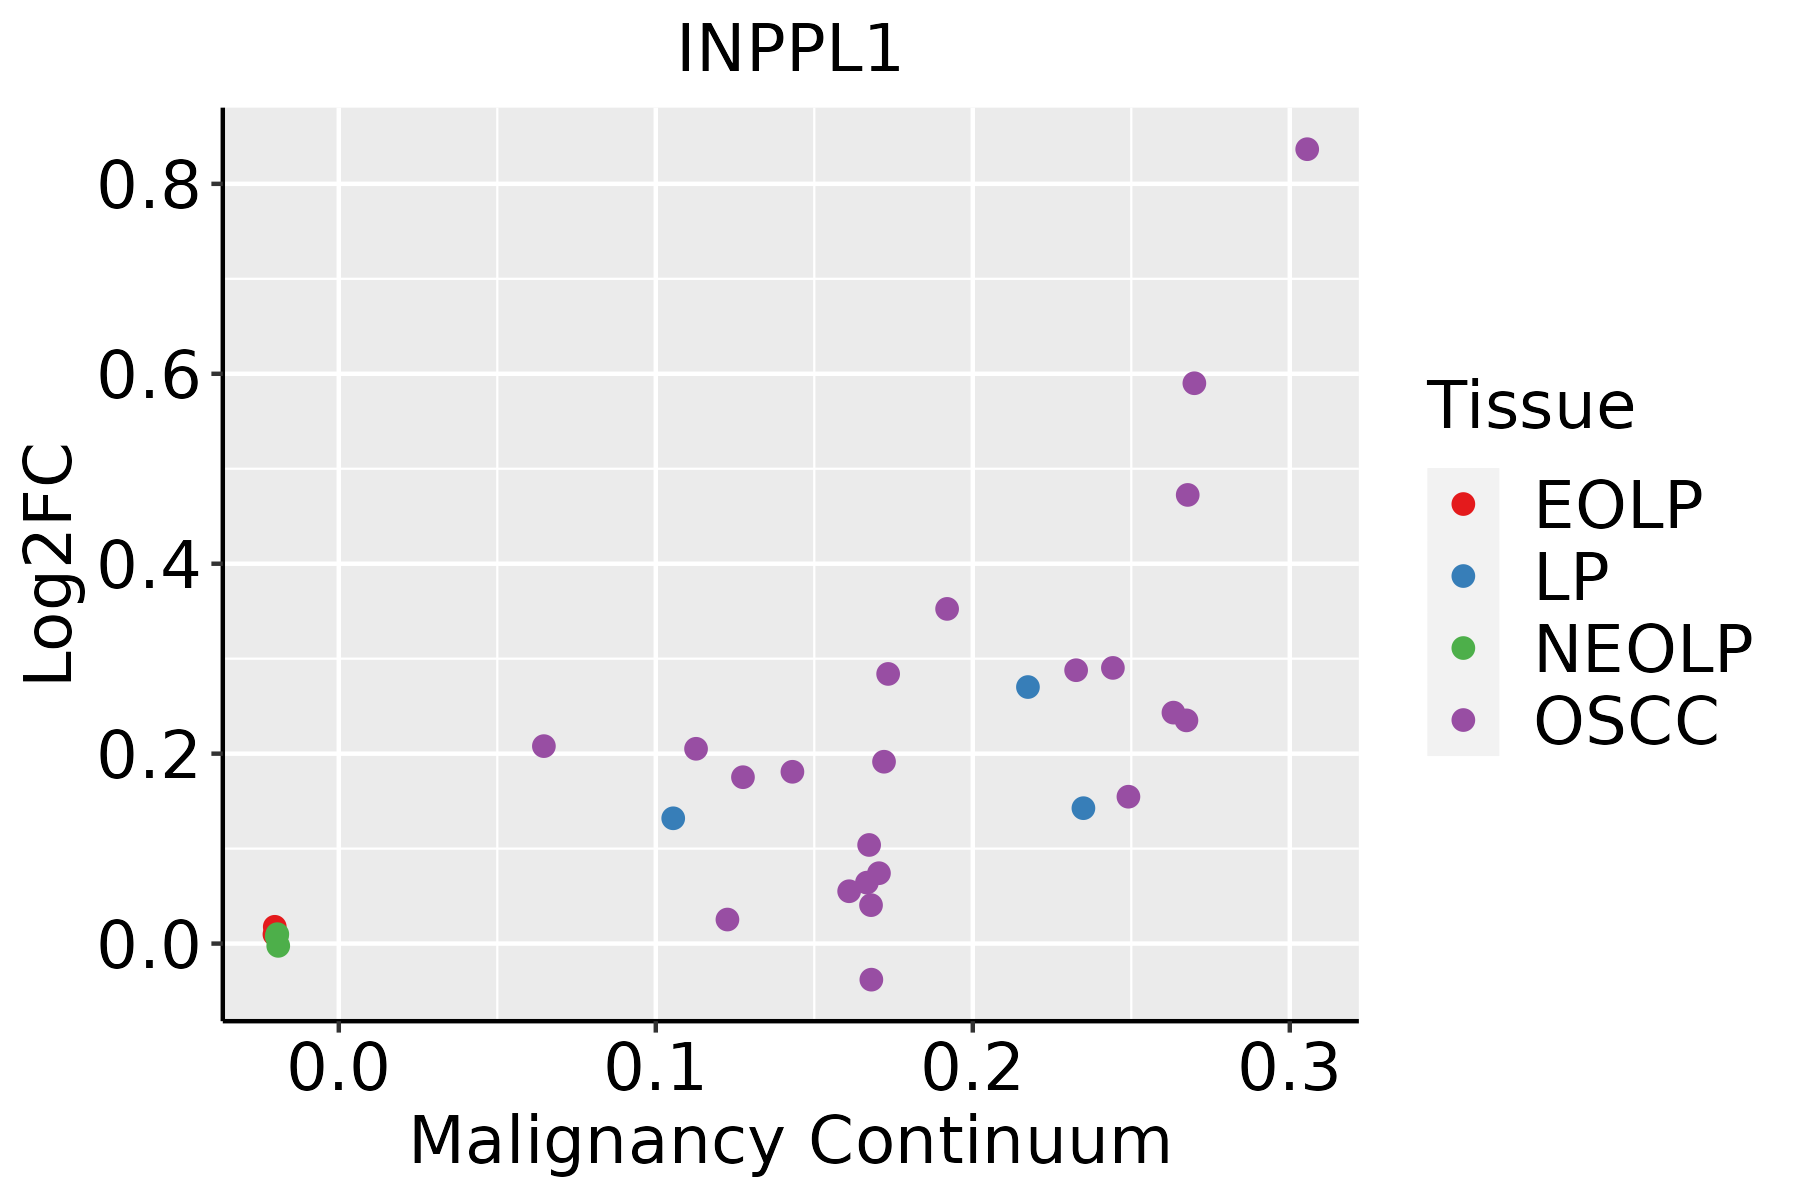 | EOLP: Erosive Oral lichen planus |
| LP: leukoplakia | ||
| NEOLP: Non-erosive oral lichen planus | ||
| OSCC: Oral squamous cell carcinoma | ||
| Thyroid |  | ATC: Anaplastic thyroid cancer |
| HT: Hashimoto's thyroiditis | ||
| PTC: Papillary thyroid cancer |
| ∗log2FC in expression of this searched gene in stem-like cells from each diseased tissue sample relative to stem-like cells in normal samples in each tissue plotted against the malignancy continuum. Samples are colored based on if they are from different disease stage. |
Top |
Malignant transformation related pathway analysis |
| Find out the enriched GO biological processes and KEGG pathways involved in transition from healthy to precancer to cancer |
| Tissue | Disease Stage | Enriched GO biological Processes |
| Colorectum | AD |  |
| Colorectum | SER |  |
| Colorectum | MSS |  |
| Colorectum | MSI-H |  |
| Colorectum | FAP |  |
| ∗Top 15 enriched GO BP terms are showed in the bar plot of each disease state in each tissue. Each row represents a significant GO biological process which is colored according to the -log10(p.adjust). |
| Page: 1 2 3 4 5 6 7 8 9 |
| GO ID | Tissue | Disease Stage | Description | Gene Ratio | Bg Ratio | pvalue | p.adjust | Count |
| GO:0007015 | Colorectum | AD | actin filament organization | 167/3918 | 442/18723 | 1.65e-16 | 7.94e-14 | 167 |
| GO:0032868 | Colorectum | AD | response to insulin | 91/3918 | 264/18723 | 2.02e-07 | 8.48e-06 | 91 |
| GO:0043434 | Colorectum | AD | response to peptide hormone | 126/3918 | 414/18723 | 2.70e-06 | 7.86e-05 | 126 |
| GO:0016311 | Colorectum | AD | dephosphorylation | 123/3918 | 417/18723 | 1.84e-05 | 3.82e-04 | 123 |
| GO:0019318 | Colorectum | AD | hexose metabolic process | 77/3918 | 237/18723 | 1.96e-05 | 4.01e-04 | 77 |
| GO:0005996 | Colorectum | AD | monosaccharide metabolic process | 80/3918 | 257/18723 | 7.31e-05 | 1.17e-03 | 80 |
| GO:0030258 | Colorectum | AD | lipid modification | 67/3918 | 212/18723 | 1.66e-04 | 2.27e-03 | 67 |
| GO:0006006 | Colorectum | AD | glucose metabolic process | 62/3918 | 196/18723 | 2.76e-04 | 3.39e-03 | 62 |
| GO:0009791 | Colorectum | AD | post-embryonic development | 29/3918 | 80/18723 | 1.13e-03 | 1.03e-02 | 29 |
| GO:0006650 | Colorectum | AD | glycerophospholipid metabolic process | 83/3918 | 306/18723 | 5.40e-03 | 3.55e-02 | 83 |
| GO:0006644 | Colorectum | AD | phospholipid metabolic process | 101/3918 | 383/18723 | 5.80e-03 | 3.67e-02 | 101 |
| GO:0001503 | Colorectum | AD | ossification | 106/3918 | 408/18723 | 7.68e-03 | 4.64e-02 | 106 |
| GO:0045017 | Colorectum | AD | glycerolipid biosynthetic process | 69/3918 | 252/18723 | 8.33e-03 | 4.88e-02 | 69 |
| GO:00070151 | Colorectum | SER | actin filament organization | 134/2897 | 442/18723 | 1.39e-15 | 5.70e-13 | 134 |
| GO:00328681 | Colorectum | SER | response to insulin | 65/2897 | 264/18723 | 6.70e-05 | 1.53e-03 | 65 |
| GO:00434341 | Colorectum | SER | response to peptide hormone | 93/2897 | 414/18723 | 9.61e-05 | 2.04e-03 | 93 |
| GO:00193181 | Colorectum | SER | hexose metabolic process | 56/2897 | 237/18723 | 6.19e-04 | 8.42e-03 | 56 |
| GO:00059961 | Colorectum | SER | monosaccharide metabolic process | 59/2897 | 257/18723 | 9.65e-04 | 1.15e-02 | 59 |
| GO:00060061 | Colorectum | SER | glucose metabolic process | 46/2897 | 196/18723 | 2.08e-03 | 2.05e-02 | 46 |
| GO:0046486 | Colorectum | SER | glycerolipid metabolic process | 82/2897 | 392/18723 | 2.26e-03 | 2.17e-02 | 82 |
| Page: 1 2 3 4 5 6 7 |
| Pathway ID | Tissue | Disease Stage | Description | Gene Ratio | Bg Ratio | pvalue | p.adjust | qvalue | Count |
| hsa046662 | Colorectum | SER | Fc gamma R-mediated phagocytosis | 39/1580 | 97/8465 | 5.84e-07 | 9.70e-06 | 7.04e-06 | 39 |
| hsa046663 | Colorectum | SER | Fc gamma R-mediated phagocytosis | 39/1580 | 97/8465 | 5.84e-07 | 9.70e-06 | 7.04e-06 | 39 |
| hsa046664 | Colorectum | MSS | Fc gamma R-mediated phagocytosis | 45/1875 | 97/8465 | 9.30e-08 | 1.56e-06 | 9.55e-07 | 45 |
| hsa04910 | Colorectum | MSS | Insulin signaling pathway | 43/1875 | 137/8465 | 7.37e-03 | 2.84e-02 | 1.74e-02 | 43 |
| hsa046665 | Colorectum | MSS | Fc gamma R-mediated phagocytosis | 45/1875 | 97/8465 | 9.30e-08 | 1.56e-06 | 9.55e-07 | 45 |
| hsa049101 | Colorectum | MSS | Insulin signaling pathway | 43/1875 | 137/8465 | 7.37e-03 | 2.84e-02 | 1.74e-02 | 43 |
| hsa046668 | Colorectum | CRC | Fc gamma R-mediated phagocytosis | 27/1091 | 97/8465 | 6.24e-05 | 1.12e-03 | 7.57e-04 | 27 |
| hsa04070 | Colorectum | CRC | Phosphatidylinositol signaling system | 25/1091 | 97/8465 | 4.27e-04 | 4.60e-03 | 3.12e-03 | 25 |
| hsa049104 | Colorectum | CRC | Insulin signaling pathway | 31/1091 | 137/8465 | 1.07e-03 | 8.91e-03 | 6.03e-03 | 31 |
| hsa00562 | Colorectum | CRC | Inositol phosphate metabolism | 18/1091 | 73/8465 | 4.38e-03 | 2.52e-02 | 1.71e-02 | 18 |
| hsa046669 | Colorectum | CRC | Fc gamma R-mediated phagocytosis | 27/1091 | 97/8465 | 6.24e-05 | 1.12e-03 | 7.57e-04 | 27 |
| hsa040701 | Colorectum | CRC | Phosphatidylinositol signaling system | 25/1091 | 97/8465 | 4.27e-04 | 4.60e-03 | 3.12e-03 | 25 |
| hsa049105 | Colorectum | CRC | Insulin signaling pathway | 31/1091 | 137/8465 | 1.07e-03 | 8.91e-03 | 6.03e-03 | 31 |
| hsa005621 | Colorectum | CRC | Inositol phosphate metabolism | 18/1091 | 73/8465 | 4.38e-03 | 2.52e-02 | 1.71e-02 | 18 |
| hsa049109 | Esophagus | ESCC | Insulin signaling pathway | 89/4205 | 137/8465 | 1.97e-04 | 7.32e-04 | 3.75e-04 | 89 |
| hsa0466620 | Esophagus | ESCC | Fc gamma R-mediated phagocytosis | 63/4205 | 97/8465 | 1.63e-03 | 4.89e-03 | 2.50e-03 | 63 |
| hsa0491014 | Esophagus | ESCC | Insulin signaling pathway | 89/4205 | 137/8465 | 1.97e-04 | 7.32e-04 | 3.75e-04 | 89 |
| hsa04666110 | Esophagus | ESCC | Fc gamma R-mediated phagocytosis | 63/4205 | 97/8465 | 1.63e-03 | 4.89e-03 | 2.50e-03 | 63 |
| hsa0491041 | Liver | HCC | Insulin signaling pathway | 95/4020 | 137/8465 | 1.53e-07 | 1.97e-06 | 1.10e-06 | 95 |
| hsa0466610 | Liver | HCC | Fc gamma R-mediated phagocytosis | 58/4020 | 97/8465 | 9.65e-03 | 2.52e-02 | 1.40e-02 | 58 |
| Page: 1 2 |
Top |
Cell-cell communication analysis |
| Identification of potential cell-cell interactions between two cell types and their ligand-receptor pairs for different disease states |
| Ligand | Receptor | LRpair | Pathway | Tissue | Disease Stage |
| Page: 1 |
Top |
Single-cell gene regulatory network inference analysis |
| Find out the significant the regulons (TFs) and the target genes of each regulon across cell types for different disease states |
| TF | Cell Type | Tissue | Disease Stage | Target Gene | RSS | Regulon Activity |
| ∗The dot plots of a searched regulon are shown for all cell subpopulations in each disease state of each tissue based on the regulon specific score inferred using pySCENIC and by calculating the average expression. |
| Page: 1 |
Top |
Somatic mutation of malignant transformation related genes |
| Annotation of somatic variants for genes involved in malignant transformation |
| Hugo Symbol | Variant Class | Variant Classification | dbSNP RS | HGVSc | HGVSp | HGVSp Short | SWISSPROT | BIOTYPE | SIFT | PolyPhen | Tumor Sample Barcode | Tissue | Histology | Sex | Age | Stage | Therapy Types | Drugs | Outcome |
| INPPL1 | SNV | Missense_Mutation | rs780472220 | c.2749C>T | p.Arg917Cys | p.R917C | O15357 | protein_coding | tolerated(0.1) | possibly_damaging(0.725) | TCGA-CK-4952-01 | Colorectum | colon adenocarcinoma | Female | <65 | III/IV | Unknown | Unknown | SD |
| INPPL1 | SNV | Missense_Mutation | c.1747N>T | p.Leu583Phe | p.L583F | O15357 | protein_coding | deleterious(0) | probably_damaging(0.999) | TCGA-CK-5916-01 | Colorectum | colon adenocarcinoma | Female | >=65 | I/II | Unknown | Unknown | PD | |
| INPPL1 | SNV | Missense_Mutation | rs753557940 | c.1792C>T | p.Arg598Cys | p.R598C | O15357 | protein_coding | deleterious(0) | probably_damaging(1) | TCGA-D5-6532-01 | Colorectum | colon adenocarcinoma | Male | <65 | I/II | Unknown | Unknown | SD |
| INPPL1 | SNV | Missense_Mutation | rs771324555 | c.1168N>T | p.Arg390Cys | p.R390C | O15357 | protein_coding | deleterious(0) | possibly_damaging(0.724) | TCGA-G4-6302-01 | Colorectum | colon adenocarcinoma | Female | >=65 | I/II | Unknown | Unknown | SD |
| INPPL1 | SNV | Missense_Mutation | novel | c.3026N>C | p.Val1009Ala | p.V1009A | O15357 | protein_coding | tolerated(0.8) | benign(0) | TCGA-G4-6588-01 | Colorectum | colon adenocarcinoma | Female | <65 | I/II | Unknown | Unknown | SD |
| INPPL1 | SNV | Missense_Mutation | novel | c.2134N>A | p.Asp712Asn | p.D712N | O15357 | protein_coding | deleterious(0) | probably_damaging(0.998) | TCGA-SS-A7HO-01 | Colorectum | colon adenocarcinoma | Female | <65 | I/II | Chemotherapy | oxaliplatin | PD |
| INPPL1 | insertion | Frame_Shift_Ins | rs749079348 | c.2927dupC | p.Pro977ThrfsTer7 | p.P977Tfs*7 | O15357 | protein_coding | TCGA-A6-5661-01 | Colorectum | colon adenocarcinoma | Female | >=65 | I/II | Unknown | Unknown | SD | ||
| INPPL1 | deletion | Frame_Shift_Del | c.2921delN | p.Pro976HisfsTer155 | p.P976Hfs*155 | O15357 | protein_coding | TCGA-D5-6928-01 | Colorectum | colon adenocarcinoma | Male | >=65 | I/II | Unknown | Unknown | SD | |||
| INPPL1 | insertion | Frame_Shift_Ins | rs749079348 | c.2920_2921insC | p.Pro977ThrfsTer7 | p.P977Tfs*7 | O15357 | protein_coding | TCGA-AG-A02N-01 | Colorectum | rectum adenocarcinoma | Male | >=65 | I/II | Chemotherapy | folinic | CR | ||
| INPPL1 | SNV | Missense_Mutation | novel | c.3276G>T | p.Lys1092Asn | p.K1092N | O15357 | protein_coding | tolerated(0.32) | probably_damaging(0.95) | TCGA-A5-A0G1-01 | Endometrium | uterine corpus endometrioid carcinoma | Female | >=65 | I/II | Unknown | Unknown | SD |
| Page: 1 2 3 4 5 6 7 8 9 10 11 12 13 14 15 16 17 18 |
Top |
Related drugs of malignant transformation related genes |
| Identification of chemicals and drugs interact with genes involved in malignant transfromation |
| (DGIdb 4.0) |
| Entrez ID | Symbol | Category | Interaction Types | Drug Claim Name | Drug Name | PMIDs |
| 3636 | INPPL1 | KINASE, ENZYME, DRUGGABLE GENOME | ANTISENSE OLIGONUCLEOTIDES | 10958682 | ||
| 3636 | INPPL1 | KINASE, ENZYME, DRUGGABLE GENOME | inhibitor | 252827535 |
| Page: 1 |

Copyright 2023-Present -The University of Texas Health Science Center at Houston |