
|
|||||
|
 | |
| |
| |
| |
| |
| |
|
Gene: HLTF |
Gene summary for HLTF |
| Gene information | Species | Human | Gene symbol | HLTF | Gene ID | 6596 |
| Gene name | helicase like transcription factor | |
| Gene Alias | HIP116 | |
| Cytomap | 3q24 | |
| Gene Type | protein-coding | GO ID | GO:0006139 | UniProtAcc | A0A0C4DGA6 |
Top |
Malignant transformation analysis |
| Identification of the aberrant gene expression in precancerous and cancerous lesions by comparing the gene expression of stem-like cells in diseased tissues with normal stem cells |
| Entrez ID | Symbol | Replicates | Species | Organ | Tissue | Adj P-value | Log2FC | Malignancy |
| 6596 | HLTF | LZE2T | Human | Esophagus | ESCC | 5.56e-08 | 1.27e+00 | 0.082 |
| 6596 | HLTF | LZE3D | Human | Esophagus | HGIN | 3.05e-02 | 4.48e-01 | 0.0668 |
| 6596 | HLTF | LZE4T | Human | Esophagus | ESCC | 1.25e-17 | 6.15e-01 | 0.0811 |
| 6596 | HLTF | LZE7T | Human | Esophagus | ESCC | 4.33e-16 | 9.20e-01 | 0.0667 |
| 6596 | HLTF | LZE8T | Human | Esophagus | ESCC | 1.10e-11 | 3.39e-01 | 0.067 |
| 6596 | HLTF | LZE20T | Human | Esophagus | ESCC | 5.34e-04 | 1.60e-01 | 0.0662 |
| 6596 | HLTF | LZE22T | Human | Esophagus | ESCC | 2.33e-04 | 3.25e-01 | 0.068 |
| 6596 | HLTF | LZE24T | Human | Esophagus | ESCC | 1.03e-15 | 5.50e-01 | 0.0596 |
| 6596 | HLTF | LZE6T | Human | Esophagus | ESCC | 3.99e-02 | 4.40e-01 | 0.0845 |
| 6596 | HLTF | P1T-E | Human | Esophagus | ESCC | 4.04e-07 | 5.33e-01 | 0.0875 |
| 6596 | HLTF | P2T-E | Human | Esophagus | ESCC | 2.41e-78 | 1.57e+00 | 0.1177 |
| 6596 | HLTF | P4T-E | Human | Esophagus | ESCC | 1.77e-24 | 5.87e-01 | 0.1323 |
| 6596 | HLTF | P5T-E | Human | Esophagus | ESCC | 1.72e-41 | 8.86e-01 | 0.1327 |
| 6596 | HLTF | P8T-E | Human | Esophagus | ESCC | 9.44e-23 | 4.90e-01 | 0.0889 |
| 6596 | HLTF | P9T-E | Human | Esophagus | ESCC | 1.21e-06 | 2.28e-01 | 0.1131 |
| 6596 | HLTF | P10T-E | Human | Esophagus | ESCC | 4.14e-53 | 9.39e-01 | 0.116 |
| 6596 | HLTF | P11T-E | Human | Esophagus | ESCC | 5.77e-16 | 4.65e-01 | 0.1426 |
| 6596 | HLTF | P12T-E | Human | Esophagus | ESCC | 8.87e-27 | 5.46e-01 | 0.1122 |
| 6596 | HLTF | P15T-E | Human | Esophagus | ESCC | 5.49e-39 | 8.74e-01 | 0.1149 |
| 6596 | HLTF | P16T-E | Human | Esophagus | ESCC | 2.96e-75 | 1.15e+00 | 0.1153 |
| Page: 1 2 3 4 5 6 |
| Tissue | Expression Dynamics | Abbreviation |
| Esophagus |  | ESCC: Esophageal squamous cell carcinoma |
| HGIN: High-grade intraepithelial neoplasias | ||
| LGIN: Low-grade intraepithelial neoplasias | ||
| Liver |  | HCC: Hepatocellular carcinoma |
| NAFLD: Non-alcoholic fatty liver disease | ||
| Oral Cavity | 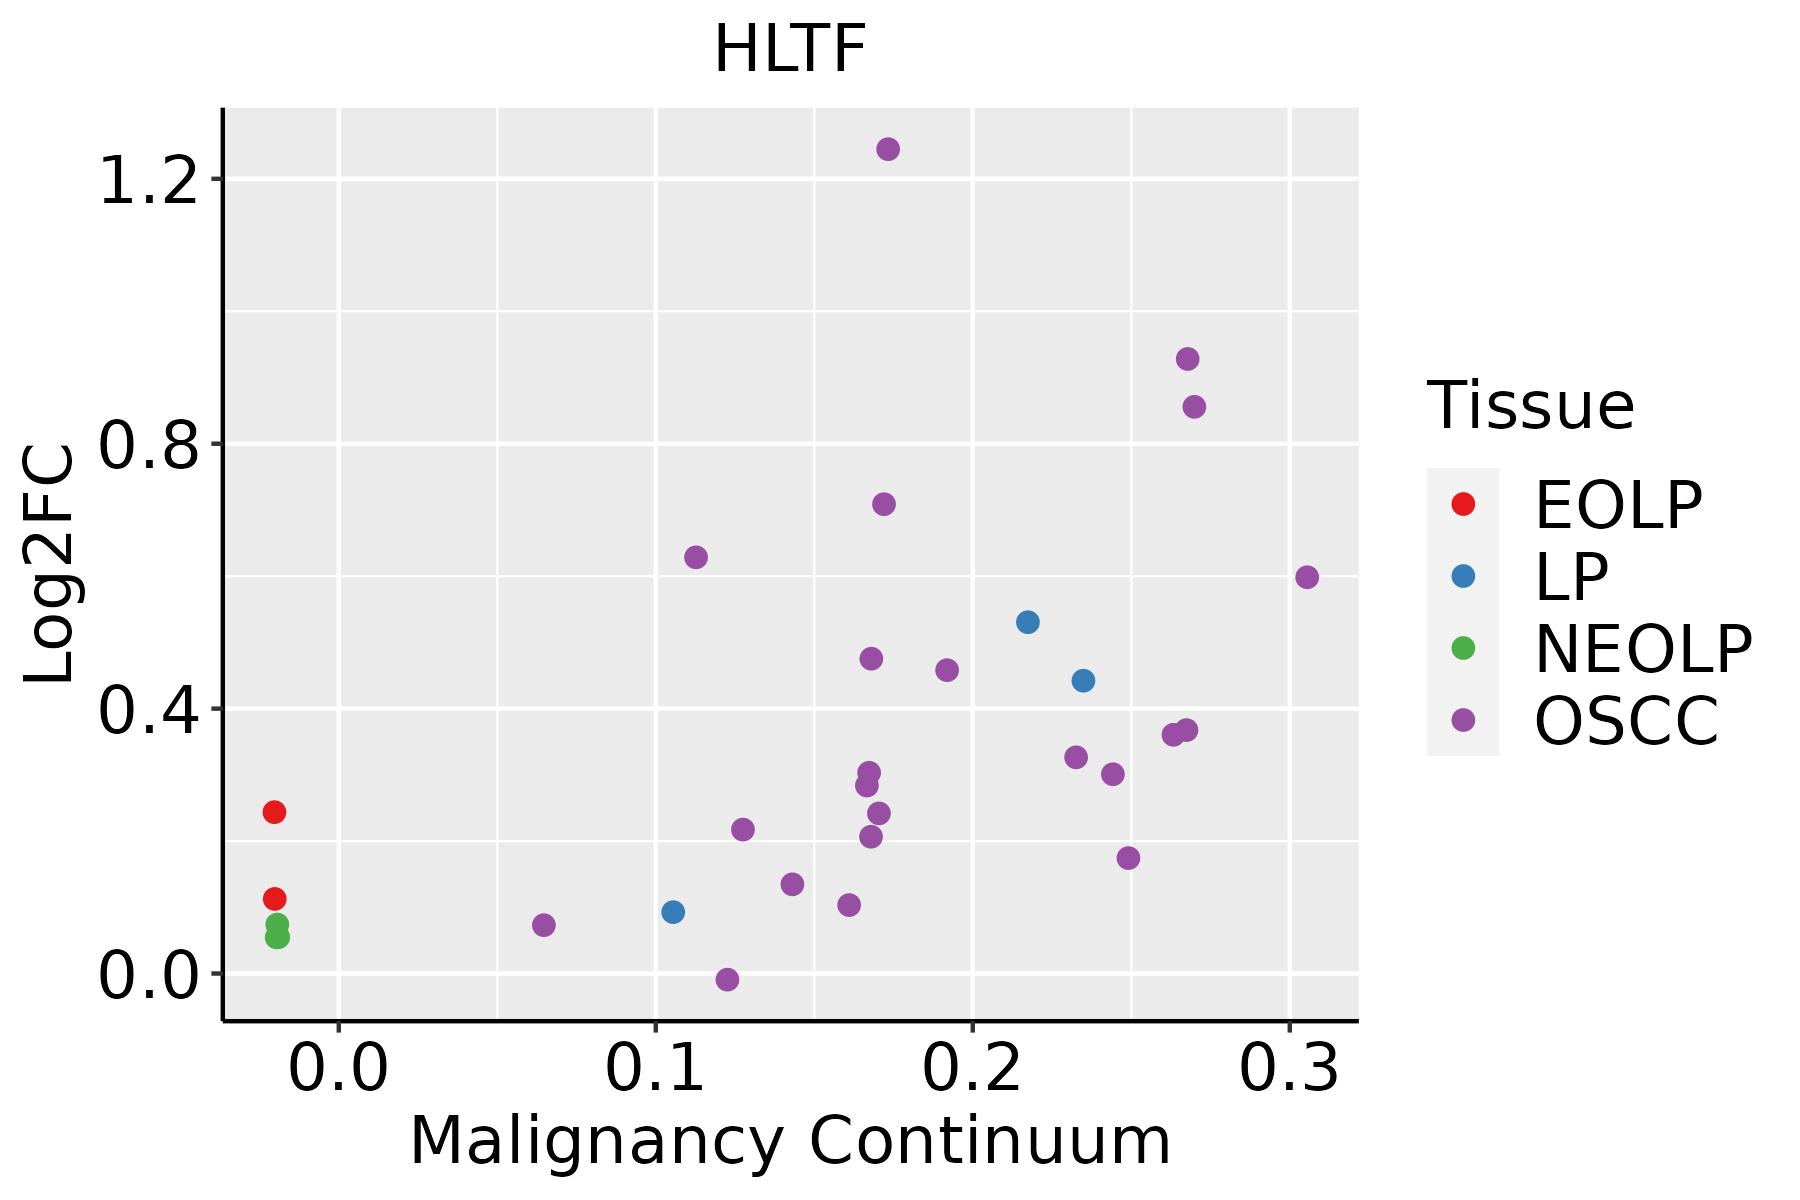 | EOLP: Erosive Oral lichen planus |
| LP: leukoplakia | ||
| NEOLP: Non-erosive oral lichen planus | ||
| OSCC: Oral squamous cell carcinoma | ||
| Skin | 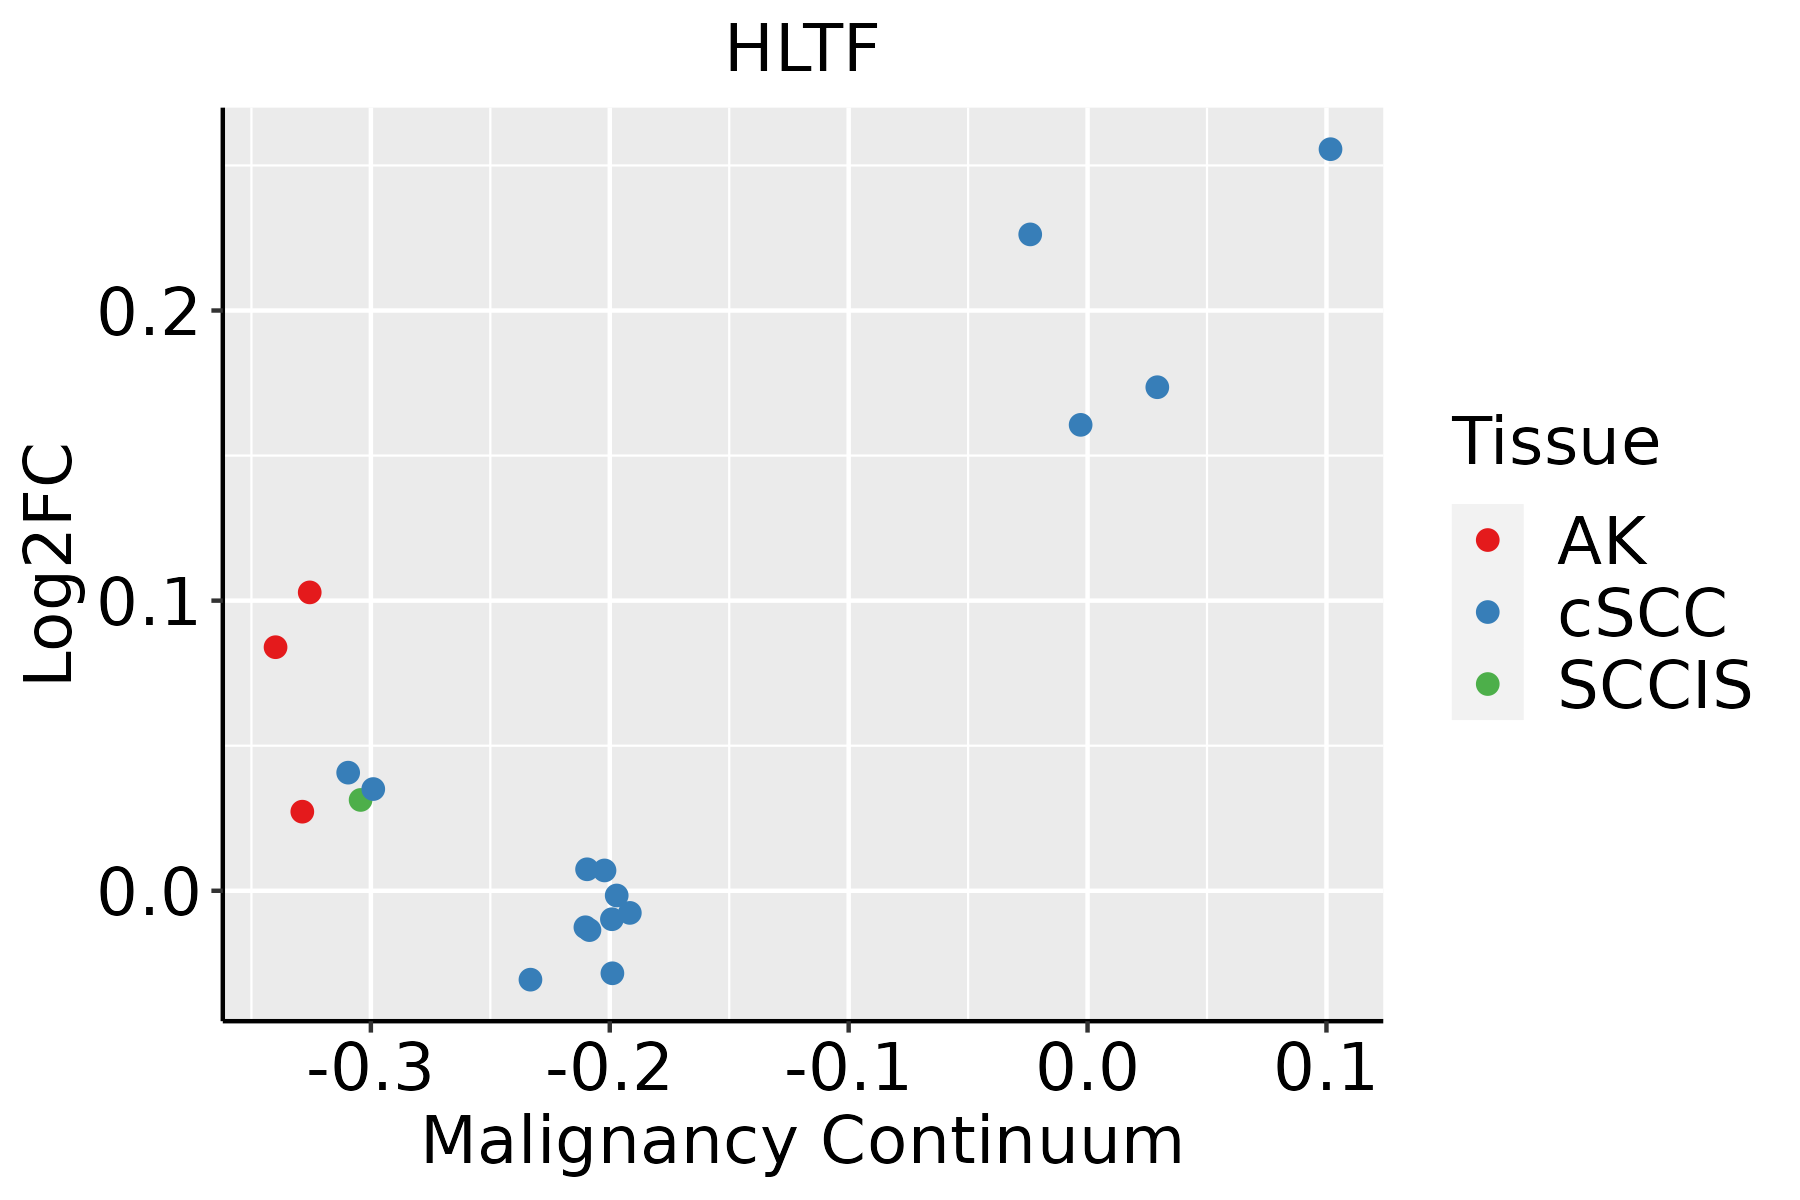 | AK: Actinic keratosis |
| cSCC: Cutaneous squamous cell carcinoma | ||
| SCCIS:squamous cell carcinoma in situ | ||
| Thyroid | 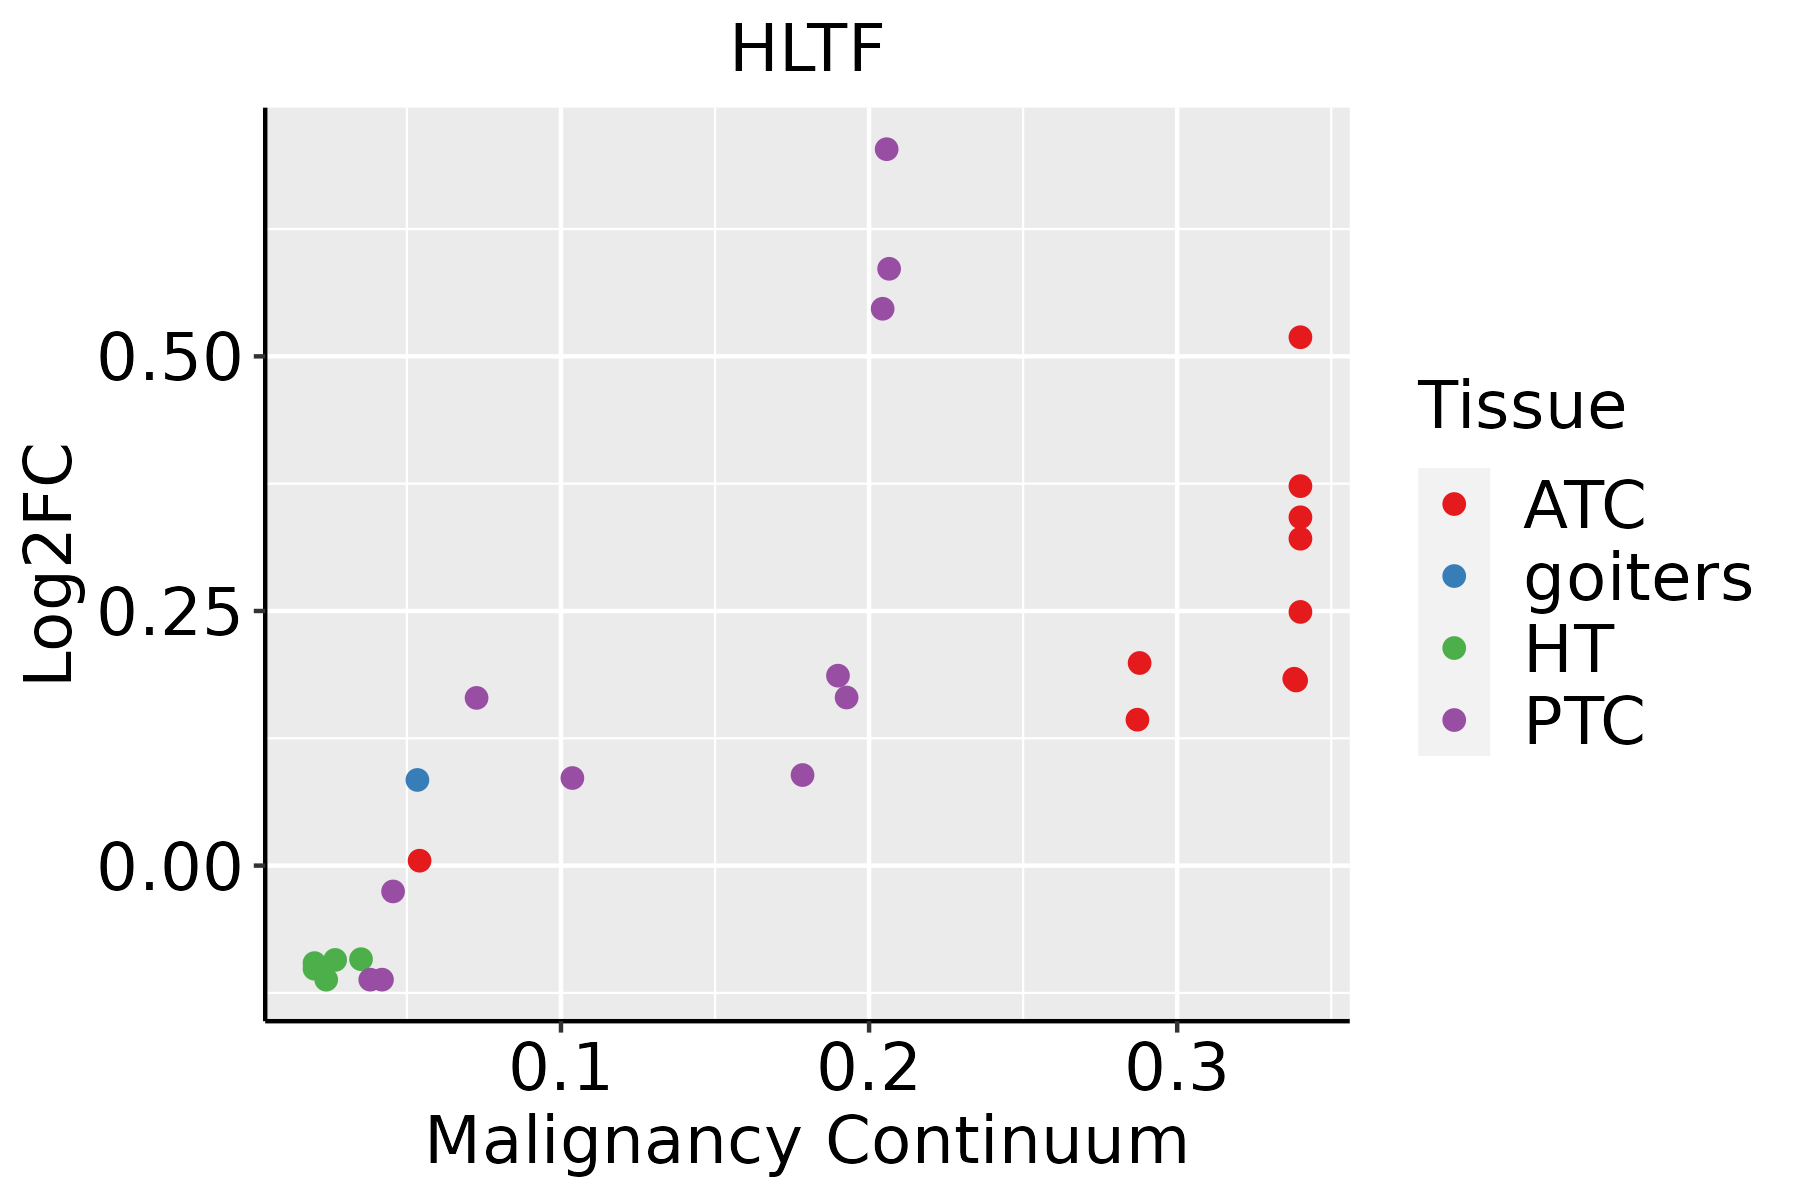 | ATC: Anaplastic thyroid cancer |
| HT: Hashimoto's thyroiditis | ||
| PTC: Papillary thyroid cancer |
| ∗log2FC in expression of this searched gene in stem-like cells from each diseased tissue sample relative to stem-like cells in normal samples in each tissue plotted against the malignancy continuum. Samples are colored based on if they are from different disease stage. |
Top |
Malignant transformation related pathway analysis |
| Find out the enriched GO biological processes and KEGG pathways involved in transition from healthy to precancer to cancer |
| Tissue | Disease Stage | Enriched GO biological Processes |
| Colorectum | AD |  |
| Colorectum | SER |  |
| Colorectum | MSS |  |
| Colorectum | MSI-H |  |
| Colorectum | FAP |  |
| ∗Top 15 enriched GO BP terms are showed in the bar plot of each disease state in each tissue. Each row represents a significant GO biological process which is colored according to the -log10(p.adjust). |
| Page: 1 2 3 4 5 6 7 8 9 |
| GO ID | Tissue | Disease Stage | Description | Gene Ratio | Bg Ratio | pvalue | p.adjust | Count |
| GO:000632517 | Esophagus | ESCC | chromatin organization | 240/8552 | 409/18723 | 6.52e-08 | 1.14e-06 | 240 |
| GO:000632511 | Liver | HCC | chromatin organization | 206/7958 | 409/18723 | 7.23e-04 | 4.41e-03 | 206 |
| GO:000632510 | Oral cavity | OSCC | chromatin organization | 190/7305 | 409/18723 | 1.17e-03 | 5.97e-03 | 190 |
| GO:000632515 | Oral cavity | EOLP | chromatin organization | 84/2218 | 409/18723 | 2.68e-07 | 8.16e-06 | 84 |
| GO:000632519 | Skin | cSCC | chromatin organization | 147/4864 | 409/18723 | 4.41e-06 | 6.52e-05 | 147 |
| GO:000632520 | Thyroid | PTC | chromatin organization | 183/5968 | 409/18723 | 2.55e-08 | 5.70e-07 | 183 |
| GO:0006325110 | Thyroid | ATC | chromatin organization | 189/6293 | 409/18723 | 6.40e-08 | 1.13e-06 | 189 |
| Page: 1 |
| Pathway ID | Tissue | Disease Stage | Description | Gene Ratio | Bg Ratio | pvalue | p.adjust | qvalue | Count |
| Page: 1 |
Top |
Cell-cell communication analysis |
| Identification of potential cell-cell interactions between two cell types and their ligand-receptor pairs for different disease states |
| Ligand | Receptor | LRpair | Pathway | Tissue | Disease Stage |
| Page: 1 |
Top |
Single-cell gene regulatory network inference analysis |
| Find out the significant the regulons (TFs) and the target genes of each regulon across cell types for different disease states |
| TF | Cell Type | Tissue | Disease Stage | Target Gene | RSS | Regulon Activity |
| HLTF | BAS | Endometrium | Healthy | SREBF1,EZH2,DDX58, etc. | 2.54e-01 |  |
| HLTF | MAST | Oral cavity | ADJ | EXD3,NKAPD1,TMEM220, etc. | 6.47e-02 |  |
| HLTF | NK | Oral cavity | Healthy | EXD3,NKAPD1,TMEM220, etc. | 1.97e-01 |  |
| HLTF | MAST | Oral cavity | Healthy | EXD3,NKAPD1,TMEM220, etc. | 2.13e-01 | |
| HLTF | MAST | Oral cavity | LP | EXD3,NKAPD1,TMEM220, etc. | 1.65e-01 |  |
| HLTF | CD8TEXP | Oral cavity | LP | EXD3,NKAPD1,TMEM220, etc. | 3.71e-02 | |
| HLTF | MAST | Oral cavity | OSCC | EXD3,NKAPD1,TMEM220, etc. | 2.23e-01 |  |
| HLTF | SMC | Pancreas | ADJ | CEP76,BTBD3,CC2D2B, etc. | 2.49e-02 |  |
| HLTF | PSC | Pancreas | ADJ | CEP76,BTBD3,CC2D2B, etc. | 1.25e-01 | |
| HLTF | FIB | Pancreas | PDAC | CEP76,BTBD3,CC2D2B, etc. | 3.13e-02 |  |
| ∗The dot plots of a searched regulon are shown for all cell subpopulations in each disease state of each tissue based on the regulon specific score inferred using pySCENIC and by calculating the average expression. |
| Page: 1 2 |
Top |
Somatic mutation of malignant transformation related genes |
| Annotation of somatic variants for genes involved in malignant transformation |
| Hugo Symbol | Variant Class | Variant Classification | dbSNP RS | HGVSc | HGVSp | HGVSp Short | SWISSPROT | BIOTYPE | SIFT | PolyPhen | Tumor Sample Barcode | Tissue | Histology | Sex | Age | Stage | Therapy Types | Drugs | Outcome |
| HLTF | SNV | Missense_Mutation | novel | c.830N>T | p.Asn277Ile | p.N277I | Q14527 | protein_coding | deleterious(0.04) | probably_damaging(0.98) | TCGA-A5-A0G2-01 | Endometrium | uterine corpus endometrioid carcinoma | Female | <65 | III/IV | Unknown | Unknown | SD |
| HLTF | SNV | Missense_Mutation | novel | c.1694C>T | p.Pro565Leu | p.P565L | Q14527 | protein_coding | deleterious(0.01) | probably_damaging(0.997) | TCGA-A5-A0VP-01 | Endometrium | uterine corpus endometrioid carcinoma | Female | >=65 | I/II | Unknown | Unknown | SD |
| HLTF | SNV | Missense_Mutation | novel | c.1505N>C | p.Val502Ala | p.V502A | Q14527 | protein_coding | deleterious(0.01) | probably_damaging(0.965) | TCGA-A5-A2K3-01 | Endometrium | uterine corpus endometrioid carcinoma | Female | >=65 | I/II | Chemotherapy | carboplatin | SD |
| HLTF | SNV | Missense_Mutation | rs527812739 | c.800N>A | p.Arg267Gln | p.R267Q | Q14527 | protein_coding | deleterious(0.04) | possibly_damaging(0.678) | TCGA-A5-A2K3-01 | Endometrium | uterine corpus endometrioid carcinoma | Female | >=65 | I/II | Chemotherapy | carboplatin | SD |
| HLTF | SNV | Missense_Mutation | novel | c.2506N>G | p.Asn836Asp | p.N836D | Q14527 | protein_coding | tolerated(0.5) | benign(0.014) | TCGA-A5-A2K5-01 | Endometrium | uterine corpus endometrioid carcinoma | Female | >=65 | I/II | Unknown | Unknown | SD |
| HLTF | SNV | Missense_Mutation | c.2517N>A | p.Met839Ile | p.M839I | Q14527 | protein_coding | deleterious(0.02) | benign(0.23) | TCGA-AP-A051-01 | Endometrium | uterine corpus endometrioid carcinoma | Female | >=65 | I/II | Unknown | Unknown | SD | |
| HLTF | SNV | Missense_Mutation | rs535340588 | c.1069N>A | p.Ala357Thr | p.A357T | Q14527 | protein_coding | tolerated(0.52) | benign(0.015) | TCGA-AP-A051-01 | Endometrium | uterine corpus endometrioid carcinoma | Female | >=65 | I/II | Unknown | Unknown | SD |
| HLTF | SNV | Missense_Mutation | c.2407G>T | p.Asp803Tyr | p.D803Y | Q14527 | protein_coding | deleterious(0) | benign(0.417) | TCGA-AP-A056-01 | Endometrium | uterine corpus endometrioid carcinoma | Female | <65 | I/II | Unknown | Unknown | SD | |
| HLTF | SNV | Missense_Mutation | c.286A>C | p.Asn96His | p.N96H | Q14527 | protein_coding | deleterious(0) | probably_damaging(0.999) | TCGA-AP-A056-01 | Endometrium | uterine corpus endometrioid carcinoma | Female | <65 | I/II | Unknown | Unknown | SD | |
| HLTF | SNV | Missense_Mutation | c.1278N>T | p.Arg426Ser | p.R426S | Q14527 | protein_coding | tolerated(0.43) | benign(0.015) | TCGA-AP-A059-01 | Endometrium | uterine corpus endometrioid carcinoma | Female | >=65 | I/II | Unknown | Unknown | SD |
| Page: 1 2 3 4 5 6 7 8 9 10 11 12 |
Top |
Related drugs of malignant transformation related genes |
| Identification of chemicals and drugs interact with genes involved in malignant transfromation |
| (DGIdb 4.0) |
| Entrez ID | Symbol | Category | Interaction Types | Drug Claim Name | Drug Name | PMIDs |
| Page: 1 |

Copyright 2023-Present -The University of Texas Health Science Center at Houston |