
|
|||||
|
 | |
| |
| |
| |
| |
| |
|
Gene: CDK5RAP3 |
Gene summary for CDK5RAP3 |
| Gene information | Species | Human | Gene symbol | CDK5RAP3 | Gene ID | 80279 |
| Gene name | CDK5 regulatory subunit associated protein 3 | |
| Gene Alias | C53 | |
| Cytomap | 17q21.32 | |
| Gene Type | protein-coding | GO ID | GO:0000075 | UniProtAcc | Q96JB5 |
Top |
Malignant transformation analysis |
| Identification of the aberrant gene expression in precancerous and cancerous lesions by comparing the gene expression of stem-like cells in diseased tissues with normal stem cells |
| Entrez ID | Symbol | Replicates | Species | Organ | Tissue | Adj P-value | Log2FC | Malignancy |
| 80279 | CDK5RAP3 | HTA11_2487_2000001011 | Human | Colorectum | SER | 5.15e-03 | 1.88e-01 | -0.1808 |
| 80279 | CDK5RAP3 | HTA11_78_2000001011 | Human | Colorectum | AD | 3.71e-03 | 2.30e-01 | -0.1088 |
| 80279 | CDK5RAP3 | HTA11_347_2000001011 | Human | Colorectum | AD | 2.44e-07 | 2.32e-01 | -0.1954 |
| 80279 | CDK5RAP3 | HTA11_411_2000001011 | Human | Colorectum | SER | 2.94e-02 | 4.83e-01 | -0.2602 |
| 80279 | CDK5RAP3 | HTA11_83_2000001011 | Human | Colorectum | SER | 3.04e-03 | 1.89e-01 | -0.1526 |
| 80279 | CDK5RAP3 | HTA11_696_2000001011 | Human | Colorectum | AD | 9.34e-04 | 2.48e-01 | -0.1464 |
| 80279 | CDK5RAP3 | HTA11_1391_2000001011 | Human | Colorectum | AD | 3.82e-08 | 3.86e-01 | -0.059 |
| 80279 | CDK5RAP3 | HTA11_866_3004761011 | Human | Colorectum | AD | 1.65e-05 | 2.61e-01 | 0.096 |
| 80279 | CDK5RAP3 | HTA11_4255_2000001011 | Human | Colorectum | SER | 4.01e-03 | 2.84e-01 | 0.0446 |
| 80279 | CDK5RAP3 | HTA11_99999970781_79442 | Human | Colorectum | MSS | 5.76e-04 | 2.95e-01 | 0.294 |
| 80279 | CDK5RAP3 | HTA11_99999971662_82457 | Human | Colorectum | MSS | 2.02e-11 | 5.41e-01 | 0.3859 |
| 80279 | CDK5RAP3 | HTA11_99999974143_84620 | Human | Colorectum | MSS | 2.06e-08 | 4.05e-01 | 0.3005 |
| 80279 | CDK5RAP3 | A015-C-203 | Human | Colorectum | FAP | 3.80e-06 | 3.77e-01 | -0.1294 |
| 80279 | CDK5RAP3 | A015-C-006 | Human | Colorectum | FAP | 2.12e-07 | 5.33e-01 | -0.0994 |
| 80279 | CDK5RAP3 | A015-C-104 | Human | Colorectum | FAP | 1.22e-08 | 4.20e-01 | -0.1899 |
| 80279 | CDK5RAP3 | A018-E-020 | Human | Colorectum | FAP | 6.60e-03 | 3.23e-01 | -0.2034 |
| 80279 | CDK5RAP3 | LZE2T | Human | Esophagus | ESCC | 2.94e-10 | 3.56e-01 | 0.082 |
| 80279 | CDK5RAP3 | LZE4T | Human | Esophagus | ESCC | 4.96e-12 | 2.06e-01 | 0.0811 |
| 80279 | CDK5RAP3 | LZE5T | Human | Esophagus | ESCC | 2.26e-05 | 3.10e-01 | 0.0514 |
| 80279 | CDK5RAP3 | LZE7T | Human | Esophagus | ESCC | 4.23e-11 | 6.73e-01 | 0.0667 |
| Page: 1 2 3 4 5 6 7 8 |
| Tissue | Expression Dynamics | Abbreviation |
| Colorectum (GSE201348) |  | FAP: Familial adenomatous polyposis |
| CRC: Colorectal cancer | ||
| Colorectum (HTA11) |  | AD: Adenomas |
| SER: Sessile serrated lesions | ||
| MSI-H: Microsatellite-high colorectal cancer | ||
| MSS: Microsatellite stable colorectal cancer | ||
| Esophagus |  | ESCC: Esophageal squamous cell carcinoma |
| HGIN: High-grade intraepithelial neoplasias | ||
| LGIN: Low-grade intraepithelial neoplasias | ||
| Liver |  | HCC: Hepatocellular carcinoma |
| NAFLD: Non-alcoholic fatty liver disease | ||
| Oral Cavity | 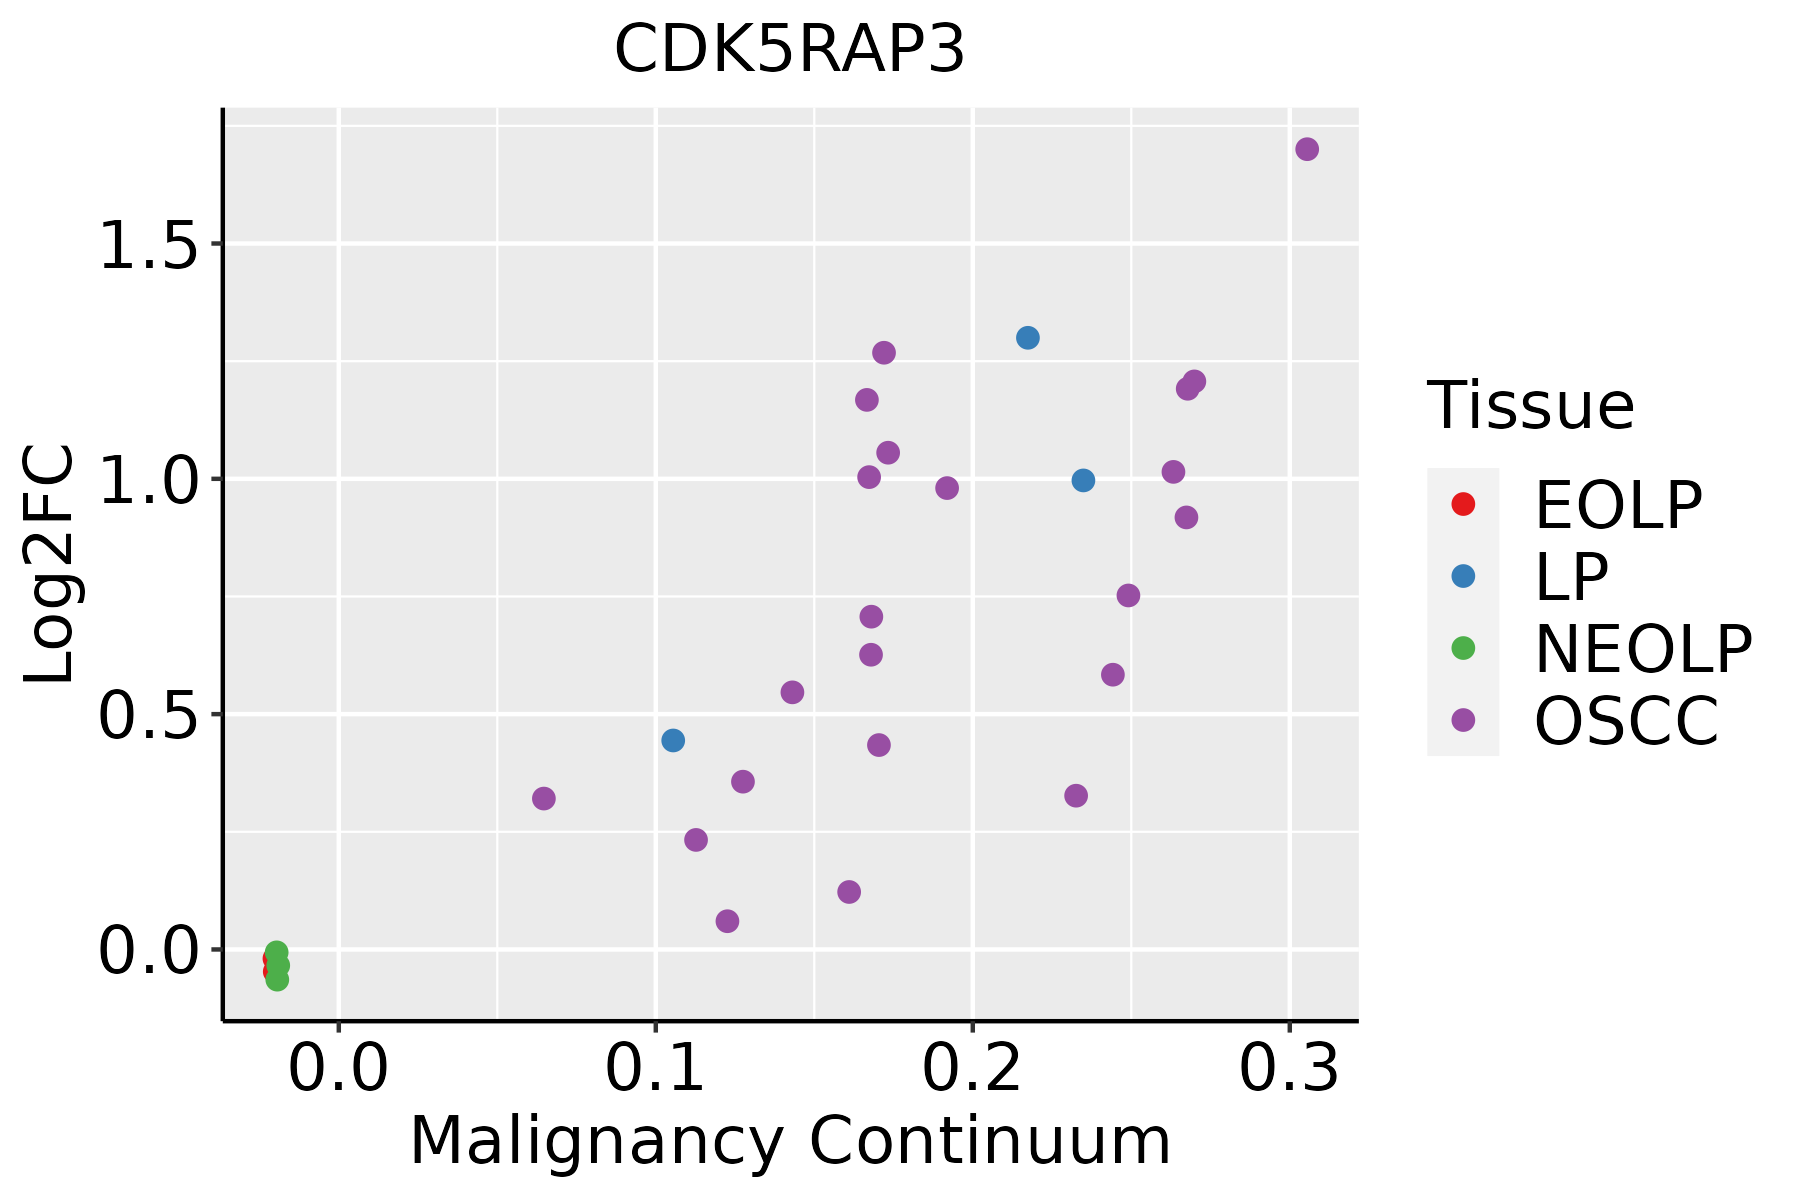 | EOLP: Erosive Oral lichen planus |
| LP: leukoplakia | ||
| NEOLP: Non-erosive oral lichen planus | ||
| OSCC: Oral squamous cell carcinoma | ||
| Prostate | 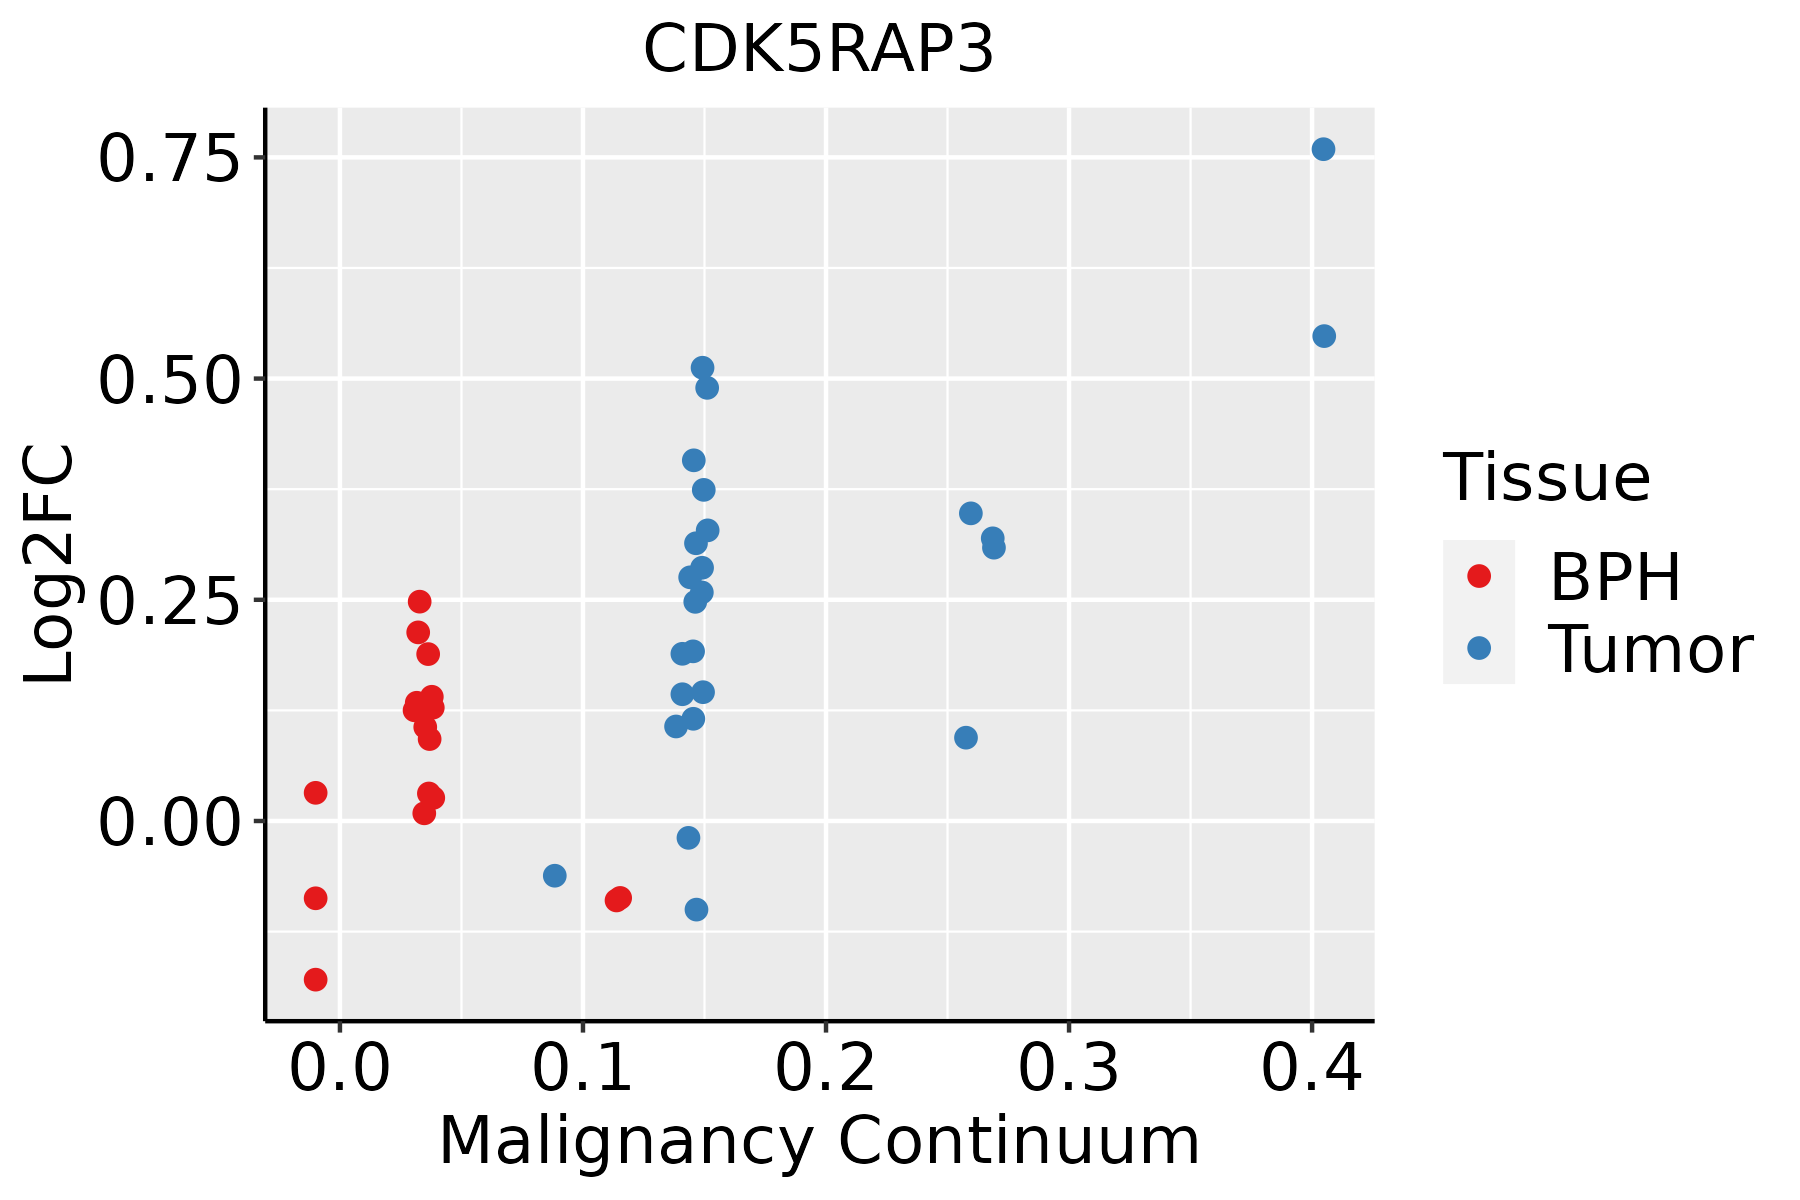 | BPH: Benign Prostatic Hyperplasia |
| Skin | 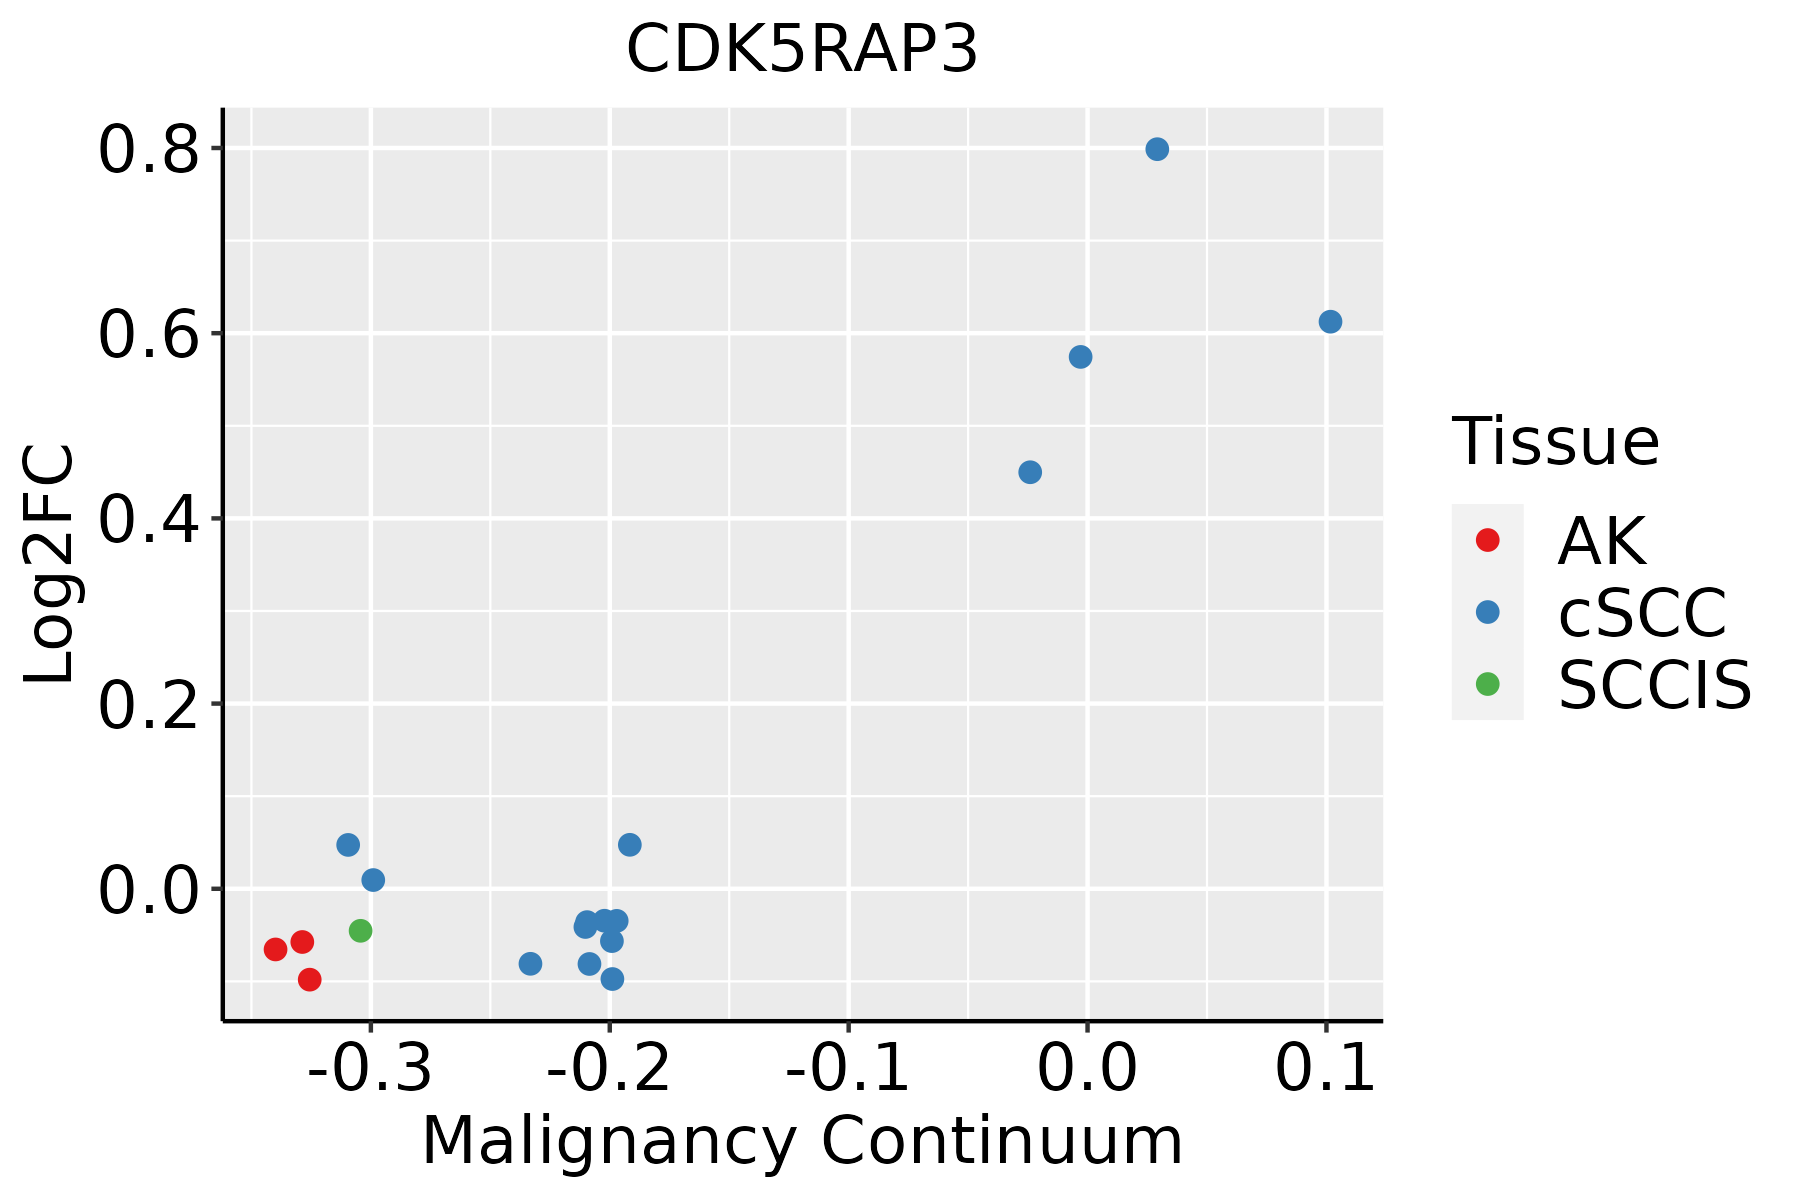 | AK: Actinic keratosis |
| cSCC: Cutaneous squamous cell carcinoma | ||
| SCCIS:squamous cell carcinoma in situ | ||
| Thyroid |  | ATC: Anaplastic thyroid cancer |
| HT: Hashimoto's thyroiditis | ||
| PTC: Papillary thyroid cancer |
| ∗log2FC in expression of this searched gene in stem-like cells from each diseased tissue sample relative to stem-like cells in normal samples in each tissue plotted against the malignancy continuum. Samples are colored based on if they are from different disease stage. |
Top |
Malignant transformation related pathway analysis |
| Find out the enriched GO biological processes and KEGG pathways involved in transition from healthy to precancer to cancer |
| Tissue | Disease Stage | Enriched GO biological Processes |
| Colorectum | AD |  |
| Colorectum | SER |  |
| Colorectum | MSS |  |
| Colorectum | MSI-H |  |
| Colorectum | FAP |  |
| ∗Top 15 enriched GO BP terms are showed in the bar plot of each disease state in each tissue. Each row represents a significant GO biological process which is colored according to the -log10(p.adjust). |
| Page: 1 2 3 4 5 6 7 8 9 |
| GO ID | Tissue | Disease Stage | Description | Gene Ratio | Bg Ratio | pvalue | p.adjust | Count |
| GO:0042176 | Colorectum | AD | regulation of protein catabolic process | 160/3918 | 391/18723 | 1.06e-19 | 7.34e-17 | 160 |
| GO:1903362 | Colorectum | AD | regulation of cellular protein catabolic process | 109/3918 | 255/18723 | 2.14e-15 | 6.08e-13 | 109 |
| GO:0009895 | Colorectum | AD | negative regulation of catabolic process | 124/3918 | 320/18723 | 1.66e-13 | 3.35e-11 | 124 |
| GO:1903829 | Colorectum | AD | positive regulation of cellular protein localization | 110/3918 | 276/18723 | 4.58e-13 | 8.44e-11 | 110 |
| GO:0031330 | Colorectum | AD | negative regulation of cellular catabolic process | 104/3918 | 262/18723 | 2.66e-12 | 3.96e-10 | 104 |
| GO:0048732 | Colorectum | AD | gland development | 149/3918 | 436/18723 | 6.07e-11 | 6.33e-09 | 149 |
| GO:0022411 | Colorectum | AD | cellular component disassembly | 147/3918 | 443/18723 | 8.53e-10 | 6.76e-08 | 147 |
| GO:0042177 | Colorectum | AD | negative regulation of protein catabolic process | 55/3918 | 121/18723 | 1.19e-09 | 8.85e-08 | 55 |
| GO:1903363 | Colorectum | AD | negative regulation of cellular protein catabolic process | 39/3918 | 75/18723 | 2.69e-09 | 1.87e-07 | 39 |
| GO:0034976 | Colorectum | AD | response to endoplasmic reticulum stress | 90/3918 | 256/18723 | 8.48e-08 | 4.28e-06 | 90 |
| GO:1903320 | Colorectum | AD | regulation of protein modification by small protein conjugation or removal | 86/3918 | 242/18723 | 9.43e-08 | 4.65e-06 | 86 |
| GO:1900180 | Colorectum | AD | regulation of protein localization to nucleus | 55/3918 | 136/18723 | 1.70e-07 | 7.34e-06 | 55 |
| GO:0034101 | Colorectum | AD | erythrocyte homeostasis | 51/3918 | 129/18723 | 1.07e-06 | 3.59e-05 | 51 |
| GO:0030099 | Colorectum | AD | myeloid cell differentiation | 119/3918 | 381/18723 | 1.24e-06 | 4.01e-05 | 119 |
| GO:1900182 | Colorectum | AD | positive regulation of protein localization to nucleus | 38/3918 | 87/18723 | 1.43e-06 | 4.52e-05 | 38 |
| GO:0034504 | Colorectum | AD | protein localization to nucleus | 94/3918 | 290/18723 | 2.83e-06 | 8.09e-05 | 94 |
| GO:0031396 | Colorectum | AD | regulation of protein ubiquitination | 72/3918 | 210/18723 | 4.50e-06 | 1.21e-04 | 72 |
| GO:0002262 | Colorectum | AD | myeloid cell homeostasis | 57/3918 | 157/18723 | 6.17e-06 | 1.56e-04 | 57 |
| GO:0061008 | Colorectum | AD | hepaticobiliary system development | 55/3918 | 150/18723 | 6.34e-06 | 1.59e-04 | 55 |
| GO:0001889 | Colorectum | AD | liver development | 54/3918 | 147/18723 | 7.20e-06 | 1.77e-04 | 54 |
| Page: 1 2 3 4 5 6 7 8 9 10 11 12 13 14 15 16 17 18 19 20 21 22 23 24 25 26 27 28 29 30 31 32 33 34 35 36 37 38 39 40 41 42 43 |
| Pathway ID | Tissue | Disease Stage | Description | Gene Ratio | Bg Ratio | pvalue | p.adjust | qvalue | Count |
| Page: 1 |
Top |
Cell-cell communication analysis |
| Identification of potential cell-cell interactions between two cell types and their ligand-receptor pairs for different disease states |
| Ligand | Receptor | LRpair | Pathway | Tissue | Disease Stage |
| Page: 1 |
Top |
Single-cell gene regulatory network inference analysis |
| Find out the significant the regulons (TFs) and the target genes of each regulon across cell types for different disease states |
| TF | Cell Type | Tissue | Disease Stage | Target Gene | RSS | Regulon Activity |
| ∗The dot plots of a searched regulon are shown for all cell subpopulations in each disease state of each tissue based on the regulon specific score inferred using pySCENIC and by calculating the average expression. |
| Page: 1 |
Top |
Somatic mutation of malignant transformation related genes |
| Annotation of somatic variants for genes involved in malignant transformation |
| Hugo Symbol | Variant Class | Variant Classification | dbSNP RS | HGVSc | HGVSp | HGVSp Short | SWISSPROT | BIOTYPE | SIFT | PolyPhen | Tumor Sample Barcode | Tissue | Histology | Sex | Age | Stage | Therapy Types | Drugs | Outcome |
| CDK5RAP3 | SNV | Missense_Mutation | c.1273N>T | p.Thr425Ser | p.T425S | Q96JB5 | protein_coding | tolerated(0.79) | benign(0.001) | TCGA-39-5027-01 | Lung | lung squamous cell carcinoma | Male | >=65 | I/II | Unknown | Unknown | PD | |
| CDK5RAP3 | SNV | Missense_Mutation | novel | c.238N>A | p.Ala80Thr | p.A80T | Q96JB5 | protein_coding | tolerated(0.73) | benign(0.015) | TCGA-63-A5MM-01 | Lung | lung squamous cell carcinoma | Female | >=65 | I/II | Chemotherapy | cisplatin | PD |
| CDK5RAP3 | SNV | Missense_Mutation | novel | c.1355N>A | p.Pro452Gln | p.P452Q | Q96JB5 | protein_coding | deleterious(0) | probably_damaging(0.999) | TCGA-CN-6010-01 | Oral cavity | head & neck squamous cell carcinoma | Male | <65 | I/II | Chemotherapy | cisplatin | PD |
| CDK5RAP3 | SNV | Missense_Mutation | rs755776677 | c.1585N>G | p.Thr529Ala | p.T529A | Q96JB5 | protein_coding | tolerated(0.2) | benign(0.014) | TCGA-BR-8680-01 | Stomach | stomach adenocarcinoma | Male | <65 | III/IV | Chemotherapy | oxaliplatin | CR |
| Page: 1 2 3 4 |
Top |
Related drugs of malignant transformation related genes |
| Identification of chemicals and drugs interact with genes involved in malignant transfromation |
| (DGIdb 4.0) |
| Entrez ID | Symbol | Category | Interaction Types | Drug Claim Name | Drug Name | PMIDs |
| Page: 1 |

Copyright 2023-Present -The University of Texas Health Science Center at Houston |