
|
|||||
|
 | |
| |
| |
| |
| |
| |
|
Gene: AQP8 |
Gene summary for AQP8 |
| Gene information | Species | Human | Gene symbol | AQP8 | Gene ID | 343 |
| Gene name | aquaporin 8 | |
| Gene Alias | AQP-8 | |
| Cytomap | 16p12.1 | |
| Gene Type | protein-coding | GO ID | GO:0006810 | UniProtAcc | O94778 |
Top |
Malignant transformation analysis |
| Identification of the aberrant gene expression in precancerous and cancerous lesions by comparing the gene expression of stem-like cells in diseased tissues with normal stem cells |
| Entrez ID | Symbol | Replicates | Species | Organ | Tissue | Adj P-value | Log2FC | Malignancy |
| 343 | AQP8 | HTA11_2487_2000001011 | Human | Colorectum | SER | 2.99e-05 | 1.07e+00 | -0.1808 |
| 343 | AQP8 | HTA11_347_2000001011 | Human | Colorectum | AD | 3.66e-05 | 8.99e-01 | -0.1954 |
| 343 | AQP8 | HTA11_3361_2000001011 | Human | Colorectum | AD | 4.74e-13 | 1.54e+00 | -0.1207 |
| 343 | AQP8 | HTA11_5212_2000001011 | Human | Colorectum | AD | 3.16e-08 | 1.80e+00 | -0.2061 |
| 343 | AQP8 | A008-E-015 | Human | Colorectum | FAP | 1.48e-20 | 5.65e-01 | 0.0177 |
| 343 | AQP8 | HTA12-29-1 | Human | Pancreas | PDAC | 1.49e-09 | -5.10e-01 | 0.3722 |
| 343 | AQP8 | HTA12-9-1 | Human | Pancreas | PDAC | 2.56e-03 | -5.10e-01 | 0.1532 |
| 343 | AQP8 | 3829-EC | Human | Pancreas | PanIN | 6.87e-05 | -2.73e-01 | 0.009 |
| 343 | AQP8 | 4347-EC | Human | Pancreas | PanIN | 2.39e-12 | -3.91e-01 | 0.0572 |
| 343 | AQP8 | DS20191261Tumor | Human | Pancreas | PDAC | 1.56e-04 | -5.10e-01 | 0.1367 |
| Page: 1 |
| Tissue | Expression Dynamics | Abbreviation |
| Colorectum (GSE201348) | 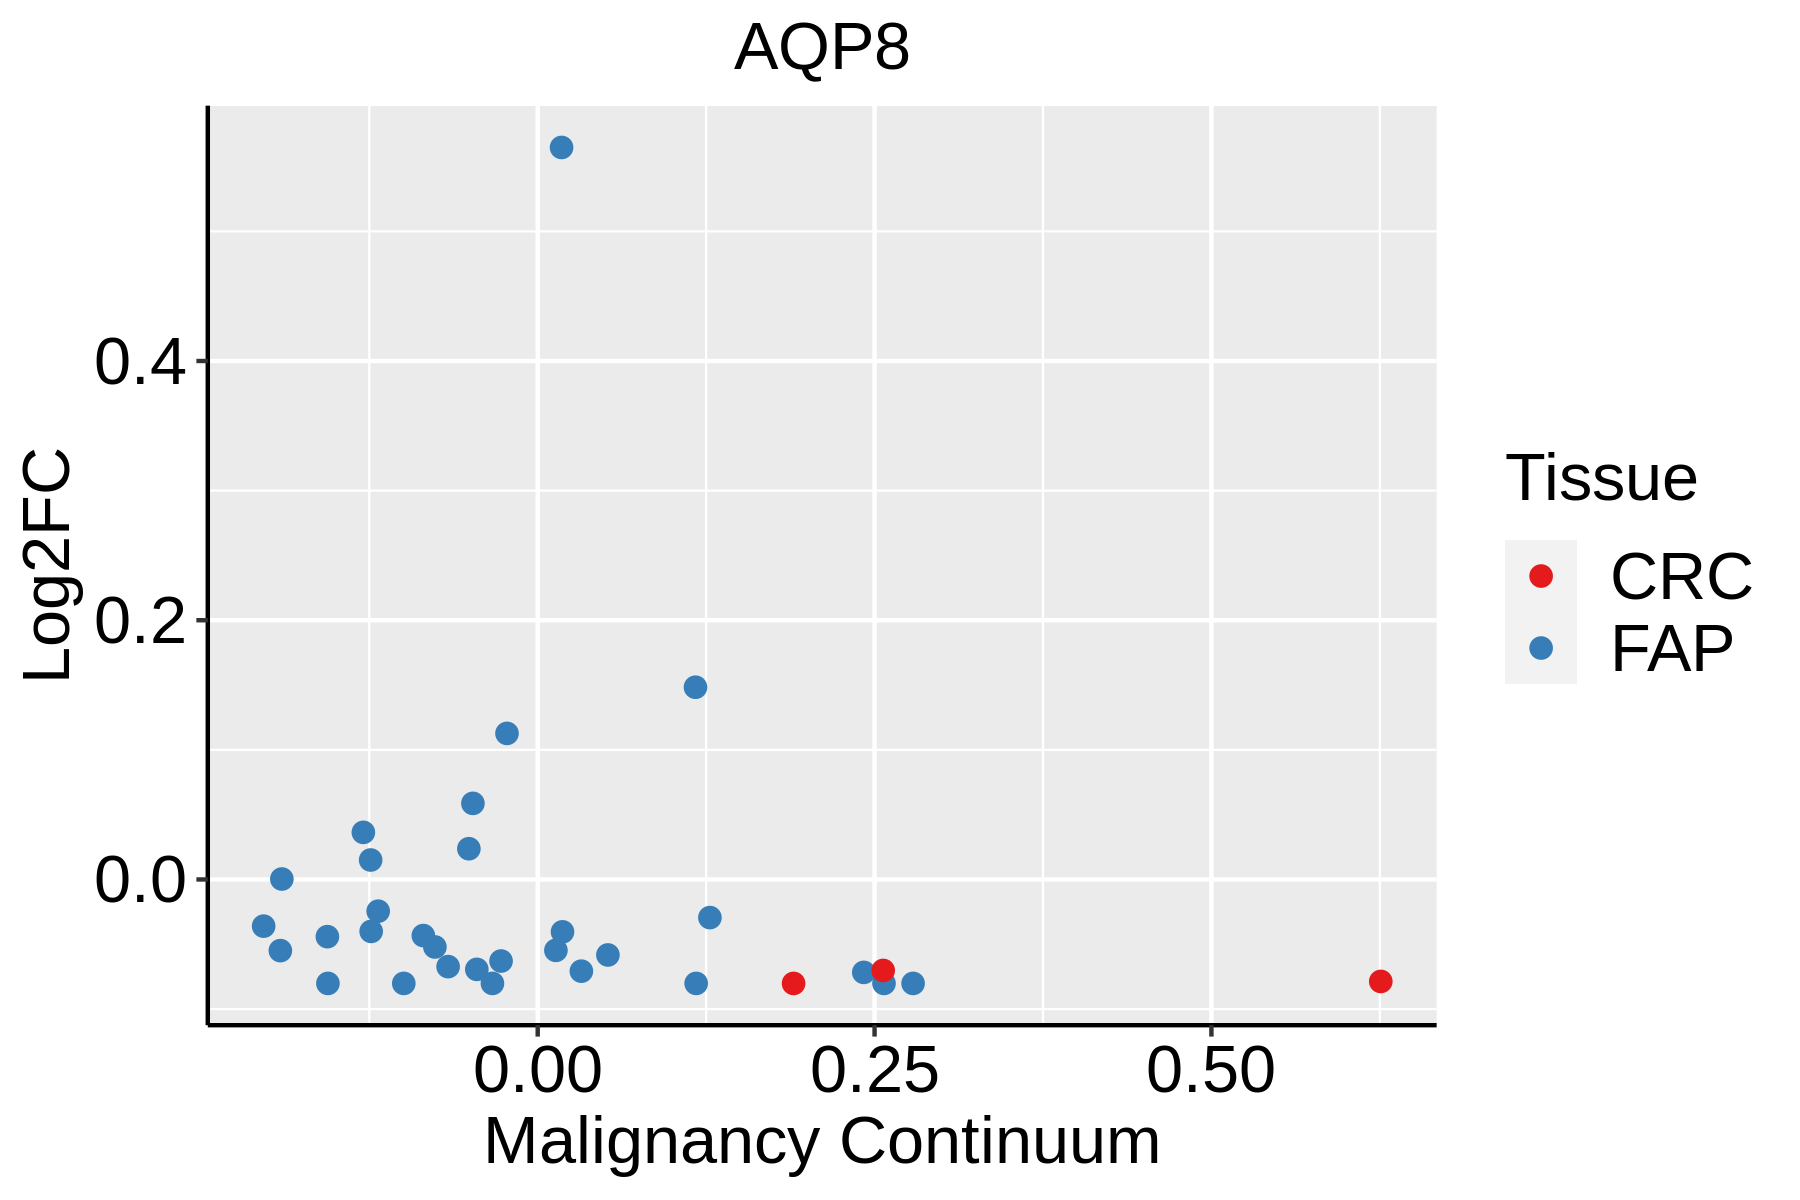 | FAP: Familial adenomatous polyposis |
| CRC: Colorectal cancer | ||
| Colorectum (HTA11) |  | AD: Adenomas |
| SER: Sessile serrated lesions | ||
| MSI-H: Microsatellite-high colorectal cancer | ||
| MSS: Microsatellite stable colorectal cancer |
| ∗log2FC in expression of this searched gene in stem-like cells from each diseased tissue sample relative to stem-like cells in normal samples in each tissue plotted against the malignancy continuum. Samples are colored based on if they are from different disease stage. |
Top |
Malignant transformation related pathway analysis |
| Find out the enriched GO biological processes and KEGG pathways involved in transition from healthy to precancer to cancer |
| Tissue | Disease Stage | Enriched GO biological Processes |
| Colorectum | AD |  |
| Colorectum | SER |  |
| Colorectum | MSS |  |
| Colorectum | MSI-H |  |
| Colorectum | FAP |  |
| ∗Top 15 enriched GO BP terms are showed in the bar plot of each disease state in each tissue. Each row represents a significant GO biological process which is colored according to the -log10(p.adjust). |
| Page: 1 2 3 4 5 6 7 8 9 |
| GO ID | Tissue | Disease Stage | Description | Gene Ratio | Bg Ratio | pvalue | p.adjust | Count |
| GO:0051591 | Colorectum | AD | response to cAMP | 31/3918 | 93/18723 | 3.59e-03 | 2.58e-02 | 31 |
| GO:0071320 | Colorectum | AD | cellular response to cAMP | 20/3918 | 53/18723 | 3.71e-03 | 2.62e-02 | 20 |
| GO:00713201 | Colorectum | SER | cellular response to cAMP | 16/2897 | 53/18723 | 5.09e-03 | 3.91e-02 | 16 |
| GO:00515911 | Colorectum | FAP | response to cAMP | 27/2622 | 93/18723 | 1.26e-04 | 2.03e-03 | 27 |
| GO:0046683 | Colorectum | FAP | response to organophosphorus | 33/2622 | 131/18723 | 4.61e-04 | 5.39e-03 | 33 |
| GO:00713202 | Colorectum | FAP | cellular response to cAMP | 17/2622 | 53/18723 | 6.20e-04 | 6.82e-03 | 17 |
| GO:0014074 | Colorectum | FAP | response to purine-containing compound | 35/2622 | 148/18723 | 1.09e-03 | 1.05e-02 | 35 |
| Page: 1 |
| Pathway ID | Tissue | Disease Stage | Description | Gene Ratio | Bg Ratio | pvalue | p.adjust | qvalue | Count |
| hsa04976 | Colorectum | FAP | Bile secretion | 24/1404 | 89/8465 | 8.76e-03 | 3.21e-02 | 1.96e-02 | 24 |
| hsa049761 | Colorectum | FAP | Bile secretion | 24/1404 | 89/8465 | 8.76e-03 | 3.21e-02 | 1.96e-02 | 24 |
| Page: 1 |
Top |
Cell-cell communication analysis |
| Identification of potential cell-cell interactions between two cell types and their ligand-receptor pairs for different disease states |
| Ligand | Receptor | LRpair | Pathway | Tissue | Disease Stage |
| Page: 1 |
Top |
Single-cell gene regulatory network inference analysis |
| Find out the significant the regulons (TFs) and the target genes of each regulon across cell types for different disease states |
| TF | Cell Type | Tissue | Disease Stage | Target Gene | RSS | Regulon Activity |
| ∗The dot plots of a searched regulon are shown for all cell subpopulations in each disease state of each tissue based on the regulon specific score inferred using pySCENIC and by calculating the average expression. |
| Page: 1 |
Top |
Somatic mutation of malignant transformation related genes |
| Annotation of somatic variants for genes involved in malignant transformation |
| Hugo Symbol | Variant Class | Variant Classification | dbSNP RS | HGVSc | HGVSp | HGVSp Short | SWISSPROT | BIOTYPE | SIFT | PolyPhen | Tumor Sample Barcode | Tissue | Histology | Sex | Age | Stage | Therapy Types | Drugs | Outcome |
| AQP8 | SNV | Missense_Mutation | rs139054676 | c.370N>A | p.Gly124Arg | p.G124R | O94778 | protein_coding | deleterious(0) | probably_damaging(0.999) | TCGA-HU-A4GC-01 | Stomach | stomach adenocarcinoma | Male | >=65 | III/IV | Unknown | Unknown | SD |
| AQP8 | SNV | Missense_Mutation | novel | c.263N>C | p.Gly88Ala | p.G88A | O94778 | protein_coding | deleterious(0) | probably_damaging(0.998) | TCGA-VQ-A92D-01 | Stomach | stomach adenocarcinoma | Male | >=65 | I/II | Unknown | Unknown | SD |
| Page: 1 2 3 4 |
Top |
Related drugs of malignant transformation related genes |
| Identification of chemicals and drugs interact with genes involved in malignant transfromation |
| (DGIdb 4.0) |
| Entrez ID | Symbol | Category | Interaction Types | Drug Claim Name | Drug Name | PMIDs |
| 343 | AQP8 | ION CHANNEL | inhibitor | 178101032 | ||
| 343 | AQP8 | ION CHANNEL | ETHINYLESTRADIOL | ETHINYL ESTRADIOL | 18683753 |
| Page: 1 |

Copyright 2023-Present -The University of Texas Health Science Center at Houston |