
|
|||||
|
 | |
| |
| |
| |
| |
| |
|
Gene: AHSA1 |
Gene summary for AHSA1 |
| Gene information | Species | Human | Gene symbol | AHSA1 | Gene ID | 10598 |
| Gene name | activator of HSP90 ATPase activity 1 | |
| Gene Alias | AHA1 | |
| Cytomap | 14q24.3 | |
| Gene Type | protein-coding | GO ID | GO:0006457 | UniProtAcc | G3V438 |
Top |
Malignant transformation analysis |
| Identification of the aberrant gene expression in precancerous and cancerous lesions by comparing the gene expression of stem-like cells in diseased tissues with normal stem cells |
| Entrez ID | Symbol | Replicates | Species | Organ | Tissue | Adj P-value | Log2FC | Malignancy |
| 10598 | AHSA1 | HTA11_3410_2000001011 | Human | Colorectum | AD | 2.23e-05 | 2.01e-01 | 0.0155 |
| 10598 | AHSA1 | HTA11_2487_2000001011 | Human | Colorectum | SER | 4.35e-06 | 3.71e-01 | -0.1808 |
| 10598 | AHSA1 | HTA11_1938_2000001011 | Human | Colorectum | AD | 3.40e-14 | 6.48e-01 | -0.0811 |
| 10598 | AHSA1 | HTA11_78_2000001011 | Human | Colorectum | AD | 2.61e-04 | 3.45e-01 | -0.1088 |
| 10598 | AHSA1 | HTA11_347_2000001011 | Human | Colorectum | AD | 5.83e-11 | 4.02e-01 | -0.1954 |
| 10598 | AHSA1 | HTA11_411_2000001011 | Human | Colorectum | SER | 1.63e-02 | 5.39e-01 | -0.2602 |
| 10598 | AHSA1 | HTA11_3361_2000001011 | Human | Colorectum | AD | 1.19e-05 | 4.46e-01 | -0.1207 |
| 10598 | AHSA1 | HTA11_83_2000001011 | Human | Colorectum | SER | 1.97e-06 | 4.94e-01 | -0.1526 |
| 10598 | AHSA1 | HTA11_696_2000001011 | Human | Colorectum | AD | 8.44e-19 | 5.36e-01 | -0.1464 |
| 10598 | AHSA1 | HTA11_866_2000001011 | Human | Colorectum | AD | 1.93e-13 | 4.61e-01 | -0.1001 |
| 10598 | AHSA1 | HTA11_1391_2000001011 | Human | Colorectum | AD | 3.37e-18 | 7.73e-01 | -0.059 |
| 10598 | AHSA1 | HTA11_2992_2000001011 | Human | Colorectum | SER | 1.09e-04 | 5.50e-01 | -0.1706 |
| 10598 | AHSA1 | HTA11_546_2000001011 | Human | Colorectum | AD | 5.35e-05 | 4.14e-01 | -0.0842 |
| 10598 | AHSA1 | HTA11_7862_2000001011 | Human | Colorectum | AD | 4.03e-05 | 4.06e-01 | -0.0179 |
| 10598 | AHSA1 | HTA11_866_3004761011 | Human | Colorectum | AD | 3.59e-20 | 6.57e-01 | 0.096 |
| 10598 | AHSA1 | HTA11_4255_2000001011 | Human | Colorectum | SER | 9.11e-04 | 5.39e-01 | 0.0446 |
| 10598 | AHSA1 | HTA11_8622_2000001021 | Human | Colorectum | SER | 4.98e-04 | 5.34e-01 | 0.0528 |
| 10598 | AHSA1 | HTA11_7663_2000001011 | Human | Colorectum | SER | 6.31e-04 | 4.94e-01 | 0.0131 |
| 10598 | AHSA1 | HTA11_10711_2000001011 | Human | Colorectum | AD | 1.34e-05 | 4.16e-01 | 0.0338 |
| 10598 | AHSA1 | HTA11_7696_3000711011 | Human | Colorectum | AD | 8.89e-25 | 6.97e-01 | 0.0674 |
| Page: 1 2 3 4 5 6 7 8 9 |
| Tissue | Expression Dynamics | Abbreviation |
| Colorectum (GSE201348) |  | FAP: Familial adenomatous polyposis |
| CRC: Colorectal cancer | ||
| Colorectum (HTA11) |  | AD: Adenomas |
| SER: Sessile serrated lesions | ||
| MSI-H: Microsatellite-high colorectal cancer | ||
| MSS: Microsatellite stable colorectal cancer | ||
| Esophagus |  | ESCC: Esophageal squamous cell carcinoma |
| HGIN: High-grade intraepithelial neoplasias | ||
| LGIN: Low-grade intraepithelial neoplasias | ||
| Liver | 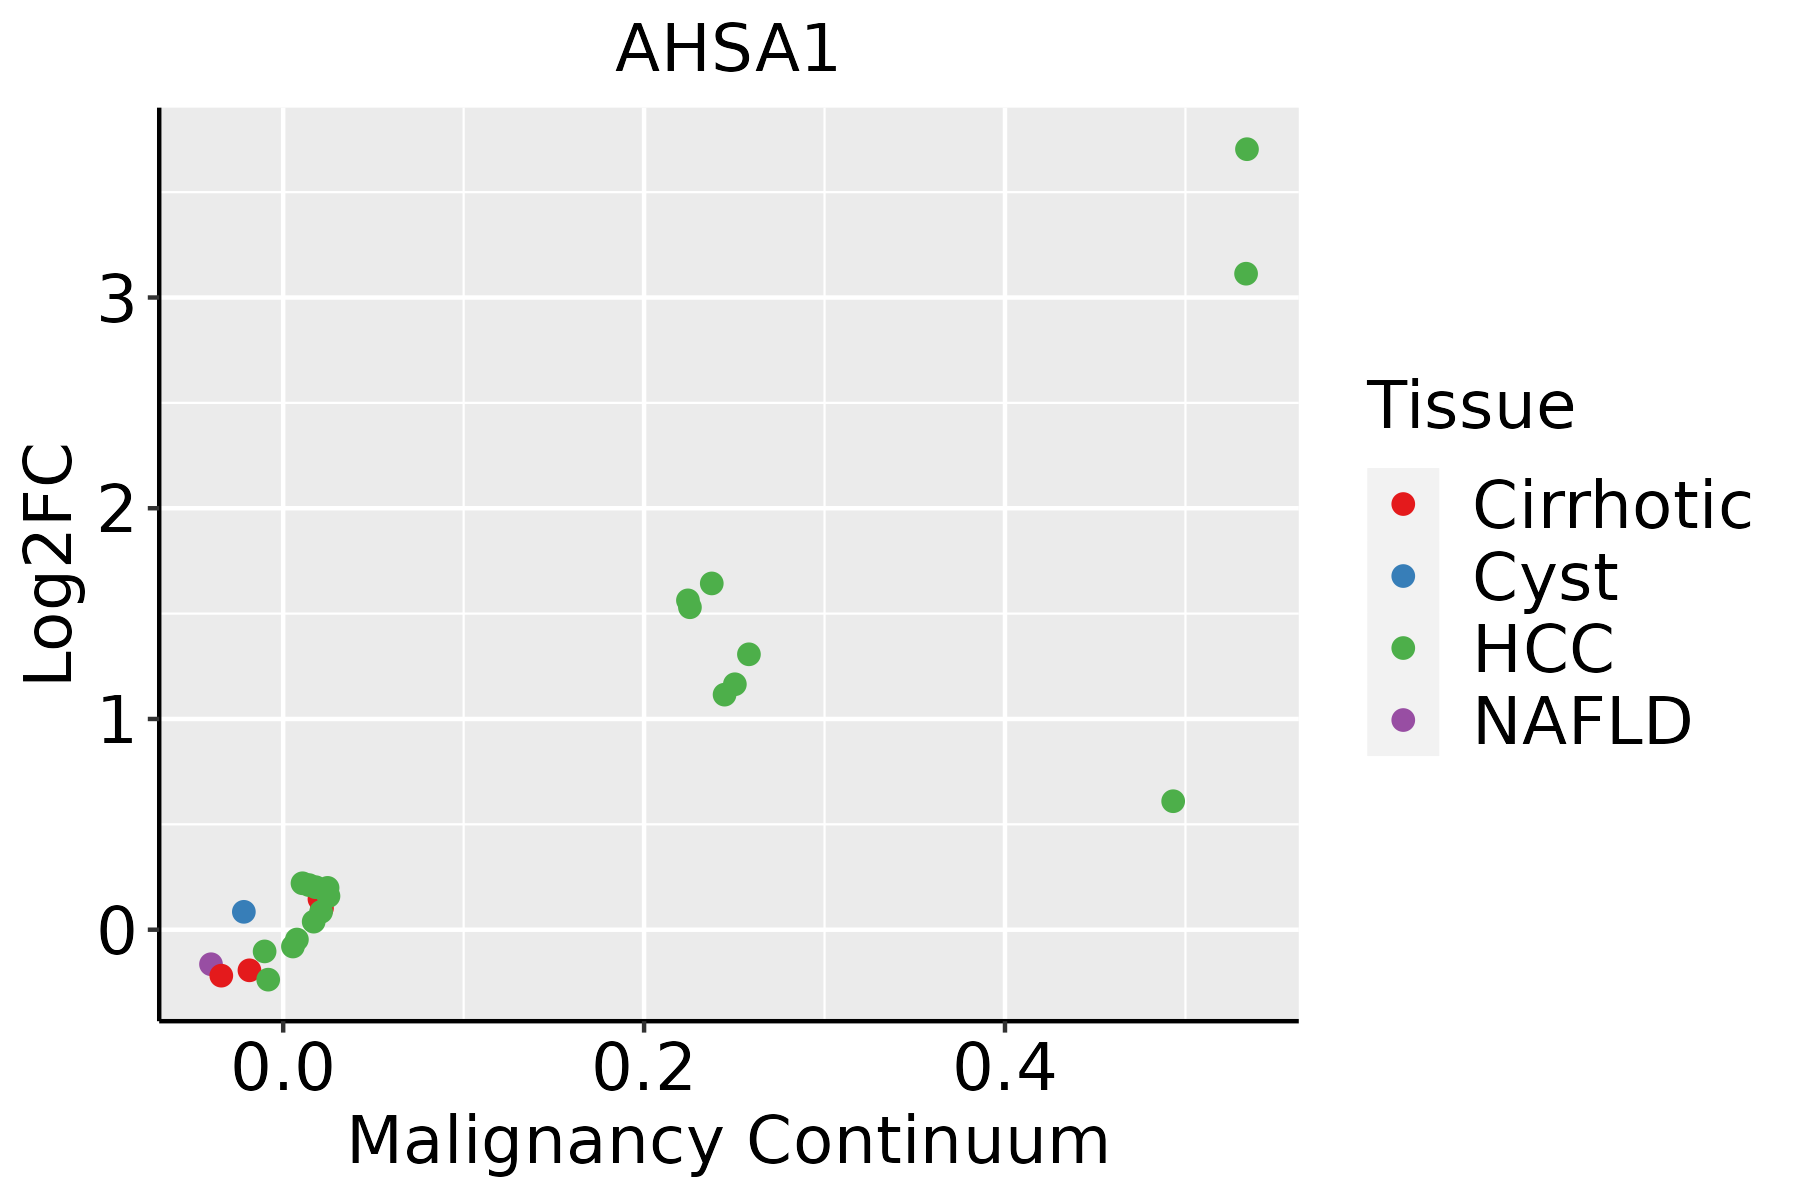 | HCC: Hepatocellular carcinoma |
| NAFLD: Non-alcoholic fatty liver disease | ||
| Oral Cavity | 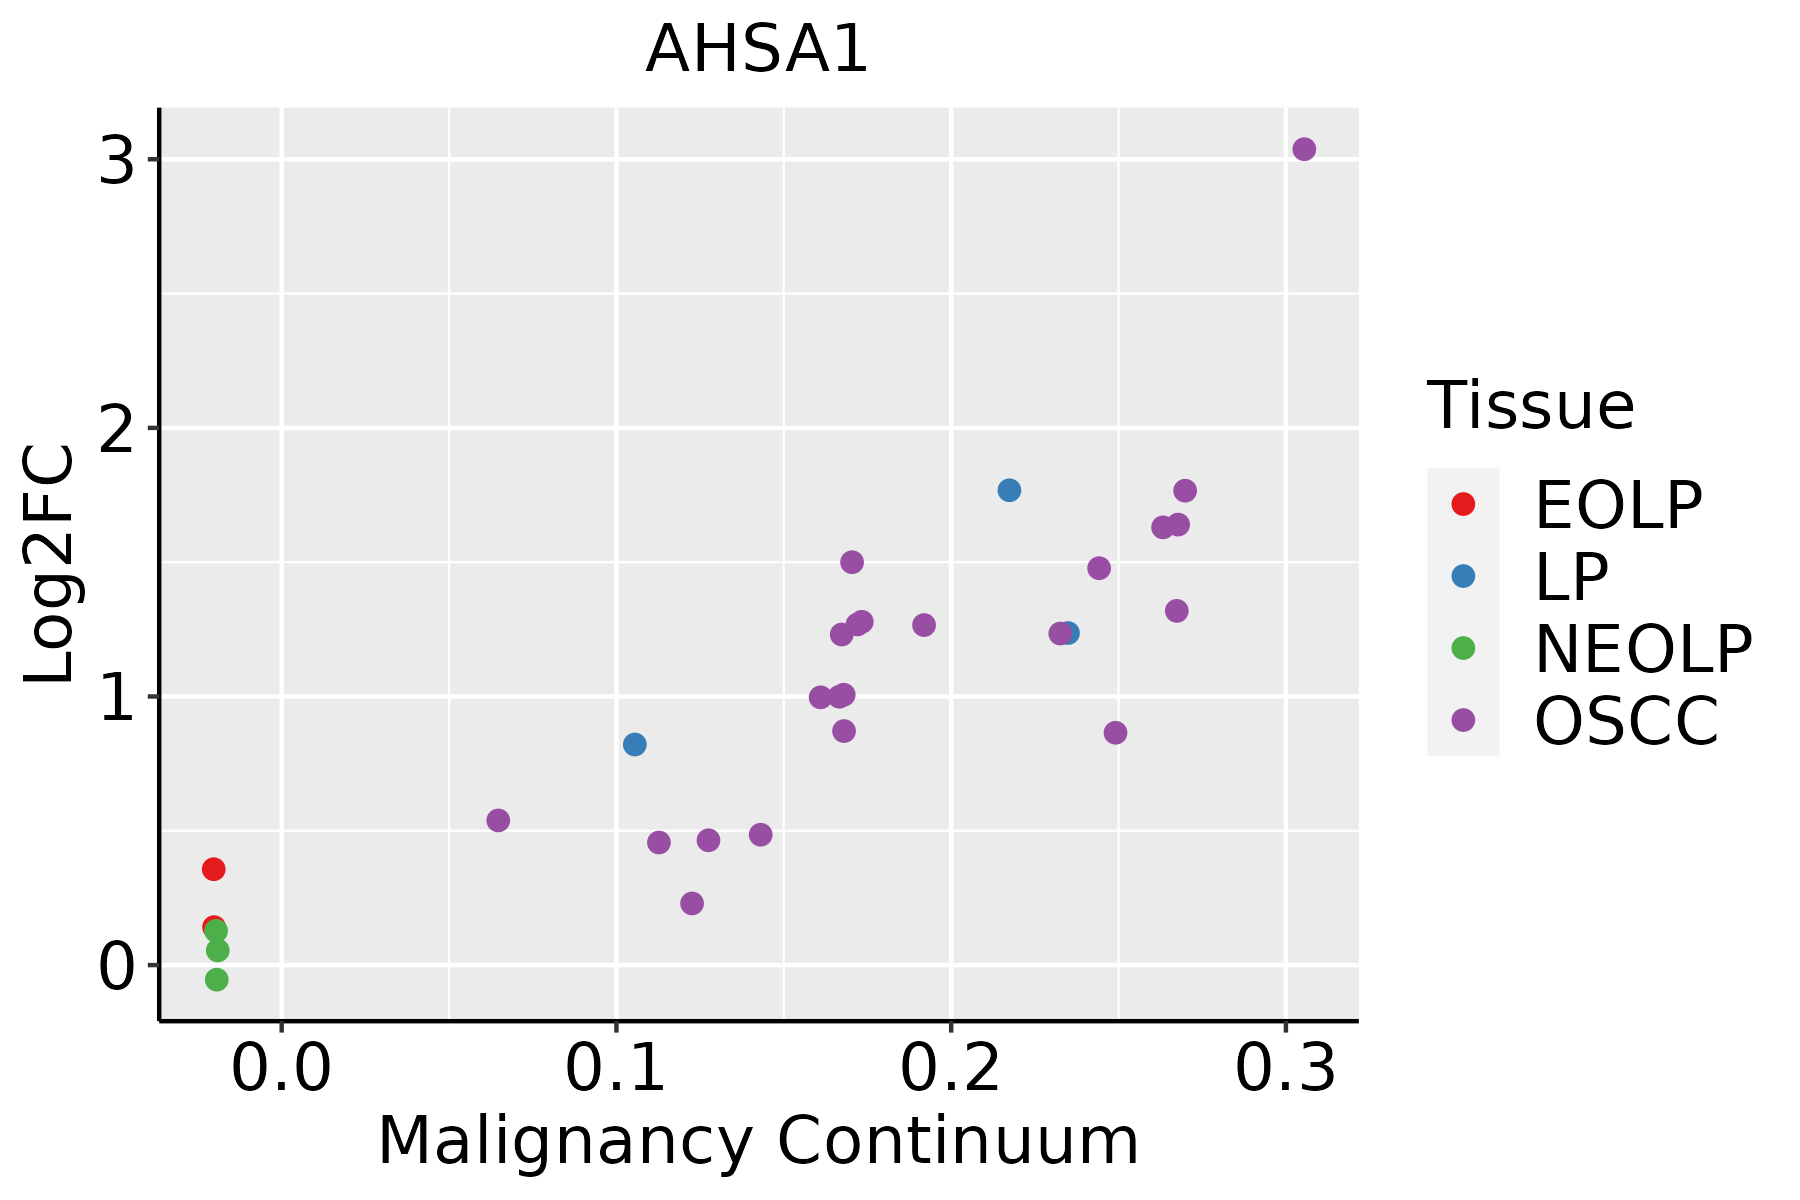 | EOLP: Erosive Oral lichen planus |
| LP: leukoplakia | ||
| NEOLP: Non-erosive oral lichen planus | ||
| OSCC: Oral squamous cell carcinoma | ||
| Prostate | 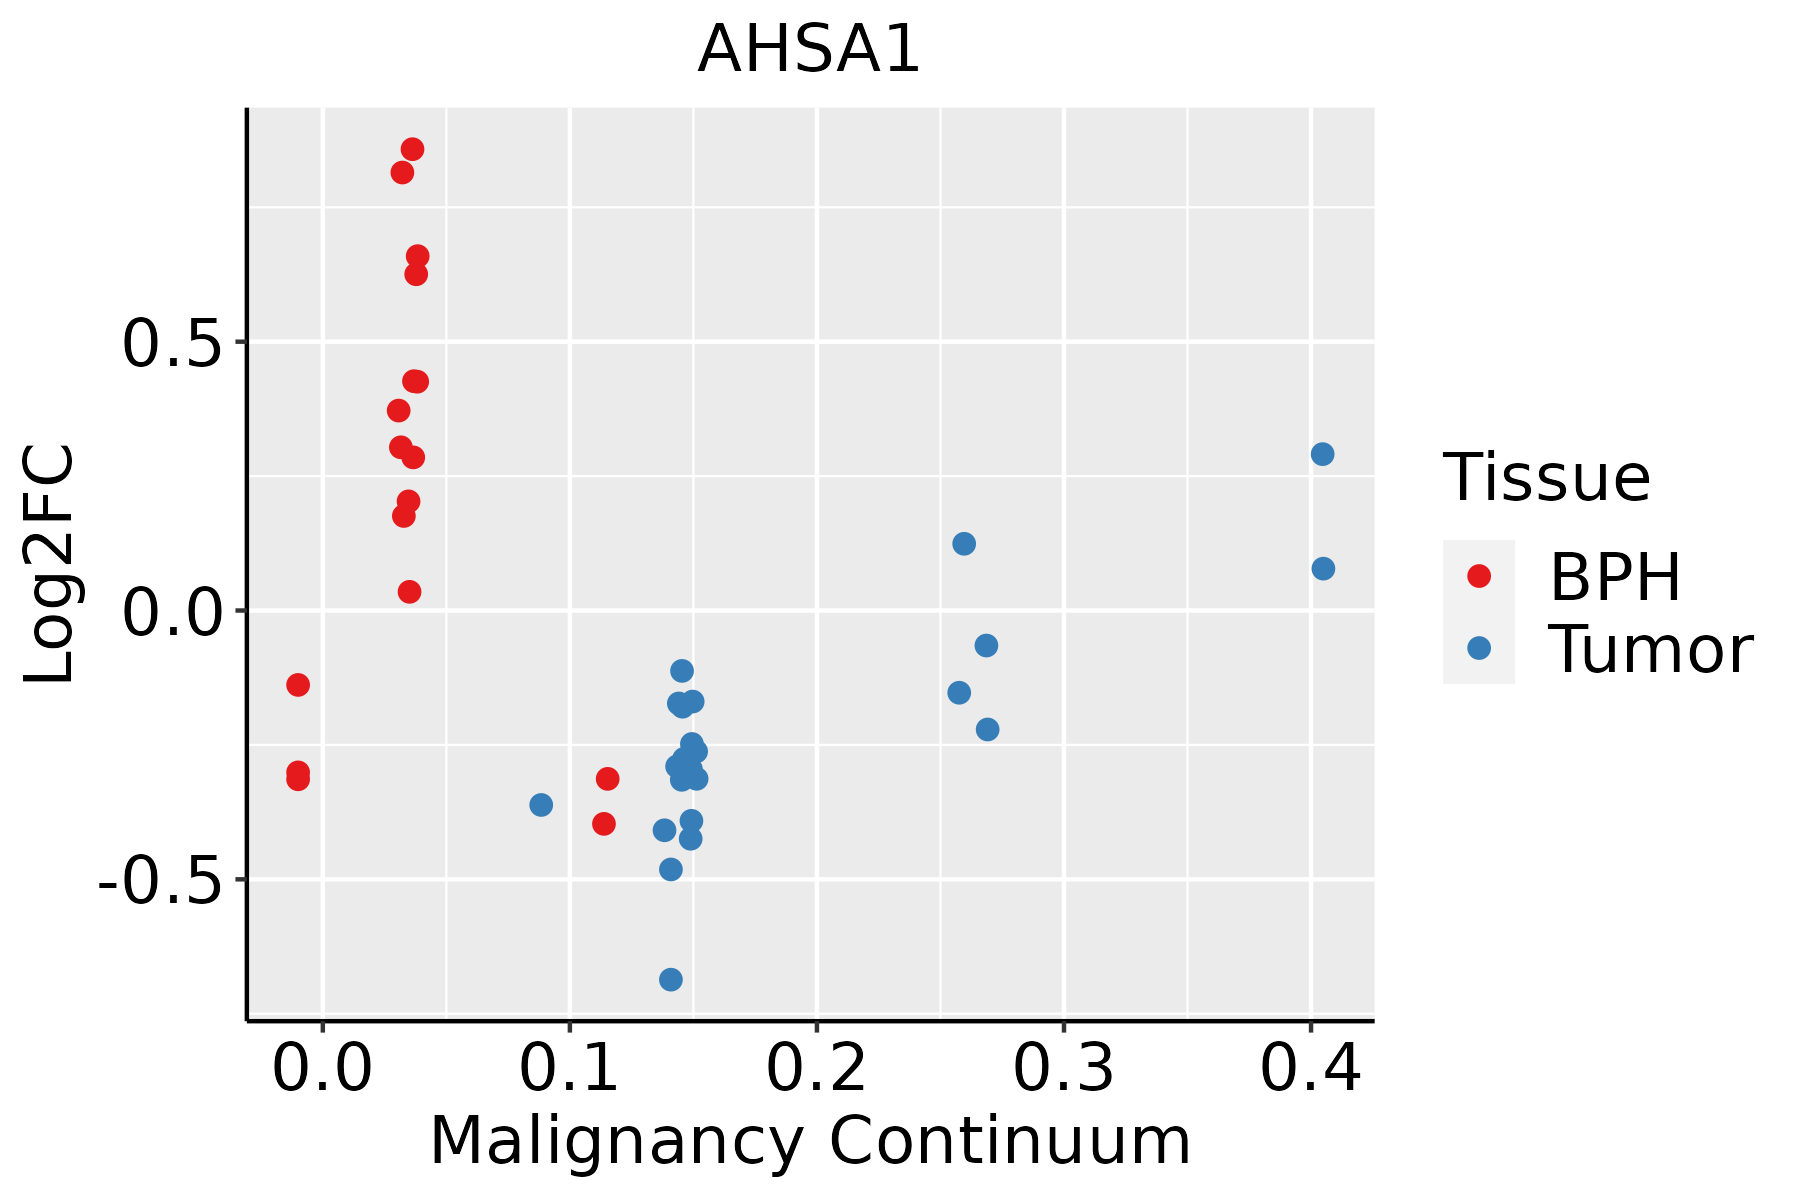 | BPH: Benign Prostatic Hyperplasia |
| Skin |  | AK: Actinic keratosis |
| cSCC: Cutaneous squamous cell carcinoma | ||
| SCCIS:squamous cell carcinoma in situ | ||
| Thyroid |  | ATC: Anaplastic thyroid cancer |
| HT: Hashimoto's thyroiditis | ||
| PTC: Papillary thyroid cancer |
| ∗log2FC in expression of this searched gene in stem-like cells from each diseased tissue sample relative to stem-like cells in normal samples in each tissue plotted against the malignancy continuum. Samples are colored based on if they are from different disease stage. |
Top |
Malignant transformation related pathway analysis |
| Find out the enriched GO biological processes and KEGG pathways involved in transition from healthy to precancer to cancer |
| Tissue | Disease Stage | Enriched GO biological Processes |
| Colorectum | AD |  |
| Colorectum | SER |  |
| Colorectum | MSS |  |
| Colorectum | MSI-H |  |
| Colorectum | FAP |  |
| ∗Top 15 enriched GO BP terms are showed in the bar plot of each disease state in each tissue. Each row represents a significant GO biological process which is colored according to the -log10(p.adjust). |
| Page: 1 2 3 4 5 6 7 8 9 |
| GO ID | Tissue | Disease Stage | Description | Gene Ratio | Bg Ratio | pvalue | p.adjust | Count |
| GO:0006457 | Colorectum | AD | protein folding | 73/3918 | 212/18723 | 3.24e-06 | 9.10e-05 | 73 |
| GO:00064571 | Colorectum | SER | protein folding | 54/2897 | 212/18723 | 1.04e-04 | 2.18e-03 | 54 |
| GO:00064572 | Colorectum | MSS | protein folding | 71/3467 | 212/18723 | 1.25e-07 | 5.91e-06 | 71 |
| GO:00064573 | Colorectum | MSI-H | protein folding | 33/1319 | 212/18723 | 1.40e-05 | 6.29e-04 | 33 |
| GO:00064574 | Colorectum | FAP | protein folding | 44/2622 | 212/18723 | 4.36e-03 | 2.98e-02 | 44 |
| GO:000645720 | Esophagus | HGIN | protein folding | 75/2587 | 212/18723 | 1.61e-15 | 3.86e-13 | 75 |
| GO:0006457110 | Esophagus | ESCC | protein folding | 163/8552 | 212/18723 | 1.13e-20 | 1.74e-18 | 163 |
| GO:00434627 | Esophagus | ESCC | regulation of ATPase activity | 30/8552 | 46/18723 | 5.91e-03 | 2.18e-02 | 30 |
| GO:00064577 | Liver | Cirrhotic | protein folding | 114/4634 | 212/18723 | 9.23e-20 | 2.31e-17 | 114 |
| GO:00327812 | Liver | Cirrhotic | positive regulation of ATPase activity | 16/4634 | 27/18723 | 1.41e-04 | 1.36e-03 | 16 |
| GO:00434623 | Liver | Cirrhotic | regulation of ATPase activity | 21/4634 | 46/18723 | 1.61e-03 | 1.04e-02 | 21 |
| GO:000645712 | Liver | HCC | protein folding | 160/7958 | 212/18723 | 1.07e-22 | 1.88e-20 | 160 |
| GO:00327811 | Liver | HCC | positive regulation of ATPase activity | 19/7958 | 27/18723 | 3.18e-03 | 1.47e-02 | 19 |
| GO:004346211 | Liver | HCC | regulation of ATPase activity | 29/7958 | 46/18723 | 3.95e-03 | 1.74e-02 | 29 |
| GO:000645718 | Oral cavity | OSCC | protein folding | 154/7305 | 212/18723 | 1.89e-23 | 4.60e-21 | 154 |
| GO:00327815 | Oral cavity | OSCC | positive regulation of ATPase activity | 18/7305 | 27/18723 | 3.34e-03 | 1.42e-02 | 18 |
| GO:00434626 | Oral cavity | OSCC | regulation of ATPase activity | 27/7305 | 46/18723 | 5.33e-03 | 2.07e-02 | 27 |
| GO:000645719 | Oral cavity | LP | protein folding | 125/4623 | 212/18723 | 1.62e-26 | 8.45e-24 | 125 |
| GO:003278113 | Oral cavity | LP | positive regulation of ATPase activity | 13/4623 | 27/18723 | 6.92e-03 | 3.96e-02 | 13 |
| GO:000645725 | Oral cavity | EOLP | protein folding | 59/2218 | 212/18723 | 1.76e-10 | 1.79e-08 | 59 |
| Page: 1 2 |
| Pathway ID | Tissue | Disease Stage | Description | Gene Ratio | Bg Ratio | pvalue | p.adjust | qvalue | Count |
| Page: 1 |
Top |
Cell-cell communication analysis |
| Identification of potential cell-cell interactions between two cell types and their ligand-receptor pairs for different disease states |
| Ligand | Receptor | LRpair | Pathway | Tissue | Disease Stage |
| Page: 1 |
Top |
Single-cell gene regulatory network inference analysis |
| Find out the significant the regulons (TFs) and the target genes of each regulon across cell types for different disease states |
| TF | Cell Type | Tissue | Disease Stage | Target Gene | RSS | Regulon Activity |
| ∗The dot plots of a searched regulon are shown for all cell subpopulations in each disease state of each tissue based on the regulon specific score inferred using pySCENIC and by calculating the average expression. |
| Page: 1 |
Top |
Somatic mutation of malignant transformation related genes |
| Annotation of somatic variants for genes involved in malignant transformation |
| Hugo Symbol | Variant Class | Variant Classification | dbSNP RS | HGVSc | HGVSp | HGVSp Short | SWISSPROT | BIOTYPE | SIFT | PolyPhen | Tumor Sample Barcode | Tissue | Histology | Sex | Age | Stage | Therapy Types | Drugs | Outcome |
| AHSA1 | SNV | Missense_Mutation | rs141659647 | c.1003N>A | p.Ala335Thr | p.A335T | O95433 | protein_coding | deleterious(0.02) | probably_damaging(0.988) | TCGA-EJ-7782-01 | Prostate | prostate adenocarcinoma | Male | >=65 | 8 | Unknown | Unknown | SD |
| AHSA1 | SNV | Missense_Mutation | c.682N>G | p.Thr228Ala | p.T228A | O95433 | protein_coding | tolerated(0.74) | benign(0.047) | TCGA-BR-4361-01 | Stomach | stomach adenocarcinoma | Female | >=65 | III/IV | Unknown | Unknown | SD | |
| AHSA1 | SNV | Missense_Mutation | rs147994825 | c.1006N>T | p.Arg336Cys | p.R336C | O95433 | protein_coding | deleterious(0.05) | benign(0.038) | TCGA-BR-7851-01 | Stomach | stomach adenocarcinoma | Male | >=65 | I/II | Unknown | Unknown | SD |
| AHSA1 | SNV | Missense_Mutation | c.388N>G | p.Thr130Ala | p.T130A | O95433 | protein_coding | tolerated(0.22) | probably_damaging(0.998) | TCGA-CD-A4MG-01 | Stomach | stomach adenocarcinoma | Male | >=65 | I/II | Unknown | Unknown | PD | |
| AHSA1 | SNV | Missense_Mutation | c.944N>T | p.Thr315Met | p.T315M | O95433 | protein_coding | tolerated(0.4) | possibly_damaging(0.678) | TCGA-CG-4465-01 | Stomach | stomach adenocarcinoma | Female | >=65 | III/IV | Chemotherapy | cisplatin | SD | |
| AHSA1 | SNV | Missense_Mutation | novel | c.478N>G | p.Thr160Ala | p.T160A | O95433 | protein_coding | deleterious(0.03) | benign(0.172) | TCGA-VQ-A924-01 | Stomach | stomach adenocarcinoma | Male | >=65 | I/II | Unknown | Unknown | PD |
| AHSA1 | deletion | Frame_Shift_Del | novel | c.1012delN | p.Ter339ArgfsTer19 | p.*339Rfs*19 | O95433 | protein_coding | TCGA-BR-A4QL-01 | Stomach | stomach adenocarcinoma | Female | >=65 | III/IV | Chemotherapy | xeloda | CR | ||
| AHSA1 | insertion | Frame_Shift_Ins | novel | c.173_174insTAAAG | p.Thr59LysfsTer5 | p.T59Kfs*5 | O95433 | protein_coding | TCGA-EL-A3ZM-01 | Thyroid | thyroid carcinoma | Male | <65 | I/II | Unknown | Unknown | SD | ||
| AHSA1 | insertion | Frame_Shift_Ins | novel | c.175_176insGG | p.Thr59ArgfsTer4 | p.T59Rfs*4 | O95433 | protein_coding | TCGA-EL-A3ZM-01 | Thyroid | thyroid carcinoma | Male | <65 | I/II | Unknown | Unknown | SD |
| Page: 1 2 3 4 |
Top |
Related drugs of malignant transformation related genes |
| Identification of chemicals and drugs interact with genes involved in malignant transfromation |
| (DGIdb 4.0) |
| Entrez ID | Symbol | Category | Interaction Types | Drug Claim Name | Drug Name | PMIDs |
| Page: 1 |

Copyright 2023-Present -The University of Texas Health Science Center at Houston |