
|
|||||
|
 | |
| |
| |
| |
| |
| |
|
Gene: TMEM5 |
Gene summary for TMEM5 |
| Gene information | Species | Human | Gene symbol | TMEM5 | Gene ID | 10329 |
| Gene name | ribitol xylosyltransferase 1 | |
| Gene Alias | HP10481 | |
| Cytomap | 12q14.2 | |
| Gene Type | protein-coding | GO ID | GO:0006464 | UniProtAcc | G3V1K2 |
Top |
Malignant transformation analysis |
| Identification of the aberrant gene expression in precancerous and cancerous lesions by comparing the gene expression of stem-like cells in diseased tissues with normal stem cells |
| Entrez ID | Symbol | Replicates | Species | Organ | Tissue | Adj P-value | Log2FC | Malignancy |
| 10329 | TMEM5 | P1T-E | Human | Esophagus | ESCC | 6.83e-08 | 4.35e-01 | 0.0875 |
| 10329 | TMEM5 | P2T-E | Human | Esophagus | ESCC | 1.54e-56 | 1.00e+00 | 0.1177 |
| 10329 | TMEM5 | P4T-E | Human | Esophagus | ESCC | 1.16e-16 | 4.26e-01 | 0.1323 |
| 10329 | TMEM5 | P5T-E | Human | Esophagus | ESCC | 2.59e-11 | 2.34e-01 | 0.1327 |
| 10329 | TMEM5 | P8T-E | Human | Esophagus | ESCC | 8.13e-22 | 4.88e-01 | 0.0889 |
| 10329 | TMEM5 | P9T-E | Human | Esophagus | ESCC | 5.17e-15 | 2.90e-01 | 0.1131 |
| 10329 | TMEM5 | P10T-E | Human | Esophagus | ESCC | 1.70e-32 | 5.60e-01 | 0.116 |
| 10329 | TMEM5 | P11T-E | Human | Esophagus | ESCC | 2.67e-12 | 3.16e-01 | 0.1426 |
| 10329 | TMEM5 | P12T-E | Human | Esophagus | ESCC | 1.35e-10 | 2.77e-01 | 0.1122 |
| 10329 | TMEM5 | P15T-E | Human | Esophagus | ESCC | 8.76e-18 | 3.60e-01 | 0.1149 |
| 10329 | TMEM5 | P16T-E | Human | Esophagus | ESCC | 2.57e-27 | 5.21e-01 | 0.1153 |
| 10329 | TMEM5 | P19T-E | Human | Esophagus | ESCC | 5.11e-06 | 4.58e-01 | 0.1662 |
| 10329 | TMEM5 | P20T-E | Human | Esophagus | ESCC | 9.38e-21 | 4.92e-01 | 0.1124 |
| 10329 | TMEM5 | P21T-E | Human | Esophagus | ESCC | 2.45e-25 | 4.03e-01 | 0.1617 |
| 10329 | TMEM5 | P22T-E | Human | Esophagus | ESCC | 6.88e-35 | 5.14e-01 | 0.1236 |
| 10329 | TMEM5 | P23T-E | Human | Esophagus | ESCC | 6.57e-24 | 6.02e-01 | 0.108 |
| 10329 | TMEM5 | P24T-E | Human | Esophagus | ESCC | 1.05e-15 | 2.40e-01 | 0.1287 |
| 10329 | TMEM5 | P26T-E | Human | Esophagus | ESCC | 3.17e-23 | 4.70e-01 | 0.1276 |
| 10329 | TMEM5 | P27T-E | Human | Esophagus | ESCC | 6.41e-13 | 3.45e-01 | 0.1055 |
| 10329 | TMEM5 | P28T-E | Human | Esophagus | ESCC | 2.93e-17 | 3.83e-01 | 0.1149 |
| Page: 1 2 3 4 |
| Tissue | Expression Dynamics | Abbreviation |
| Esophagus | 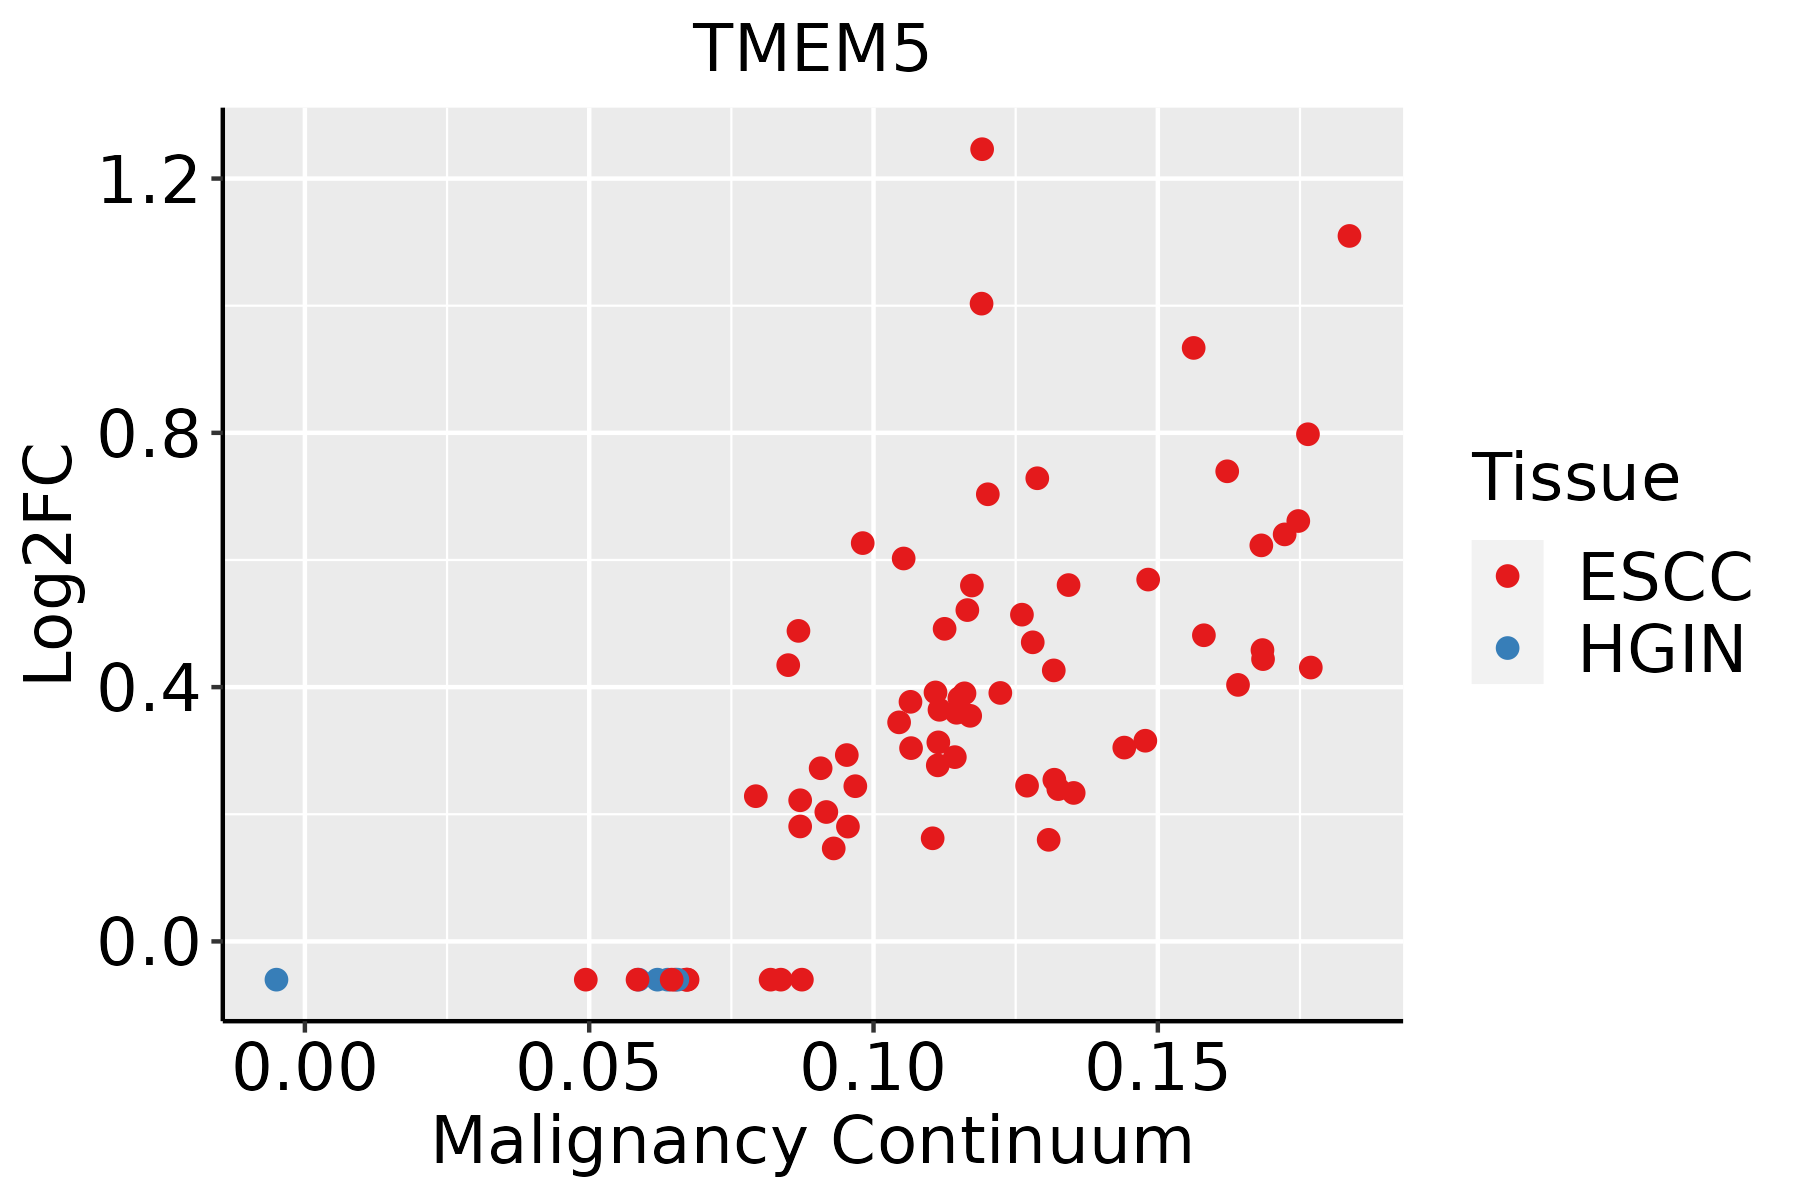 | ESCC: Esophageal squamous cell carcinoma |
| HGIN: High-grade intraepithelial neoplasias | ||
| LGIN: Low-grade intraepithelial neoplasias | ||
| Oral Cavity |  | EOLP: Erosive Oral lichen planus |
| LP: leukoplakia | ||
| NEOLP: Non-erosive oral lichen planus | ||
| OSCC: Oral squamous cell carcinoma | ||
| Skin | 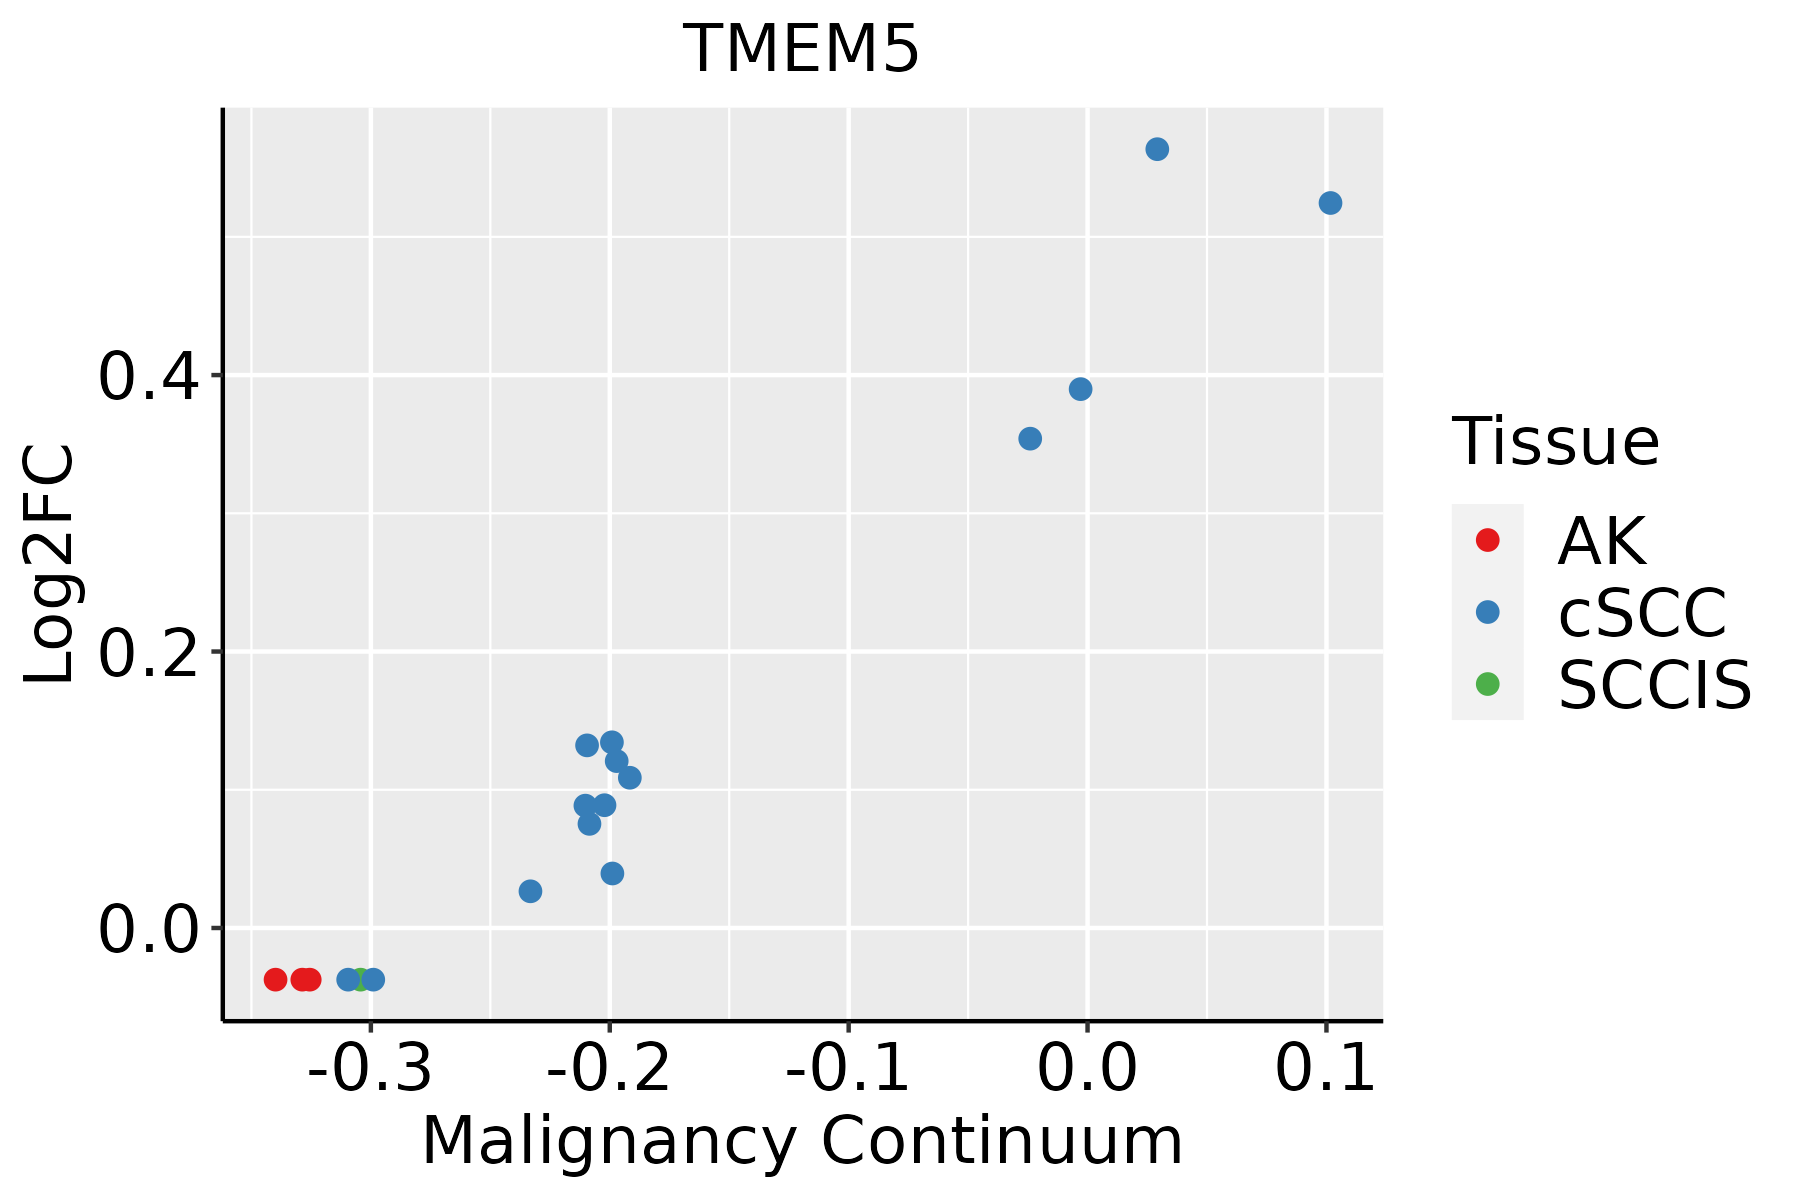 | AK: Actinic keratosis |
| cSCC: Cutaneous squamous cell carcinoma | ||
| SCCIS:squamous cell carcinoma in situ |
| ∗log2FC in expression of this searched gene in stem-like cells from each diseased tissue sample relative to stem-like cells in normal samples in each tissue plotted against the malignancy continuum. Samples are colored based on if they are from different disease stage. |
Top |
Malignant transformation related pathway analysis |
| Find out the enriched GO biological processes and KEGG pathways involved in transition from healthy to precancer to cancer |
| Tissue | Disease Stage | Enriched GO biological Processes |
| Colorectum | AD |  |
| Colorectum | SER |  |
| Colorectum | MSS |  |
| Colorectum | MSI-H |  |
| Colorectum | FAP |  |
| ∗Top 15 enriched GO BP terms are showed in the bar plot of each disease state in each tissue. Each row represents a significant GO biological process which is colored according to the -log10(p.adjust). |
| Page: 1 2 3 4 5 6 7 8 9 |
| GO ID | Tissue | Disease Stage | Description | Gene Ratio | Bg Ratio | pvalue | p.adjust | Count |
| GO:00458619 | Breast | Precancer | negative regulation of proteolysis | 50/1080 | 351/18723 | 2.99e-09 | 2.39e-07 | 50 |
| GO:00098969 | Breast | Precancer | positive regulation of catabolic process | 48/1080 | 492/18723 | 2.62e-04 | 3.84e-03 | 48 |
| GO:00313319 | Breast | Precancer | positive regulation of cellular catabolic process | 43/1080 | 427/18723 | 2.75e-04 | 4.00e-03 | 43 |
| GO:19043757 | Breast | Precancer | regulation of protein localization to cell periphery | 15/1080 | 125/18723 | 5.58e-03 | 4.07e-02 | 15 |
| GO:19054757 | Breast | Precancer | regulation of protein localization to membrane | 19/1080 | 175/18723 | 5.98e-03 | 4.22e-02 | 19 |
| GO:00516047 | Breast | Precancer | protein maturation | 28/1080 | 294/18723 | 6.45e-03 | 4.50e-02 | 28 |
| GO:19030767 | Breast | Precancer | regulation of protein localization to plasma membrane | 13/1080 | 104/18723 | 6.79e-03 | 4.65e-02 | 13 |
| GO:004586114 | Breast | IDC | negative regulation of proteolysis | 70/1434 | 351/18723 | 8.21e-14 | 2.22e-11 | 70 |
| GO:000989614 | Breast | IDC | positive regulation of catabolic process | 62/1434 | 492/18723 | 7.06e-05 | 1.42e-03 | 62 |
| GO:190547513 | Breast | IDC | regulation of protein localization to membrane | 28/1434 | 175/18723 | 1.56e-04 | 2.71e-03 | 28 |
| GO:003133114 | Breast | IDC | positive regulation of cellular catabolic process | 54/1434 | 427/18723 | 1.85e-04 | 3.07e-03 | 54 |
| GO:190307613 | Breast | IDC | regulation of protein localization to plasma membrane | 17/1434 | 104/18723 | 2.28e-03 | 2.09e-02 | 17 |
| GO:190437513 | Breast | IDC | regulation of protein localization to cell periphery | 19/1434 | 125/18723 | 3.06e-03 | 2.60e-02 | 19 |
| GO:005160413 | Breast | IDC | protein maturation | 35/1434 | 294/18723 | 6.18e-03 | 4.40e-02 | 35 |
| GO:00726599 | Breast | IDC | protein localization to plasma membrane | 34/1434 | 284/18723 | 6.33e-03 | 4.47e-02 | 34 |
| GO:004586123 | Breast | DCIS | negative regulation of proteolysis | 63/1390 | 351/18723 | 4.39e-11 | 6.06e-09 | 63 |
| GO:000989624 | Breast | DCIS | positive regulation of catabolic process | 61/1390 | 492/18723 | 5.32e-05 | 1.09e-03 | 61 |
| GO:003133124 | Breast | DCIS | positive regulation of cellular catabolic process | 54/1390 | 427/18723 | 8.34e-05 | 1.58e-03 | 54 |
| GO:190547522 | Breast | DCIS | regulation of protein localization to membrane | 26/1390 | 175/18723 | 5.31e-04 | 6.88e-03 | 26 |
| GO:190307623 | Breast | DCIS | regulation of protein localization to plasma membrane | 16/1390 | 104/18723 | 4.13e-03 | 3.27e-02 | 16 |
| Page: 1 2 3 4 5 6 7 8 9 10 11 12 13 14 15 16 17 18 19 20 21 22 23 |
| Pathway ID | Tissue | Disease Stage | Description | Gene Ratio | Bg Ratio | pvalue | p.adjust | qvalue | Count |
| Page: 1 |
Top |
Cell-cell communication analysis |
| Identification of potential cell-cell interactions between two cell types and their ligand-receptor pairs for different disease states |
| Ligand | Receptor | LRpair | Pathway | Tissue | Disease Stage |
| Page: 1 |
Top |
Single-cell gene regulatory network inference analysis |
| Find out the significant the regulons (TFs) and the target genes of each regulon across cell types for different disease states |
| TF | Cell Type | Tissue | Disease Stage | Target Gene | RSS | Regulon Activity |
| ∗The dot plots of a searched regulon are shown for all cell subpopulations in each disease state of each tissue based on the regulon specific score inferred using pySCENIC and by calculating the average expression. |
| Page: 1 |
Top |
Somatic mutation of malignant transformation related genes |
| Annotation of somatic variants for genes involved in malignant transformation |
| Hugo Symbol | Variant Class | Variant Classification | dbSNP RS | HGVSc | HGVSp | HGVSp Short | SWISSPROT | BIOTYPE | SIFT | PolyPhen | Tumor Sample Barcode | Tissue | Histology | Sex | Age | Stage | Therapy Types | Drugs | Outcome |
| TMEM5 | SNV | Missense_Mutation | novel | c.303A>C | p.Gln101His | p.Q101H | Q9Y2B1 | protein_coding | deleterious(0) | probably_damaging(0.995) | TCGA-EY-A1GD-01 | Endometrium | uterine corpus endometrioid carcinoma | Female | <65 | I/II | Unknown | Unknown | SD |
| TMEM5 | insertion | Nonsense_Mutation | novel | c.849_850insGAGGAATAA | p.Gln283_Ala284insGluGluTer | p.Q283_A284insEE* | Q9Y2B1 | protein_coding | TCGA-BG-A0YU-01 | Endometrium | uterine corpus endometrioid carcinoma | Female | <65 | I/II | Unknown | Unknown | SD | ||
| TMEM5 | insertion | Nonsense_Mutation | novel | c.851_852insTTTAGTGATCTATCACACAGAATAGGGTG | p.Met286ValfsTer7 | p.M286Vfs*7 | Q9Y2B1 | protein_coding | TCGA-BG-A0YU-01 | Endometrium | uterine corpus endometrioid carcinoma | Female | <65 | I/II | Unknown | Unknown | SD | ||
| TMEM5 | SNV | Missense_Mutation | rs756576089 | c.709N>A | p.Val237Met | p.V237M | Q9Y2B1 | protein_coding | tolerated(0.11) | benign(0.006) | TCGA-DD-A4NA-01 | Liver | liver hepatocellular carcinoma | Female | >=65 | III/IV | Unknown | Unknown | SD |
| TMEM5 | SNV | Missense_Mutation | c.291T>A | p.Asp97Glu | p.D97E | Q9Y2B1 | protein_coding | tolerated(0.58) | benign(0.003) | TCGA-HP-A5N0-01 | Liver | liver hepatocellular carcinoma | Female | >=65 | I/II | Unknown | Unknown | PD | |
| TMEM5 | SNV | Missense_Mutation | c.14N>T | p.Arg5Leu | p.R5L | Q9Y2B1 | protein_coding | tolerated(0.62) | benign(0.393) | TCGA-55-8507-01 | Lung | lung adenocarcinoma | Male | <65 | I/II | Unknown | Unknown | SD | |
| TMEM5 | SNV | Missense_Mutation | c.938N>T | p.Glu313Val | p.E313V | Q9Y2B1 | protein_coding | deleterious(0.02) | benign(0.037) | TCGA-80-5611-01 | Lung | lung adenocarcinoma | Male | Unknown | I/II | Unknown | Unknown | SD | |
| TMEM5 | SNV | Missense_Mutation | c.541T>A | p.Leu181Ile | p.L181I | Q9Y2B1 | protein_coding | deleterious(0) | probably_damaging(0.996) | TCGA-97-7554-01 | Lung | lung adenocarcinoma | Female | >=65 | III/IV | Chemotherapy | alimta | SD | |
| TMEM5 | SNV | Missense_Mutation | novel | c.95N>C | p.Arg32Pro | p.R32P | Q9Y2B1 | protein_coding | tolerated(0.17) | benign(0.003) | TCGA-NJ-A4YQ-01 | Lung | lung adenocarcinoma | Female | >=65 | I/II | Unknown | Unknown | SD |
| TMEM5 | SNV | Missense_Mutation | c.867G>C | p.Leu289Phe | p.L289F | Q9Y2B1 | protein_coding | deleterious(0.03) | probably_damaging(0.976) | TCGA-18-3411-01 | Lung | lung squamous cell carcinoma | Female | <65 | III/IV | Unknown | Unknown | SD |
| Page: 1 2 3 4 5 |
Top |
Related drugs of malignant transformation related genes |
| Identification of chemicals and drugs interact with genes involved in malignant transfromation |
| (DGIdb 4.0) |
| Entrez ID | Symbol | Category | Interaction Types | Drug Claim Name | Drug Name | PMIDs |
| Page: 1 |

Copyright 2023-Present -The University of Texas Health Science Center at Houston |