
|
|||||
|
 | |
| |
| |
| |
| |
| |
|
Gene: TERF2IP |
Gene summary for TERF2IP |
| Gene information | Species | Human | Gene symbol | TERF2IP | Gene ID | 54386 |
| Gene name | TERF2 interacting protein | |
| Gene Alias | DRIP5 | |
| Cytomap | 16q23.1 | |
| Gene Type | protein-coding | GO ID | GO:0000018 | UniProtAcc | Q9NYB0 |
Top |
Malignant transformation analysis |
| Identification of the aberrant gene expression in precancerous and cancerous lesions by comparing the gene expression of stem-like cells in diseased tissues with normal stem cells |
| Entrez ID | Symbol | Replicates | Species | Organ | Tissue | Adj P-value | Log2FC | Malignancy |
| 54386 | TERF2IP | LZE4T | Human | Esophagus | ESCC | 1.98e-15 | 5.19e-01 | 0.0811 |
| 54386 | TERF2IP | LZE7T | Human | Esophagus | ESCC | 9.20e-10 | 2.83e-01 | 0.0667 |
| 54386 | TERF2IP | LZE8T | Human | Esophagus | ESCC | 7.07e-04 | -2.15e-01 | 0.067 |
| 54386 | TERF2IP | LZE20T | Human | Esophagus | ESCC | 2.61e-10 | 3.45e-01 | 0.0662 |
| 54386 | TERF2IP | LZE22D1 | Human | Esophagus | HGIN | 9.62e-04 | -2.74e-02 | 0.0595 |
| 54386 | TERF2IP | LZE22T | Human | Esophagus | ESCC | 3.18e-04 | 4.21e-01 | 0.068 |
| 54386 | TERF2IP | LZE24T | Human | Esophagus | ESCC | 2.51e-28 | 7.66e-01 | 0.0596 |
| 54386 | TERF2IP | LZE21T | Human | Esophagus | ESCC | 5.27e-07 | 5.02e-01 | 0.0655 |
| 54386 | TERF2IP | LZE6T | Human | Esophagus | ESCC | 6.18e-05 | -1.48e-01 | 0.0845 |
| 54386 | TERF2IP | P1T-E | Human | Esophagus | ESCC | 3.23e-28 | 1.22e+00 | 0.0875 |
| 54386 | TERF2IP | P2T-E | Human | Esophagus | ESCC | 3.72e-28 | 5.70e-01 | 0.1177 |
| 54386 | TERF2IP | P4T-E | Human | Esophagus | ESCC | 4.12e-44 | 8.92e-01 | 0.1323 |
| 54386 | TERF2IP | P5T-E | Human | Esophagus | ESCC | 6.80e-29 | 8.42e-01 | 0.1327 |
| 54386 | TERF2IP | P8T-E | Human | Esophagus | ESCC | 9.45e-40 | 8.77e-01 | 0.0889 |
| 54386 | TERF2IP | P9T-E | Human | Esophagus | ESCC | 3.46e-16 | 4.15e-01 | 0.1131 |
| 54386 | TERF2IP | P10T-E | Human | Esophagus | ESCC | 8.29e-34 | 5.77e-01 | 0.116 |
| 54386 | TERF2IP | P11T-E | Human | Esophagus | ESCC | 1.61e-24 | 9.58e-01 | 0.1426 |
| 54386 | TERF2IP | P12T-E | Human | Esophagus | ESCC | 3.63e-35 | 8.44e-01 | 0.1122 |
| 54386 | TERF2IP | P15T-E | Human | Esophagus | ESCC | 6.87e-39 | 8.27e-01 | 0.1149 |
| 54386 | TERF2IP | P16T-E | Human | Esophagus | ESCC | 2.05e-36 | 8.50e-01 | 0.1153 |
| Page: 1 2 3 4 5 6 7 |
| Tissue | Expression Dynamics | Abbreviation |
| Esophagus | 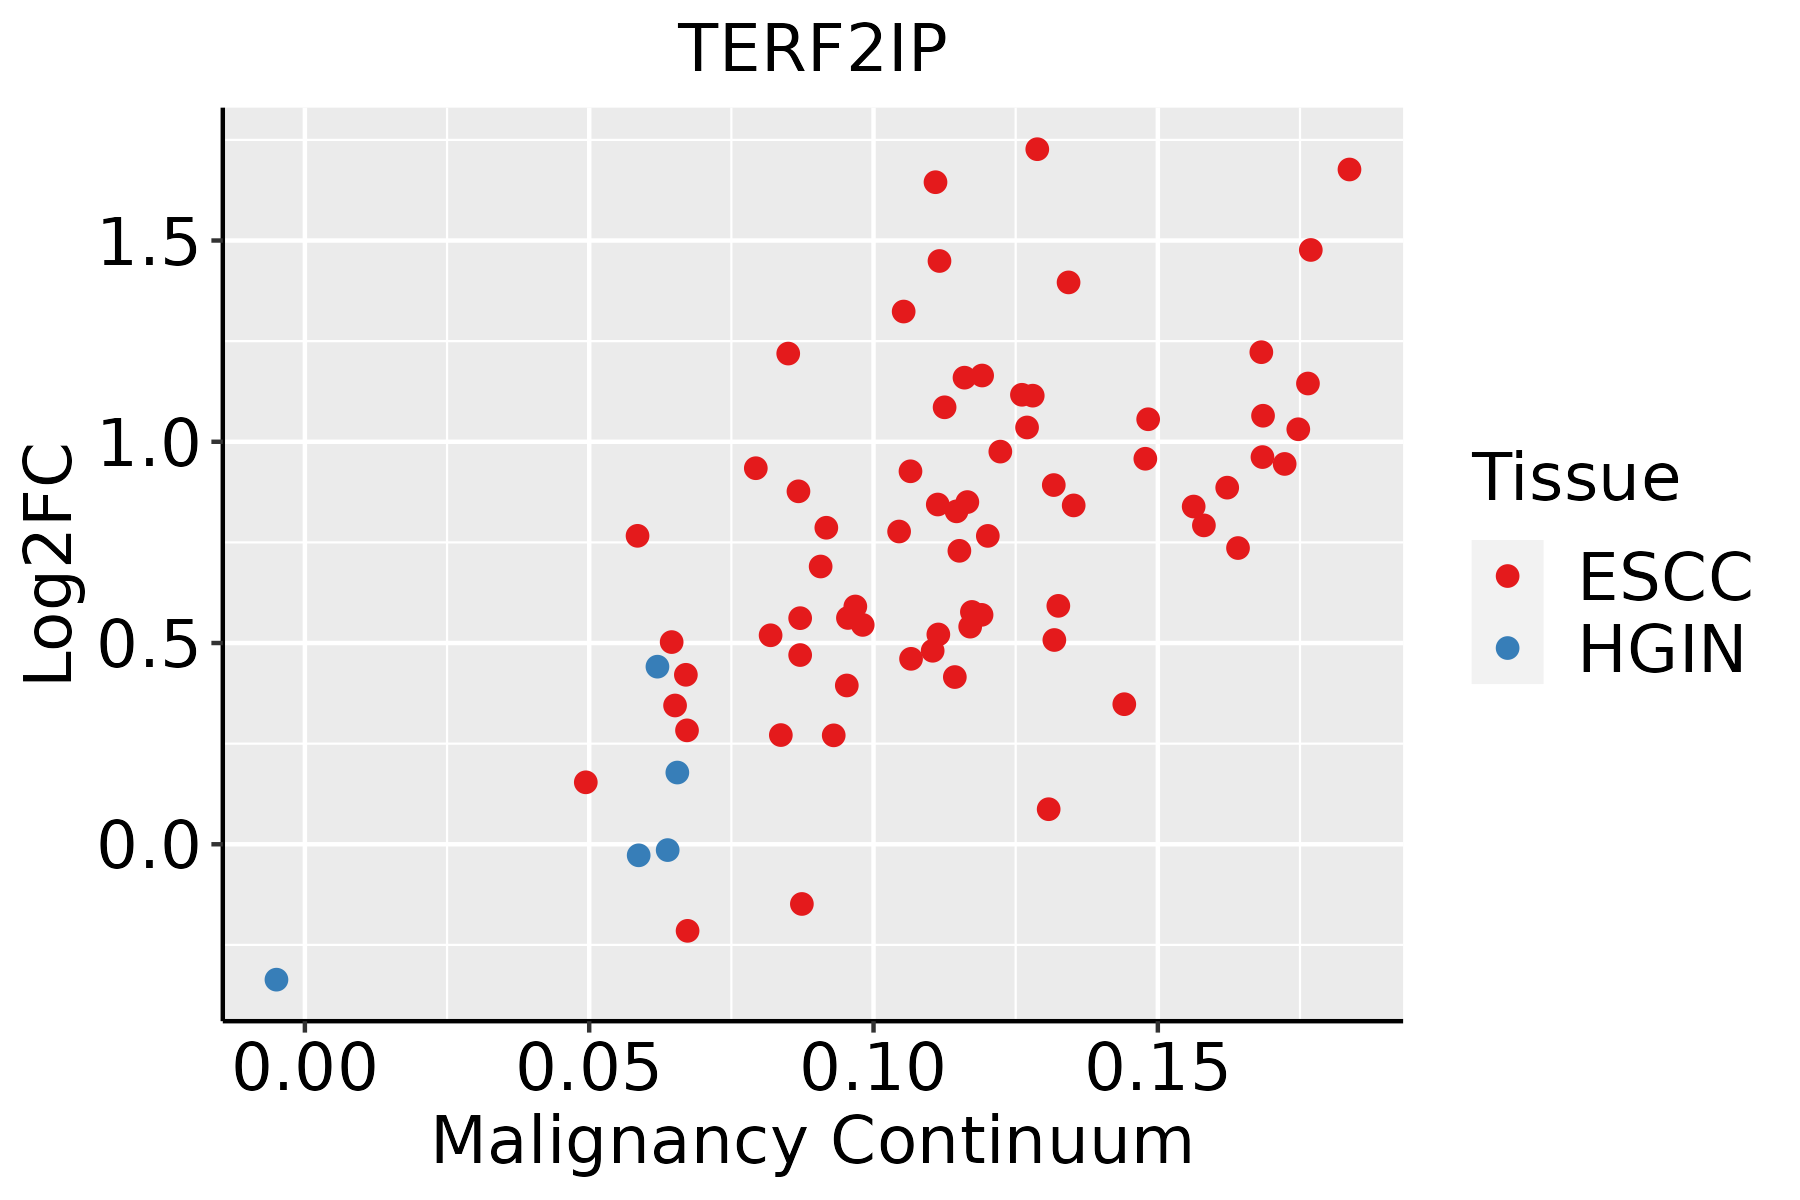 | ESCC: Esophageal squamous cell carcinoma |
| HGIN: High-grade intraepithelial neoplasias | ||
| LGIN: Low-grade intraepithelial neoplasias | ||
| Liver |  | HCC: Hepatocellular carcinoma |
| NAFLD: Non-alcoholic fatty liver disease | ||
| Oral Cavity | 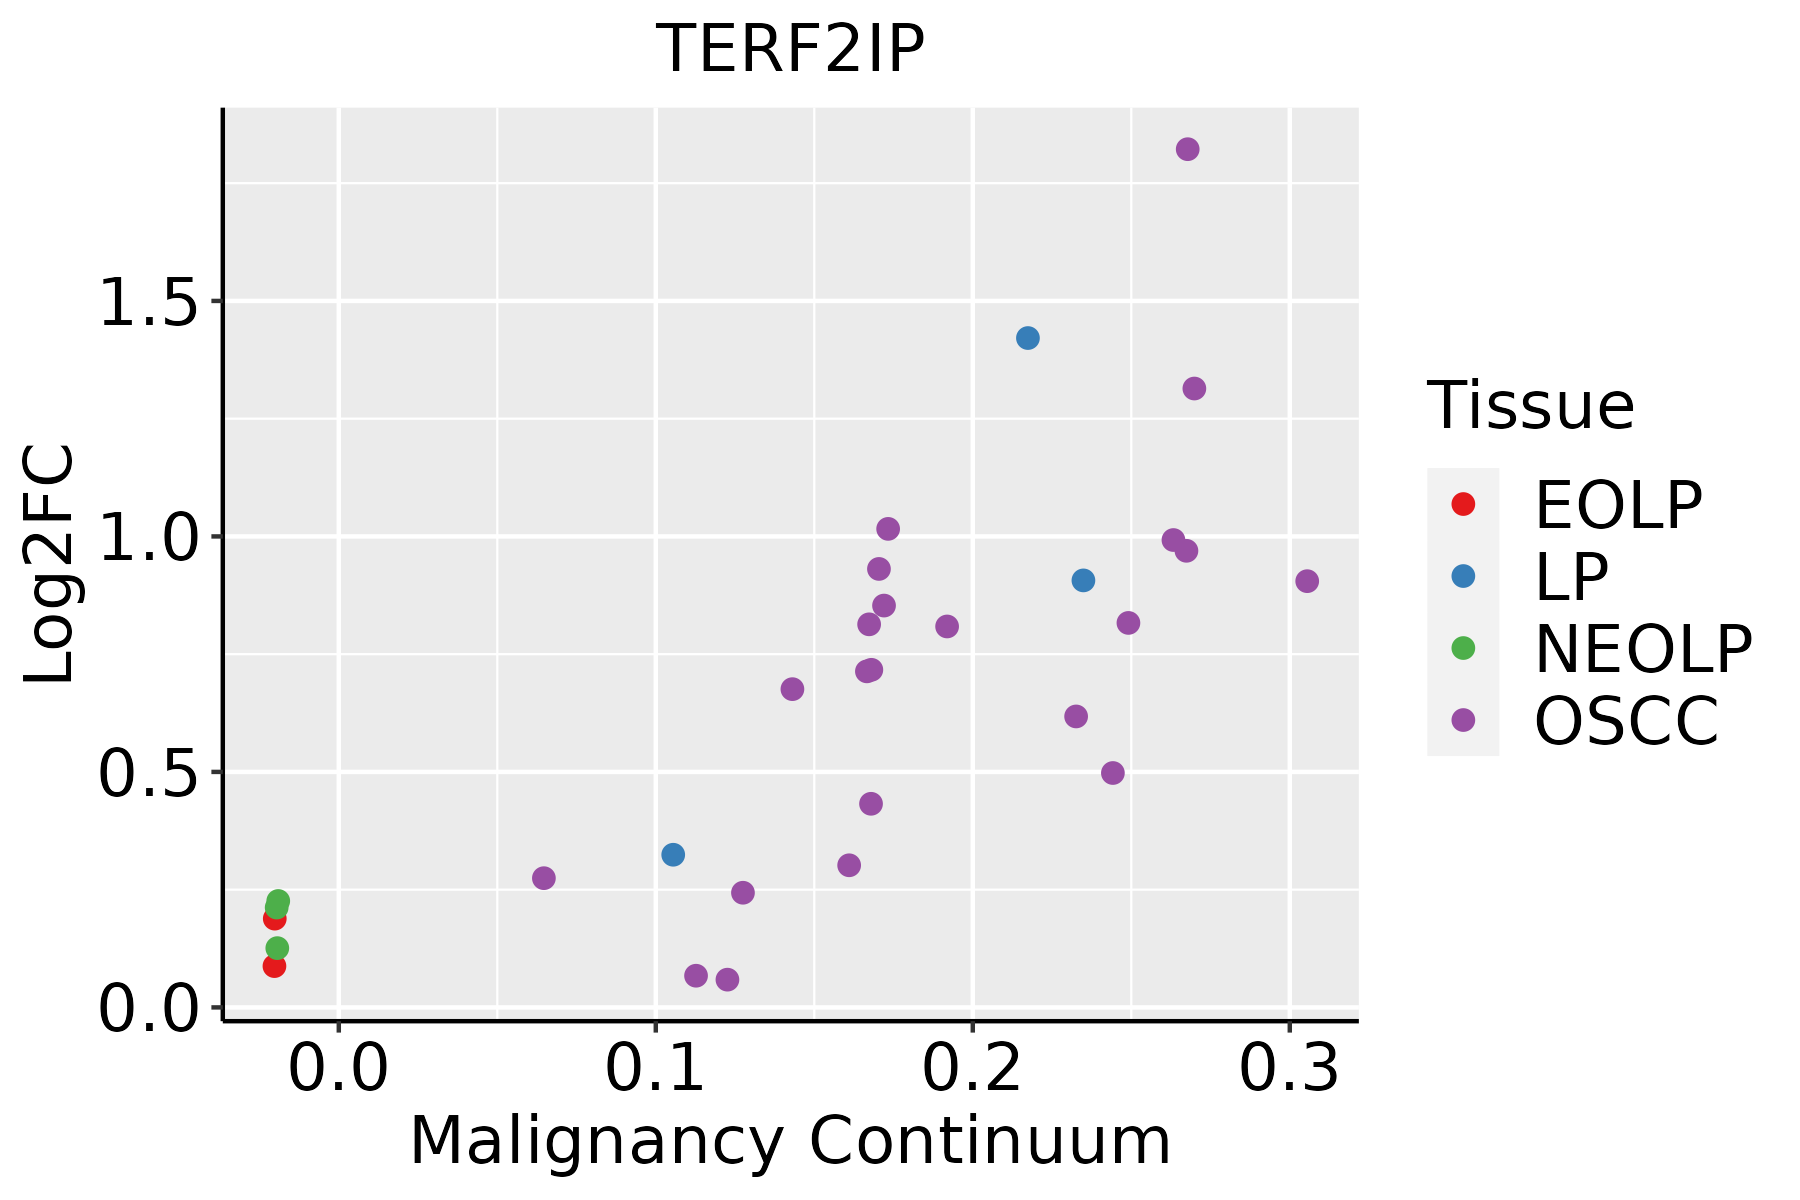 | EOLP: Erosive Oral lichen planus |
| LP: leukoplakia | ||
| NEOLP: Non-erosive oral lichen planus | ||
| OSCC: Oral squamous cell carcinoma | ||
| Prostate |  | BPH: Benign Prostatic Hyperplasia |
| Skin | 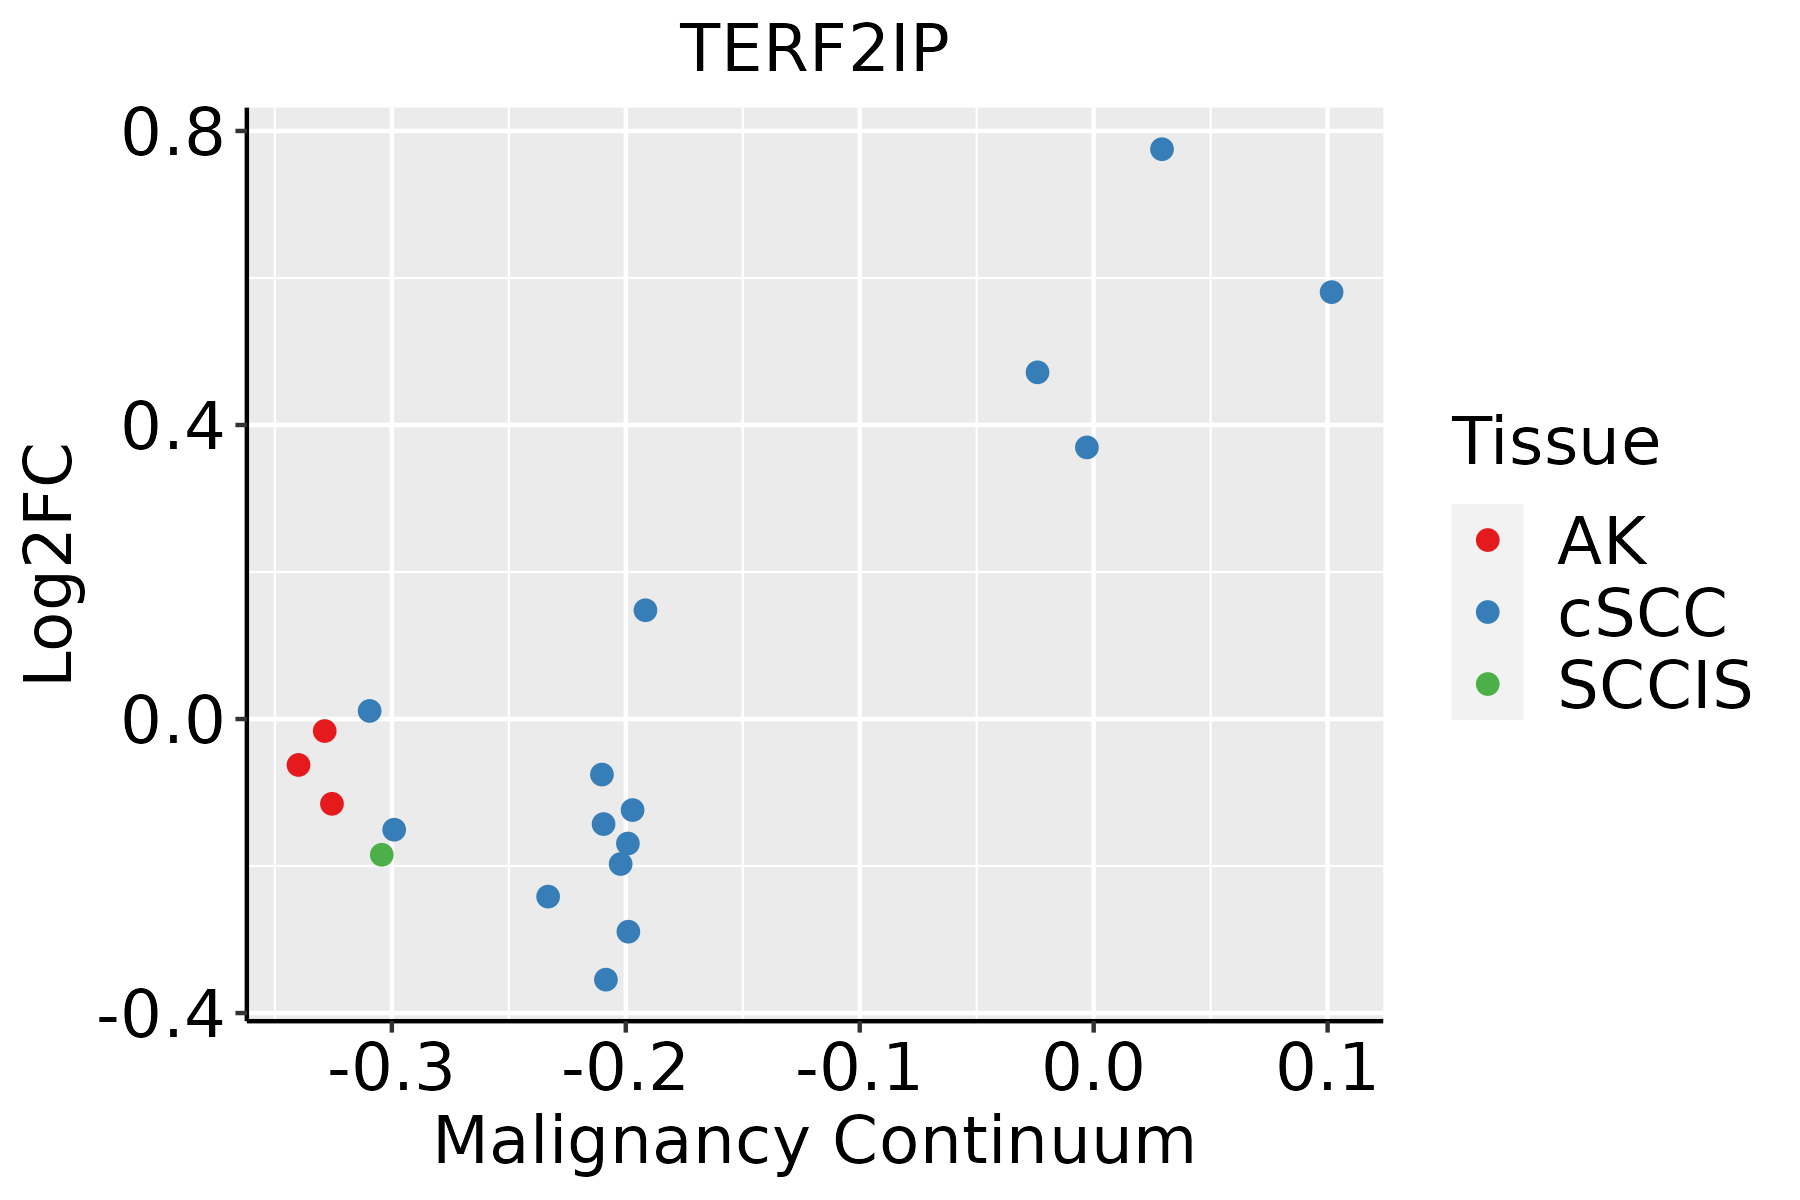 | AK: Actinic keratosis |
| cSCC: Cutaneous squamous cell carcinoma | ||
| SCCIS:squamous cell carcinoma in situ | ||
| Thyroid | 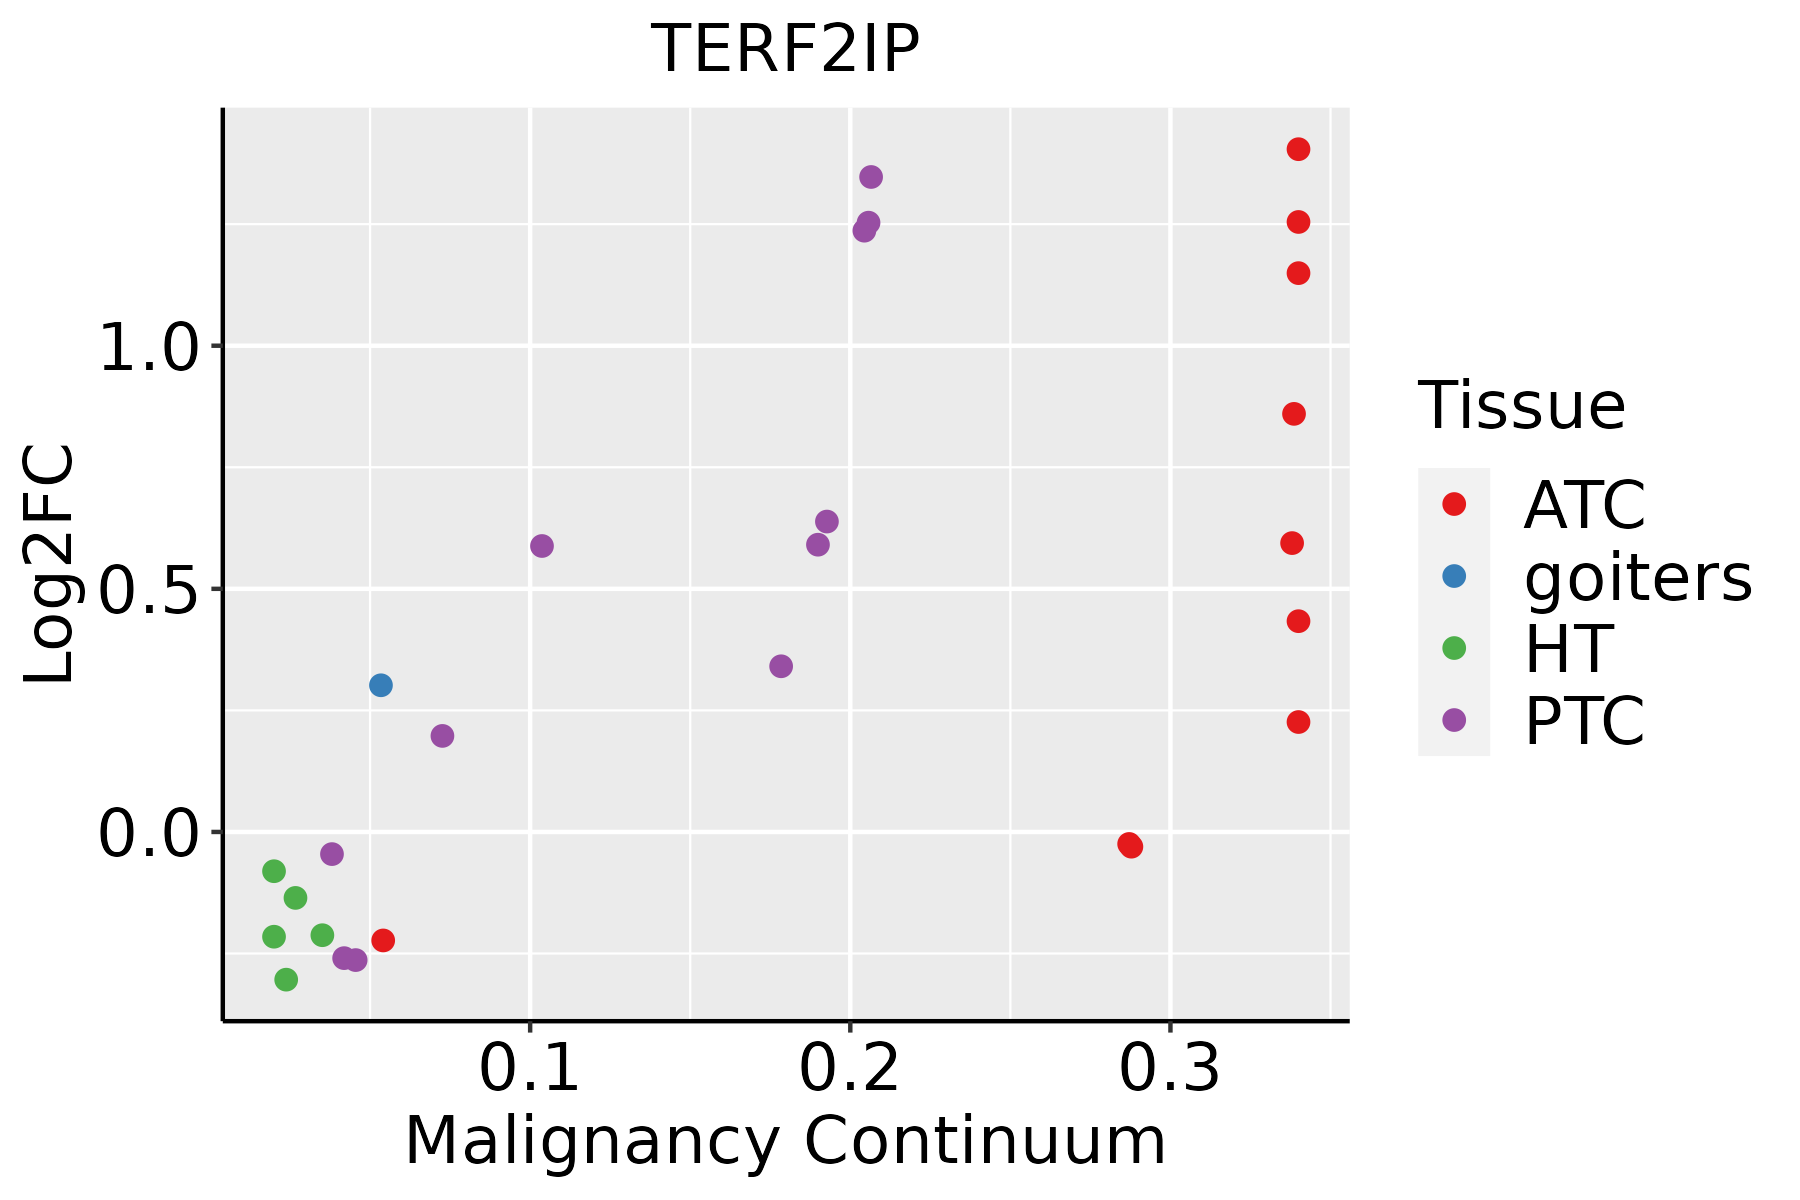 | ATC: Anaplastic thyroid cancer |
| HT: Hashimoto's thyroiditis | ||
| PTC: Papillary thyroid cancer |
| ∗log2FC in expression of this searched gene in stem-like cells from each diseased tissue sample relative to stem-like cells in normal samples in each tissue plotted against the malignancy continuum. Samples are colored based on if they are from different disease stage. |
Top |
Malignant transformation related pathway analysis |
| Find out the enriched GO biological processes and KEGG pathways involved in transition from healthy to precancer to cancer |
| Tissue | Disease Stage | Enriched GO biological Processes |
| Colorectum | AD |  |
| Colorectum | SER |  |
| Colorectum | MSS |  |
| Colorectum | MSI-H |  |
| Colorectum | FAP |  |
| ∗Top 15 enriched GO BP terms are showed in the bar plot of each disease state in each tissue. Each row represents a significant GO biological process which is colored according to the -log10(p.adjust). |
| Page: 1 2 3 4 5 6 7 8 9 |
| GO ID | Tissue | Disease Stage | Description | Gene Ratio | Bg Ratio | pvalue | p.adjust | Count |
| GO:00330449 | Esophagus | HGIN | regulation of chromosome organization | 51/2587 | 187/18723 | 8.91e-07 | 3.61e-05 | 51 |
| GO:004312220 | Esophagus | HGIN | regulation of I-kappaB kinase/NF-kappaB signaling | 63/2587 | 249/18723 | 8.91e-07 | 3.61e-05 | 63 |
| GO:000724918 | Esophagus | HGIN | I-kappaB kinase/NF-kappaB signaling | 67/2587 | 281/18723 | 3.84e-06 | 1.29e-04 | 67 |
| GO:001063920 | Esophagus | HGIN | negative regulation of organelle organization | 79/2587 | 348/18723 | 4.12e-06 | 1.37e-04 | 79 |
| GO:004312317 | Esophagus | HGIN | positive regulation of I-kappaB kinase/NF-kappaB signaling | 49/2587 | 186/18723 | 4.22e-06 | 1.40e-04 | 49 |
| GO:000072318 | Esophagus | HGIN | telomere maintenance | 38/2587 | 131/18723 | 4.38e-06 | 1.42e-04 | 38 |
| GO:003220416 | Esophagus | HGIN | regulation of telomere maintenance | 27/2587 | 80/18723 | 4.83e-06 | 1.56e-04 | 27 |
| GO:005105214 | Esophagus | HGIN | regulation of DNA metabolic process | 79/2587 | 359/18723 | 1.38e-05 | 3.85e-04 | 79 |
| GO:200102019 | Esophagus | HGIN | regulation of response to DNA damage stimulus | 52/2587 | 219/18723 | 5.00e-05 | 1.19e-03 | 52 |
| GO:007189710 | Esophagus | HGIN | DNA biosynthetic process | 44/2587 | 180/18723 | 8.97e-05 | 1.96e-03 | 44 |
| GO:004593626 | Esophagus | HGIN | negative regulation of phosphate metabolic process | 89/2587 | 441/18723 | 1.24e-04 | 2.54e-03 | 89 |
| GO:001056326 | Esophagus | HGIN | negative regulation of phosphorus metabolic process | 89/2587 | 442/18723 | 1.34e-04 | 2.71e-03 | 89 |
| GO:00701987 | Esophagus | HGIN | protein localization to chromosome, telomeric region | 12/2587 | 29/18723 | 2.48e-04 | 4.38e-03 | 12 |
| GO:004232620 | Esophagus | HGIN | negative regulation of phosphorylation | 78/2587 | 385/18723 | 2.77e-04 | 4.77e-03 | 78 |
| GO:000700417 | Esophagus | HGIN | telomere maintenance via telomerase | 21/2587 | 69/18723 | 2.80e-04 | 4.80e-03 | 21 |
| GO:00322007 | Esophagus | HGIN | telomere organization | 38/2587 | 159/18723 | 4.23e-04 | 6.39e-03 | 38 |
| GO:001083318 | Esophagus | HGIN | telomere maintenance via telomere lengthening | 23/2587 | 81/18723 | 4.52e-04 | 6.62e-03 | 23 |
| GO:00064735 | Esophagus | HGIN | protein acetylation | 45/2587 | 201/18723 | 6.17e-04 | 8.58e-03 | 45 |
| GO:000193320 | Esophagus | HGIN | negative regulation of protein phosphorylation | 69/2587 | 342/18723 | 6.81e-04 | 9.26e-03 | 69 |
| GO:000627810 | Esophagus | HGIN | RNA-dependent DNA biosynthetic process | 21/2587 | 75/18723 | 9.58e-04 | 1.21e-02 | 21 |
| Page: 1 2 3 4 5 6 7 8 9 10 11 12 13 14 15 16 17 18 19 20 21 22 |
| Pathway ID | Tissue | Disease Stage | Description | Gene Ratio | Bg Ratio | pvalue | p.adjust | qvalue | Count |
| Page: 1 |
Top |
Cell-cell communication analysis |
| Identification of potential cell-cell interactions between two cell types and their ligand-receptor pairs for different disease states |
| Ligand | Receptor | LRpair | Pathway | Tissue | Disease Stage |
| Page: 1 |
Top |
Single-cell gene regulatory network inference analysis |
| Find out the significant the regulons (TFs) and the target genes of each regulon across cell types for different disease states |
| TF | Cell Type | Tissue | Disease Stage | Target Gene | RSS | Regulon Activity |
| ∗The dot plots of a searched regulon are shown for all cell subpopulations in each disease state of each tissue based on the regulon specific score inferred using pySCENIC and by calculating the average expression. |
| Page: 1 |
Top |
Somatic mutation of malignant transformation related genes |
| Annotation of somatic variants for genes involved in malignant transformation |
| Hugo Symbol | Variant Class | Variant Classification | dbSNP RS | HGVSc | HGVSp | HGVSp Short | SWISSPROT | BIOTYPE | SIFT | PolyPhen | Tumor Sample Barcode | Tissue | Histology | Sex | Age | Stage | Therapy Types | Drugs | Outcome |
| TERF2IP | SNV | Missense_Mutation | rs754228214 | c.1174N>T | p.Arg392Trp | p.R392W | Q9NYB0 | protein_coding | deleterious(0) | probably_damaging(0.958) | TCGA-BR-4257-01 | Stomach | stomach adenocarcinoma | Female | >=65 | I/II | Unknown | Unknown | SD |
| TERF2IP | SNV | Missense_Mutation | rs774162297 | c.81N>G | p.Ser27Arg | p.S27R | Q9NYB0 | protein_coding | tolerated(0.11) | benign(0.027) | TCGA-D7-6520-01 | Stomach | stomach adenocarcinoma | Male | <65 | III/IV | Chemotherapy | epirubicin | SD |
| TERF2IP | SNV | Missense_Mutation | novel | c.134T>C | p.Leu45Pro | p.L45P | Q9NYB0 | protein_coding | deleterious(0.05) | probably_damaging(0.98) | TCGA-HU-A4G8-01 | Stomach | stomach adenocarcinoma | Female | >=65 | I/II | Chemotherapy | 5-fluorouracil | SD |
| TERF2IP | SNV | Missense_Mutation | novel | c.881N>T | p.Gln294Leu | p.Q294L | Q9NYB0 | protein_coding | tolerated(0.1) | benign(0.023) | TCGA-FY-A4B0-01 | Thyroid | thyroid carcinoma | Male | >=65 | I/II | Hormone Therapy | synthroid | SD |
| TERF2IP | insertion | In_Frame_Ins | novel | c.882_883insGACTTCCTT | p.Gln294_Pro295insAspPheLeu | p.Q294_P295insDFL | Q9NYB0 | protein_coding | TCGA-FY-A4B0-01 | Thyroid | thyroid carcinoma | Male | >=65 | I/II | Hormone Therapy | synthroid | SD |
| Page: 1 2 3 |
Top |
Related drugs of malignant transformation related genes |
| Identification of chemicals and drugs interact with genes involved in malignant transfromation |
| (DGIdb 4.0) |
| Entrez ID | Symbol | Category | Interaction Types | Drug Claim Name | Drug Name | PMIDs |
| Page: 1 |

Copyright 2023-Present -The University of Texas Health Science Center at Houston |