
|
|||||
|
 | |
| |
| |
| |
| |
| |
|
Gene: TDGF1 |
Gene summary for TDGF1 |
| Gene information | Species | Human | Gene symbol | TDGF1 | Gene ID | 6997 |
| Gene name | teratocarcinoma-derived growth factor 1 | |
| Gene Alias | CR | |
| Cytomap | 3p21.31 | |
| Gene Type | protein-coding | GO ID | GO:0000165 | UniProtAcc | F5H1T8 |
Top |
Malignant transformation analysis |
| Identification of the aberrant gene expression in precancerous and cancerous lesions by comparing the gene expression of stem-like cells in diseased tissues with normal stem cells |
| Entrez ID | Symbol | Replicates | Species | Organ | Tissue | Adj P-value | Log2FC | Malignancy |
| 6997 | TDGF1 | Pt13.a | Human | Liver | HCC | 1.93e-02 | 1.32e-01 | 0.021 |
| 6997 | TDGF1 | S014 | Human | Liver | HCC | 3.54e-25 | 1.01e+00 | 0.2254 |
| 6997 | TDGF1 | S015 | Human | Liver | HCC | 4.15e-38 | 1.49e+00 | 0.2375 |
| 6997 | TDGF1 | S016 | Human | Liver | HCC | 1.14e-37 | 1.32e+00 | 0.2243 |
| 6997 | TDGF1 | S029 | Human | Liver | HCC | 5.90e-03 | 1.26e-01 | 0.2581 |
| Page: 1 |
| Tissue | Expression Dynamics | Abbreviation |
| Liver | 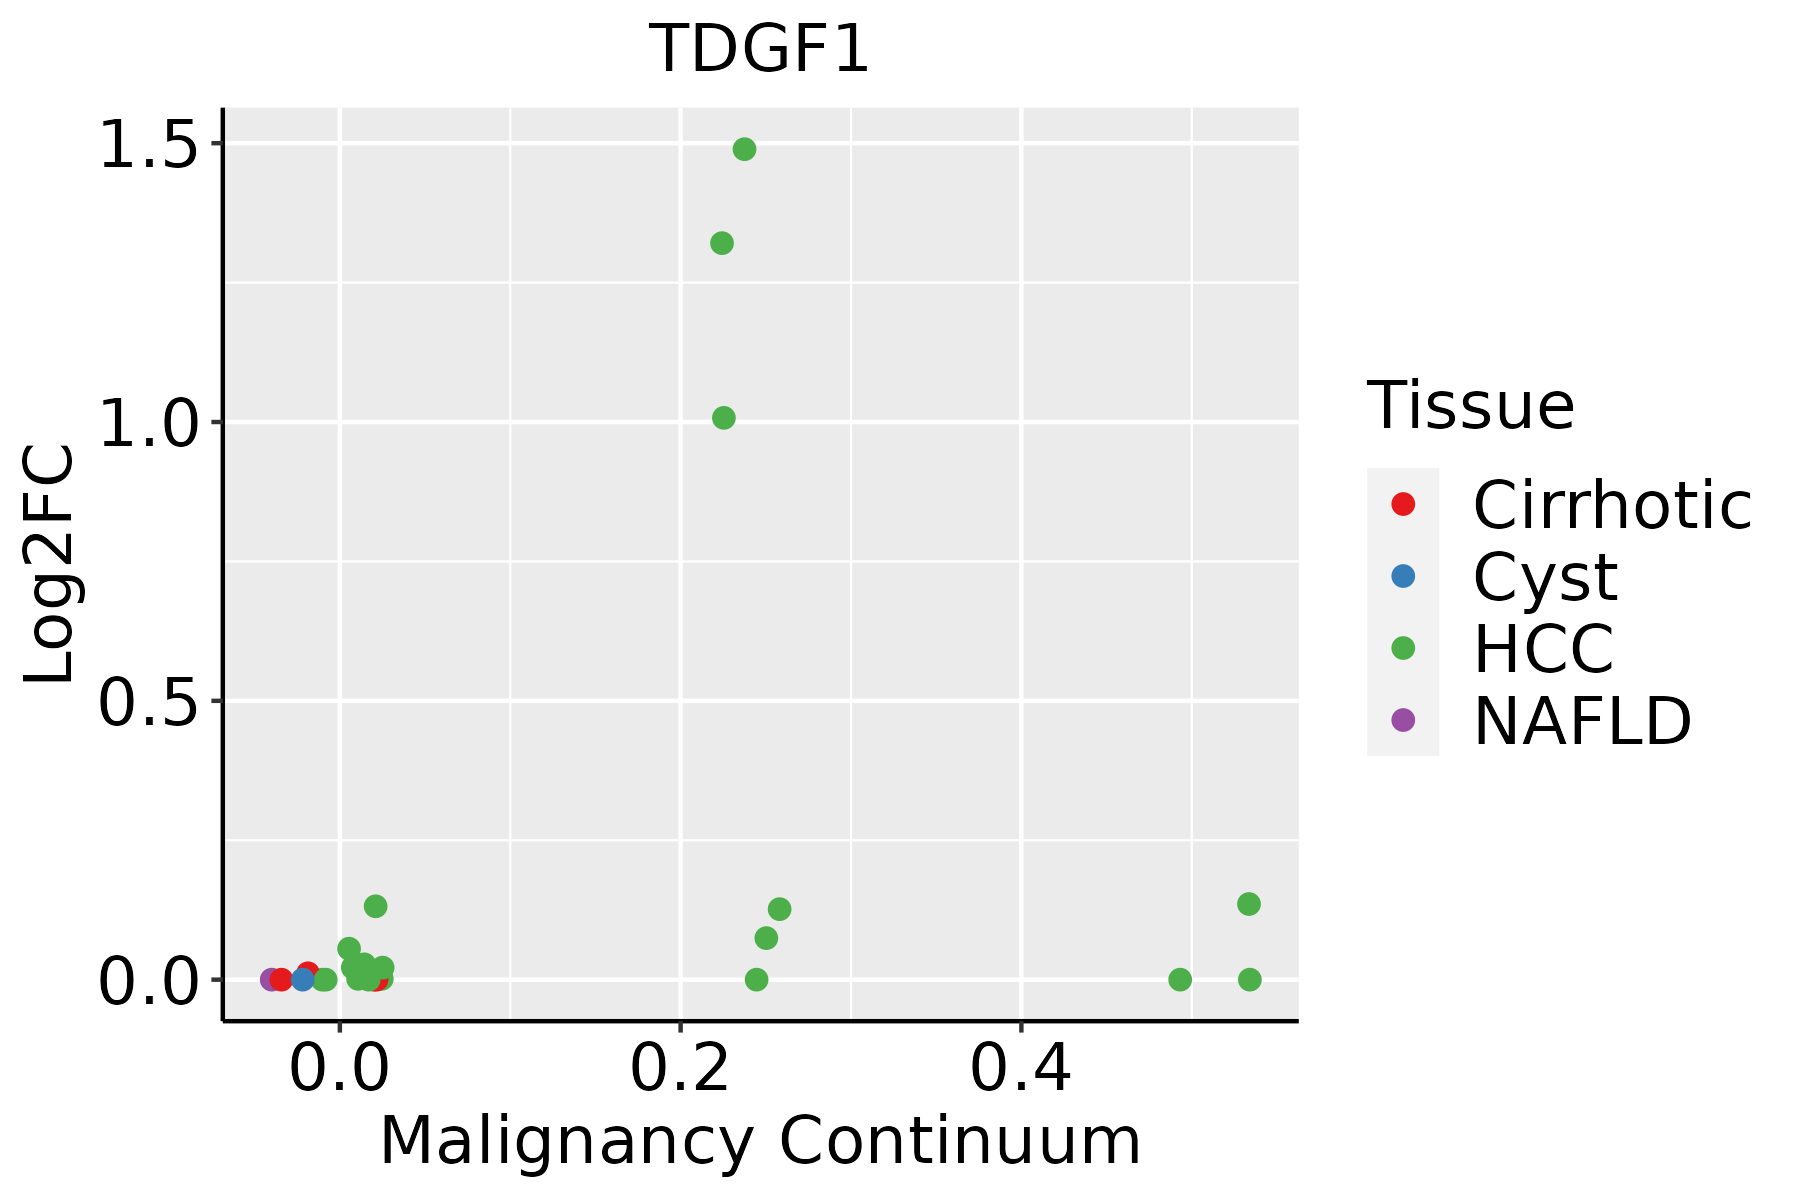 | HCC: Hepatocellular carcinoma |
| NAFLD: Non-alcoholic fatty liver disease |
| ∗log2FC in expression of this searched gene in stem-like cells from each diseased tissue sample relative to stem-like cells in normal samples in each tissue plotted against the malignancy continuum. Samples are colored based on if they are from different disease stage. |
Top |
Malignant transformation related pathway analysis |
| Find out the enriched GO biological processes and KEGG pathways involved in transition from healthy to precancer to cancer |
| Tissue | Disease Stage | Enriched GO biological Processes |
| Colorectum | AD |  |
| Colorectum | SER |  |
| Colorectum | MSS |  |
| Colorectum | MSI-H |  |
| Colorectum | FAP |  |
| ∗Top 15 enriched GO BP terms are showed in the bar plot of each disease state in each tissue. Each row represents a significant GO biological process which is colored according to the -log10(p.adjust). |
| Page: 1 2 3 4 5 6 7 8 9 |
| GO ID | Tissue | Disease Stage | Description | Gene Ratio | Bg Ratio | pvalue | p.adjust | Count |
| GO:004873222 | Liver | HCC | gland development | 242/7958 | 436/18723 | 2.26e-08 | 5.28e-07 | 242 |
| GO:007084911 | Liver | HCC | response to epidermal growth factor | 37/7958 | 49/18723 | 2.70e-06 | 3.61e-05 | 37 |
| GO:007136411 | Liver | HCC | cellular response to epidermal growth factor stimulus | 34/7958 | 45/18723 | 6.75e-06 | 8.08e-05 | 34 |
| GO:001810511 | Liver | HCC | peptidyl-serine phosphorylation | 169/7958 | 315/18723 | 3.86e-05 | 3.81e-04 | 169 |
| GO:007190021 | Liver | HCC | regulation of protein serine/threonine kinase activity | 189/7958 | 359/18723 | 5.97e-05 | 5.47e-04 | 189 |
| GO:00343411 | Liver | HCC | response to interferon-gamma | 82/7958 | 141/18723 | 1.25e-04 | 1.03e-03 | 82 |
| GO:001820911 | Liver | HCC | peptidyl-serine modification | 177/7958 | 338/18723 | 1.45e-04 | 1.17e-03 | 177 |
| GO:00713461 | Liver | HCC | cellular response to interferon-gamma | 70/7958 | 118/18723 | 1.66e-04 | 1.32e-03 | 70 |
| GO:0035729 | Liver | HCC | cellular response to hepatocyte growth factor stimulus | 14/7958 | 17/18723 | 9.39e-04 | 5.47e-03 | 14 |
| GO:003461211 | Liver | HCC | response to tumor necrosis factor | 132/7958 | 253/18723 | 1.14e-03 | 6.48e-03 | 132 |
| GO:004586021 | Liver | HCC | positive regulation of protein kinase activity | 194/7958 | 386/18723 | 1.16e-03 | 6.54e-03 | 194 |
| GO:0035728 | Liver | HCC | response to hepatocyte growth factor | 15/7958 | 19/18723 | 1.36e-03 | 7.28e-03 | 15 |
| GO:003367411 | Liver | HCC | positive regulation of kinase activity | 230/7958 | 467/18723 | 1.72e-03 | 8.95e-03 | 230 |
| GO:00308795 | Liver | HCC | mammary gland development | 75/7958 | 137/18723 | 2.52e-03 | 1.22e-02 | 75 |
| GO:007135611 | Liver | HCC | cellular response to tumor necrosis factor | 115/7958 | 229/18723 | 1.08e-02 | 3.99e-02 | 115 |
| GO:000166721 | Liver | HCC | ameboidal-type cell migration | 226/7958 | 475/18723 | 1.35e-02 | 4.81e-02 | 226 |
| Page: 1 |
| Pathway ID | Tissue | Disease Stage | Description | Gene Ratio | Bg Ratio | pvalue | p.adjust | qvalue | Count |
| Page: 1 |
Top |
Cell-cell communication analysis |
| Identification of potential cell-cell interactions between two cell types and their ligand-receptor pairs for different disease states |
| Ligand | Receptor | LRpair | Pathway | Tissue | Disease Stage |
| Page: 1 |
Top |
Single-cell gene regulatory network inference analysis |
| Find out the significant the regulons (TFs) and the target genes of each regulon across cell types for different disease states |
| TF | Cell Type | Tissue | Disease Stage | Target Gene | RSS | Regulon Activity |
| ∗The dot plots of a searched regulon are shown for all cell subpopulations in each disease state of each tissue based on the regulon specific score inferred using pySCENIC and by calculating the average expression. |
| Page: 1 |
Top |
Somatic mutation of malignant transformation related genes |
| Annotation of somatic variants for genes involved in malignant transformation |
| Hugo Symbol | Variant Class | Variant Classification | dbSNP RS | HGVSc | HGVSp | HGVSp Short | SWISSPROT | BIOTYPE | SIFT | PolyPhen | Tumor Sample Barcode | Tissue | Histology | Sex | Age | Stage | Therapy Types | Drugs | Outcome |
| TDGF1 | SNV | Missense_Mutation | novel | c.15N>T | p.Lys5Asn | p.K5N | P13385 | protein_coding | deleterious_low_confidence(0.02) | benign(0.273) | TCGA-4R-AA8I-01 | Liver | liver hepatocellular carcinoma | Male | >=65 | I/II | Unknown | Unknown | PD |
| TDGF1 | SNV | Missense_Mutation | c.256G>T | p.Gly86Trp | p.G86W | P13385 | protein_coding | deleterious(0) | probably_damaging(1) | TCGA-05-4430-01 | Lung | lung adenocarcinoma | Female | <65 | I/II | Unknown | Unknown | SD | |
| TDGF1 | SNV | Missense_Mutation | novel | c.428N>C | p.Gln143Pro | p.Q143P | P13385 | protein_coding | deleterious(0) | probably_damaging(0.991) | TCGA-43-8116-01 | Lung | lung squamous cell carcinoma | Male | >=65 | I/II | Unknown | Unknown | SD |
| TDGF1 | SNV | Missense_Mutation | novel | c.140G>C | p.Arg47Thr | p.R47T | P13385 | protein_coding | tolerated(0.27) | benign(0.001) | TCGA-CR-5248-01 | Oral cavity | head & neck squamous cell carcinoma | Male | <65 | I/II | Chemotherapy | oxaliplatin | PD |
| Page: 1 2 3 |
Top |
Related drugs of malignant transformation related genes |
| Identification of chemicals and drugs interact with genes involved in malignant transfromation |
| (DGIdb 4.0) |
| Entrez ID | Symbol | Category | Interaction Types | Drug Claim Name | Drug Name | PMIDs |
| 6997 | TDGF1 | DRUGGABLE GENOME, CELL SURFACE, GROWTH FACTOR | BIIB 015 |
| Page: 1 |

Copyright 2023-Present -The University of Texas Health Science Center at Houston |