| Tissue | Expression Dynamics | Abbreviation |
| Cervix | 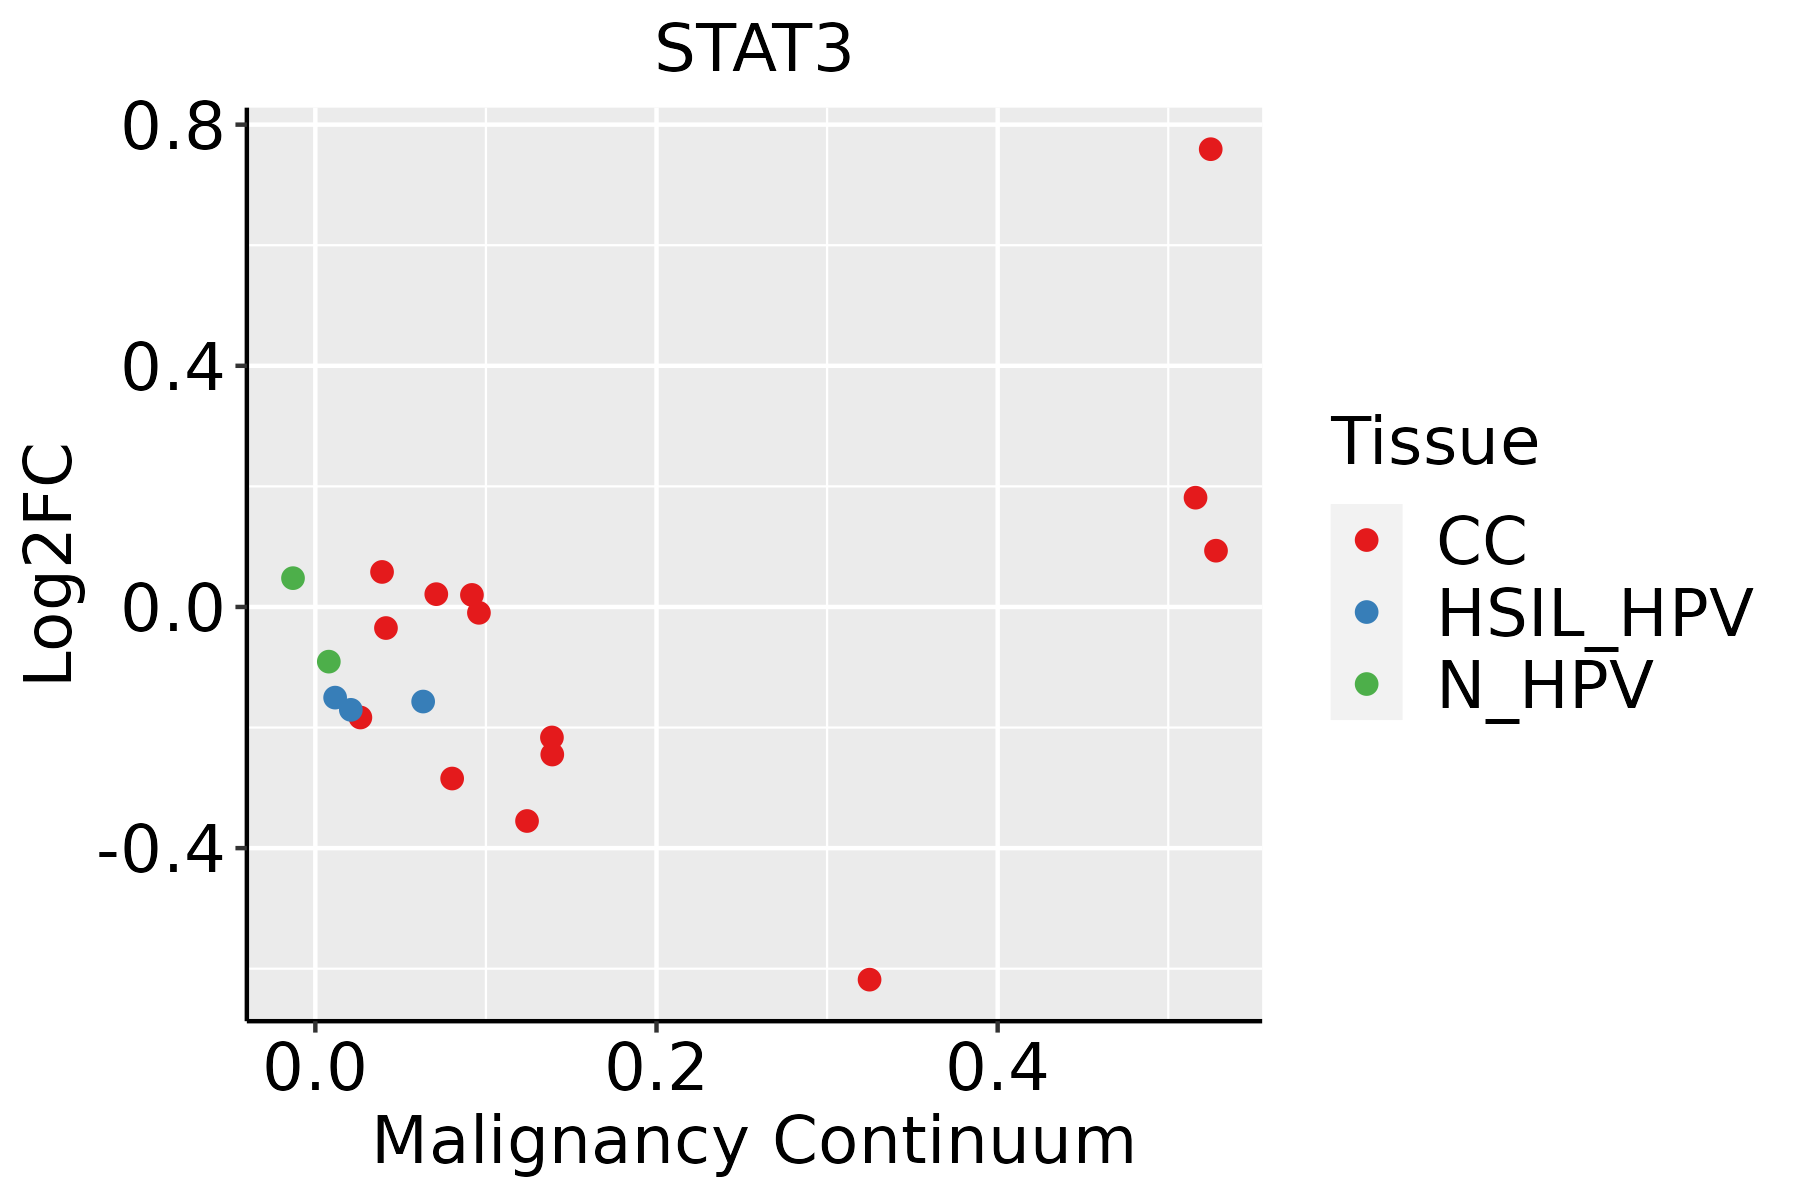 | CC: Cervix cancer |
| HSIL_HPV: HPV-infected high-grade squamous intraepithelial lesions |
| N_HPV: HPV-infected normal cervix |
| Colorectum (GSE201348) | 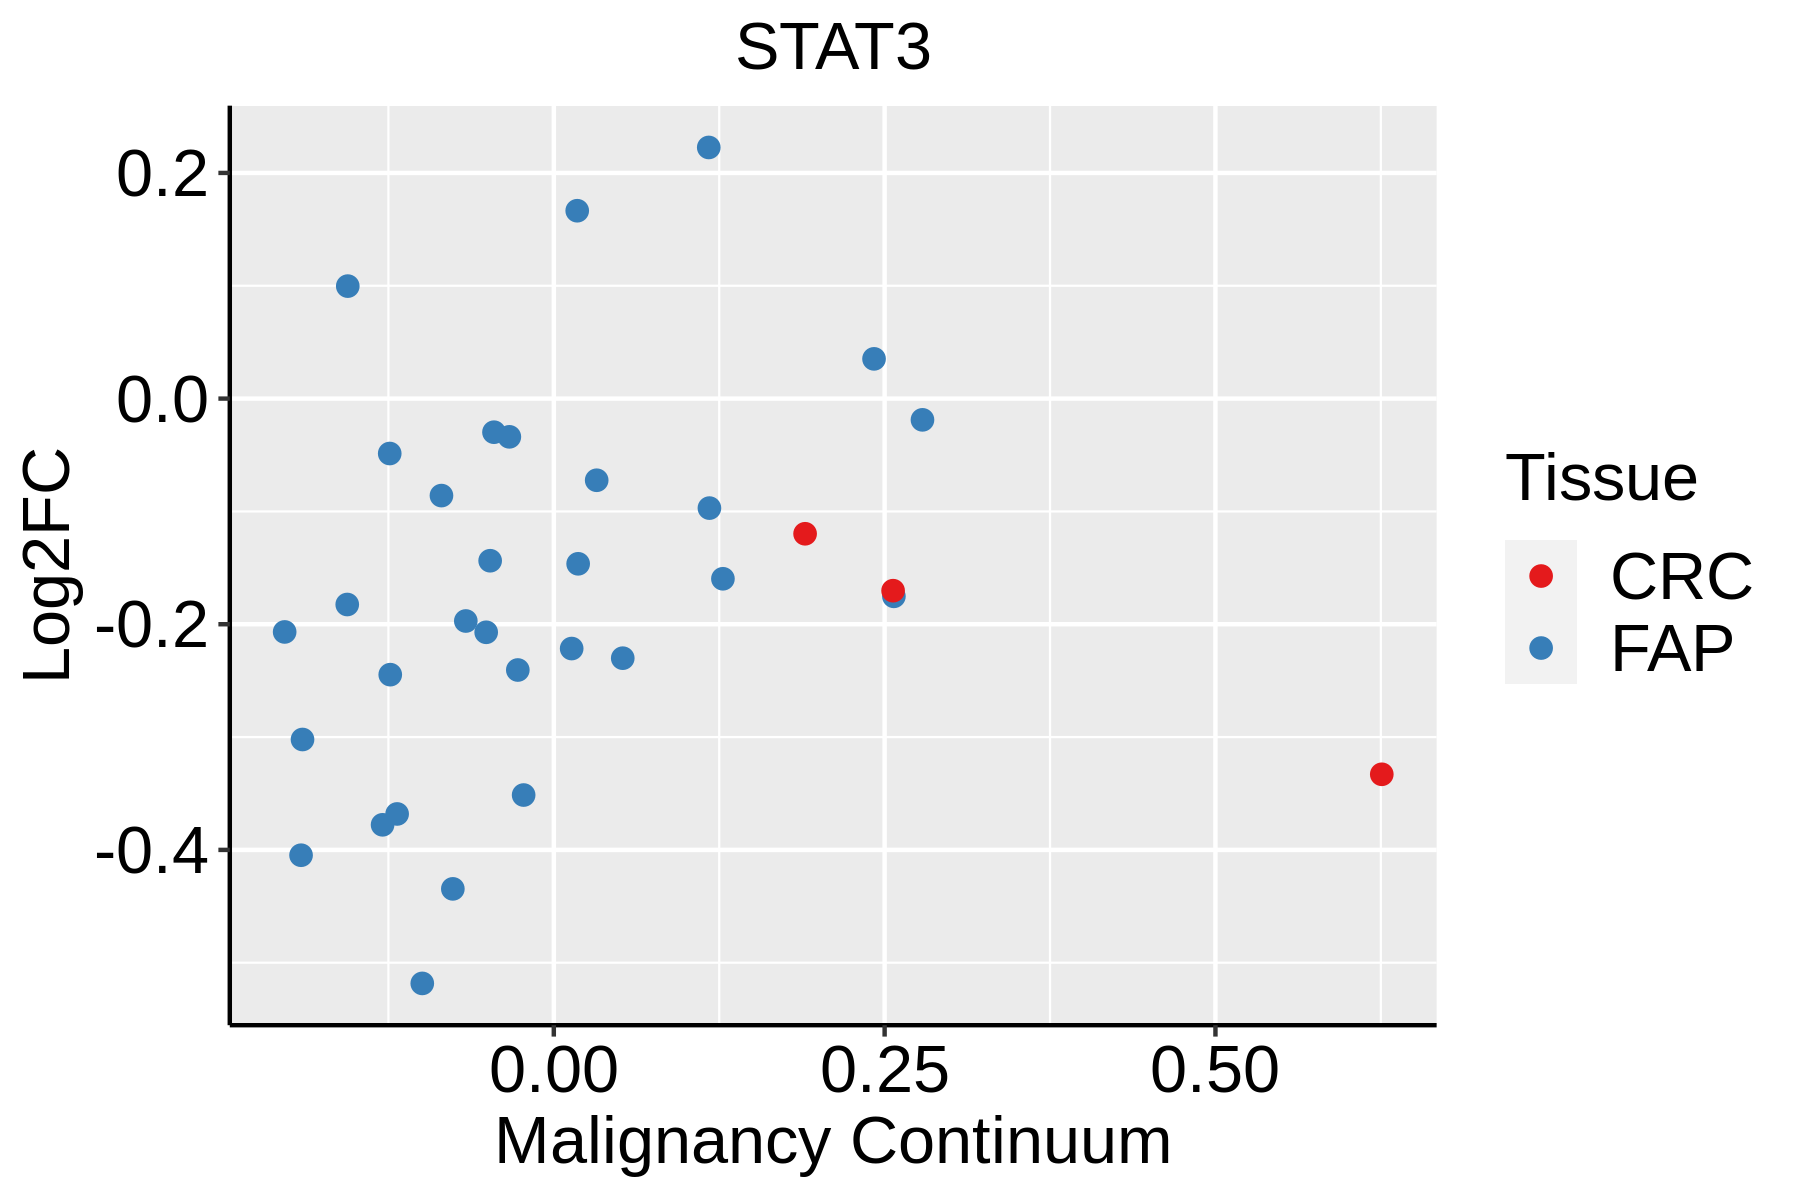 | FAP: Familial adenomatous polyposis |
| CRC: Colorectal cancer |
| Colorectum (HTA11) |  | AD: Adenomas |
| SER: Sessile serrated lesions |
| MSI-H: Microsatellite-high colorectal cancer |
| MSS: Microsatellite stable colorectal cancer |
| Esophagus | 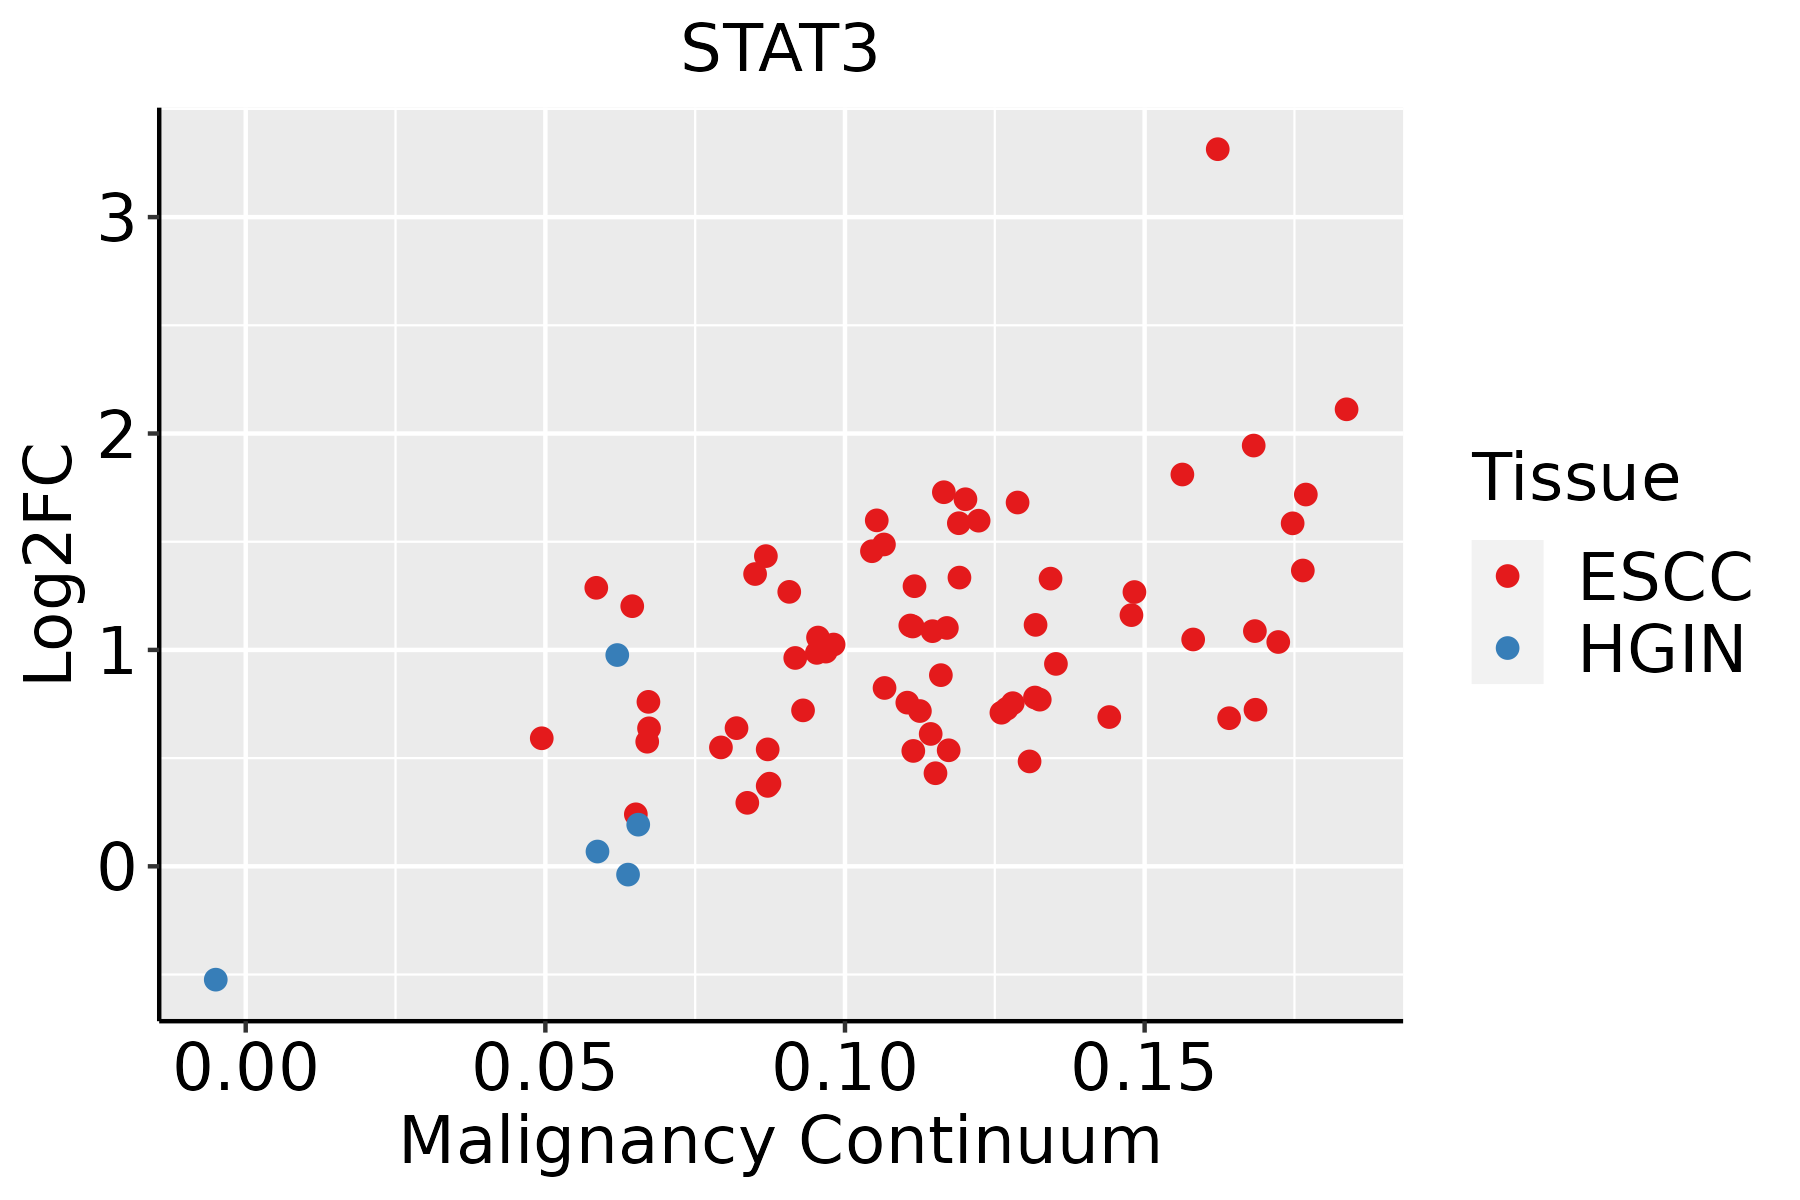 | ESCC: Esophageal squamous cell carcinoma |
| HGIN: High-grade intraepithelial neoplasias |
| LGIN: Low-grade intraepithelial neoplasias |
| Liver | 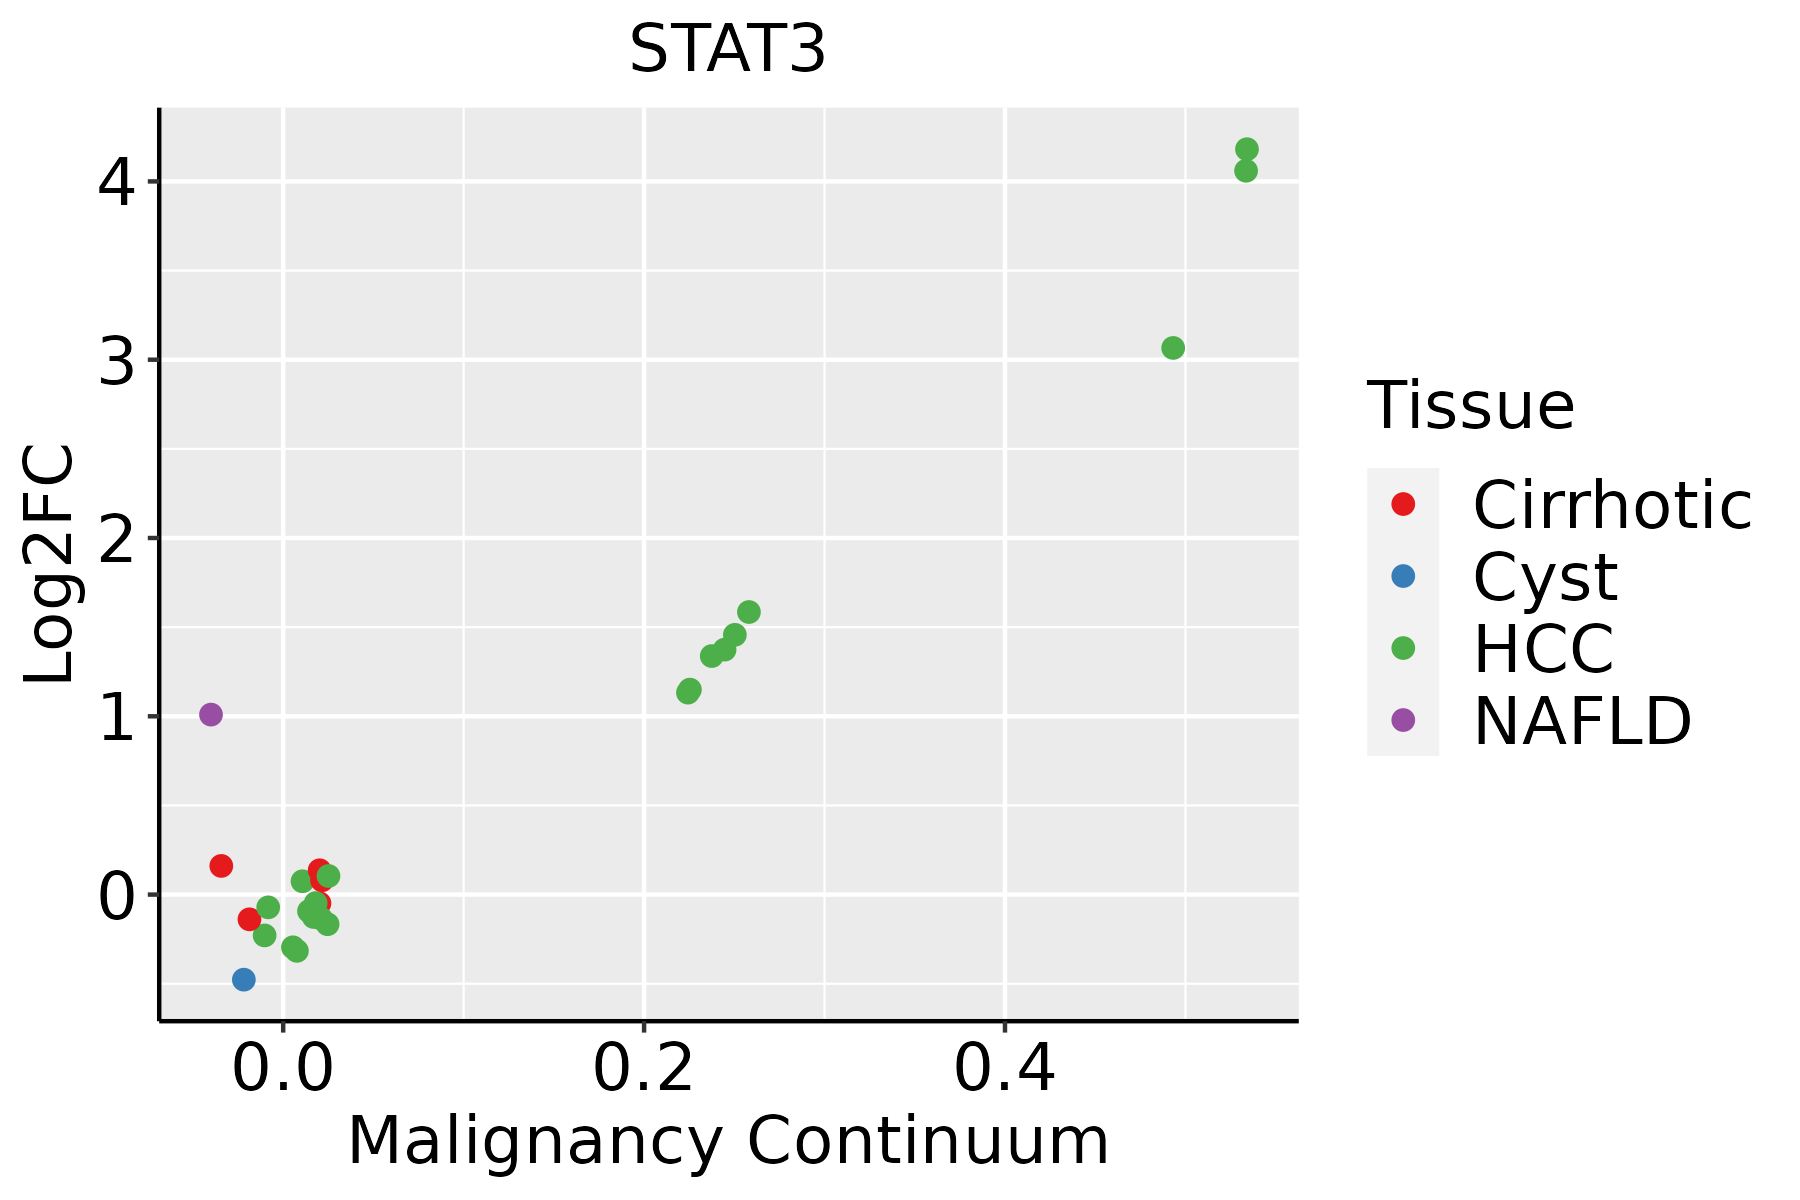 | HCC: Hepatocellular carcinoma |
| NAFLD: Non-alcoholic fatty liver disease |
| Lung | 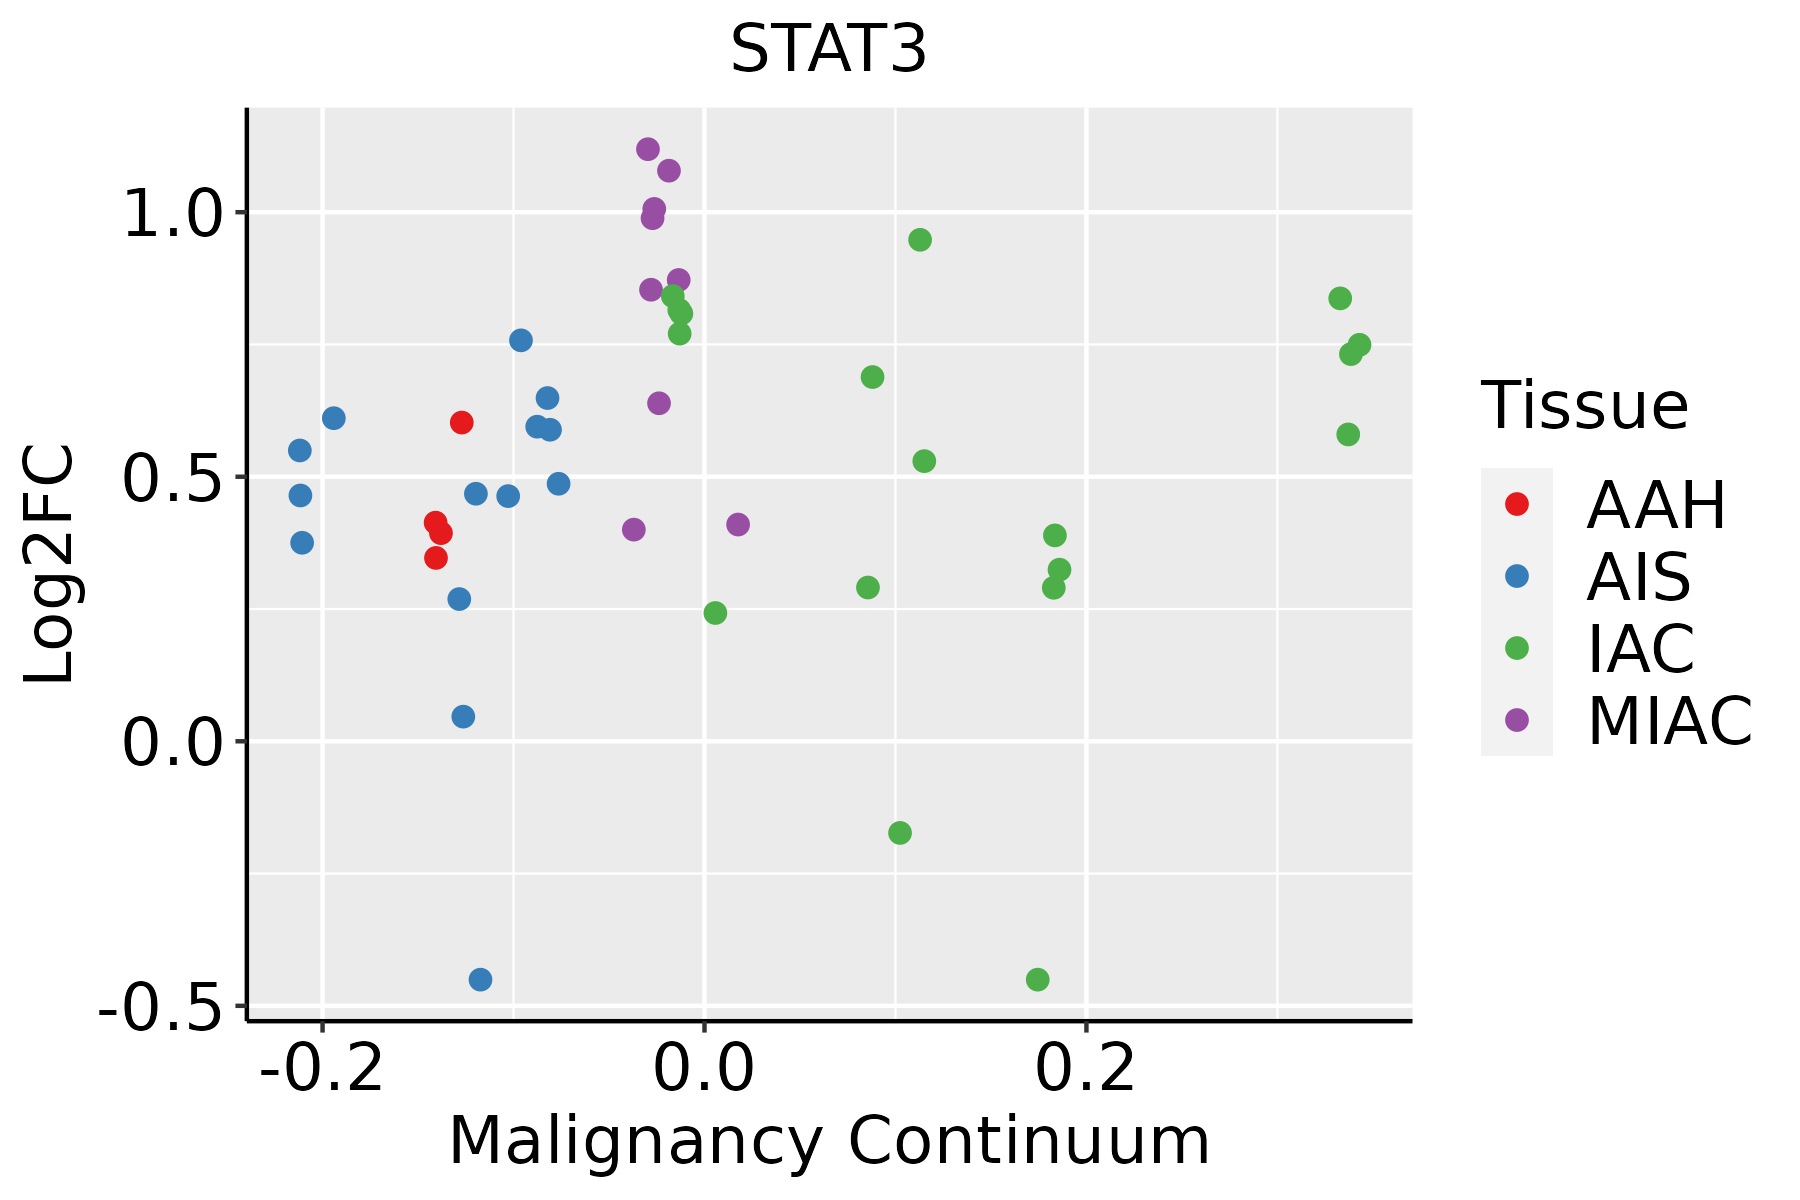 | AAH: Atypical adenomatous hyperplasia |
| AIS: Adenocarcinoma in situ |
| IAC: Invasive lung adenocarcinoma |
| MIA: Minimally invasive adenocarcinoma |
| Oral Cavity | 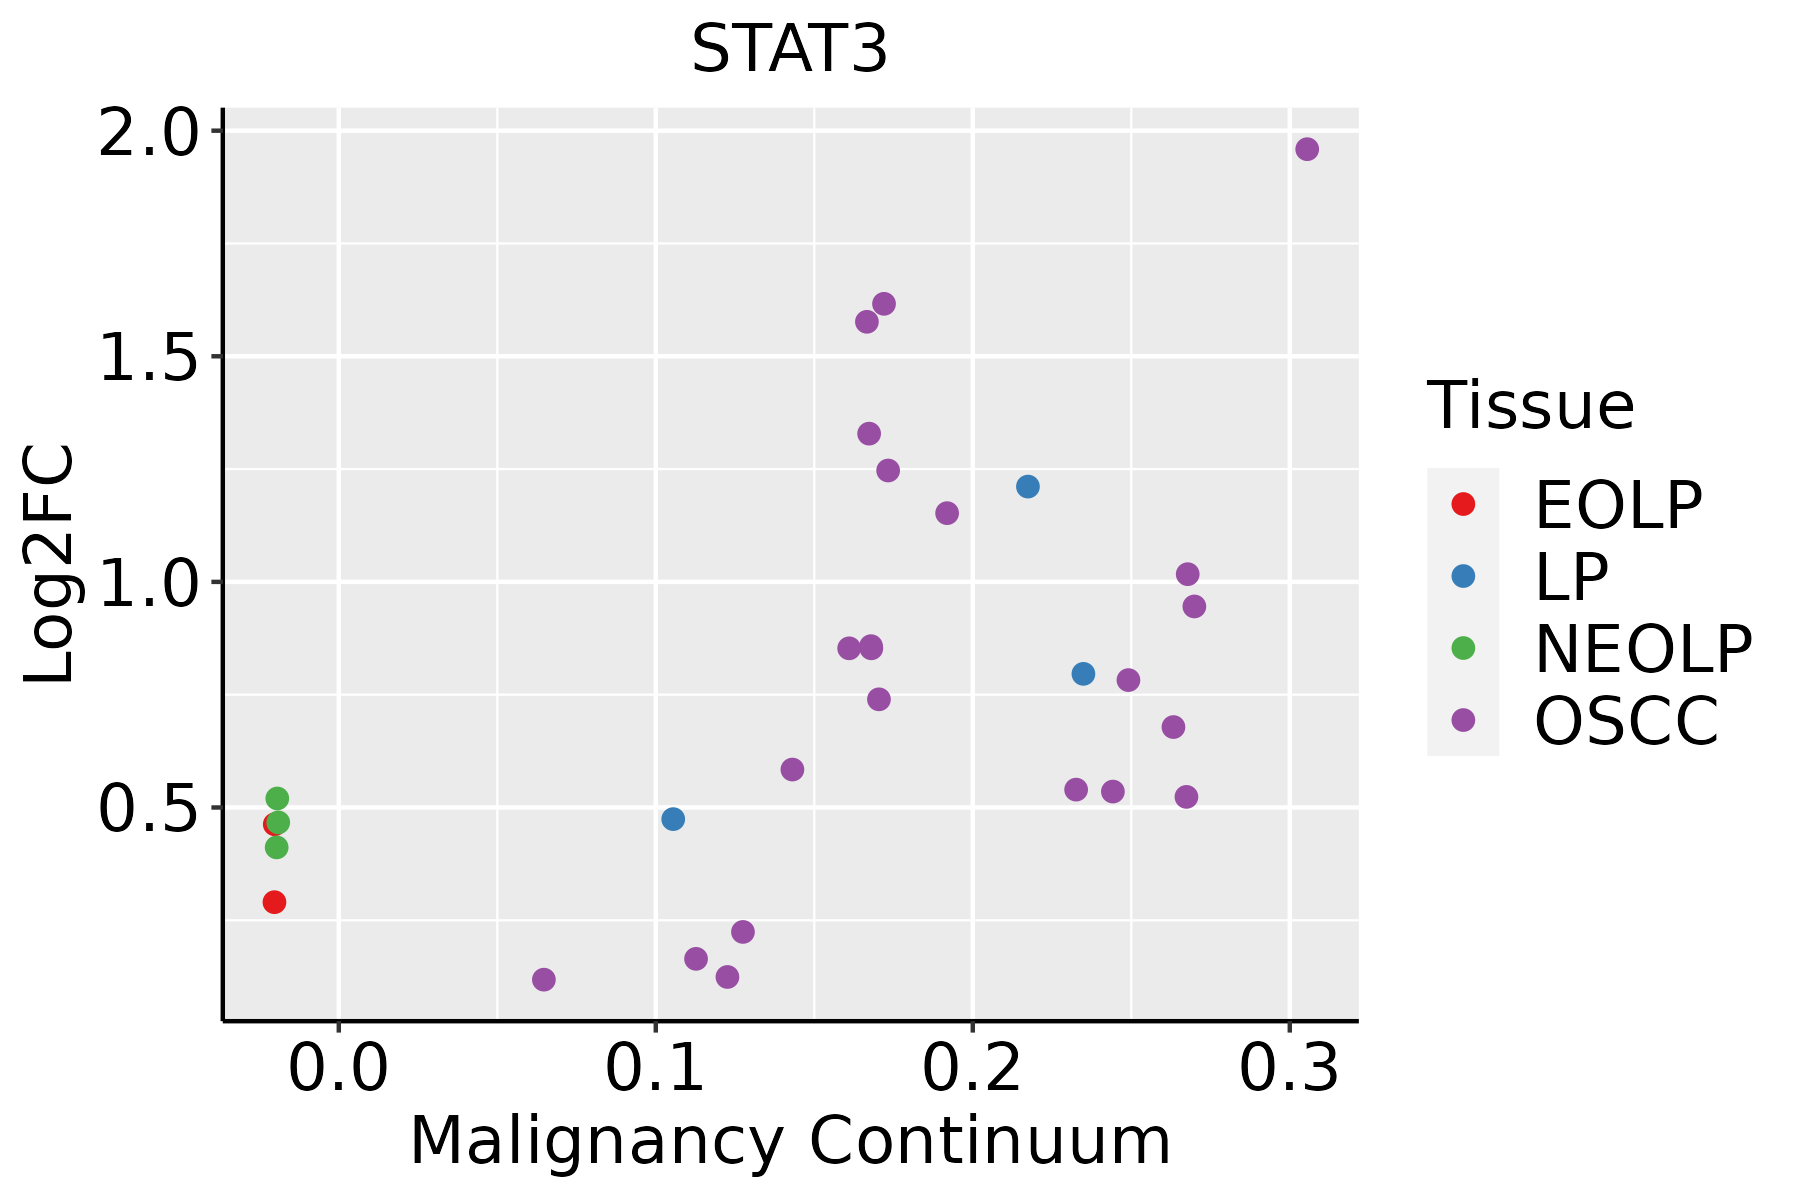 | EOLP: Erosive Oral lichen planus |
| LP: leukoplakia |
| NEOLP: Non-erosive oral lichen planus |
| OSCC: Oral squamous cell carcinoma |
| Prostate | 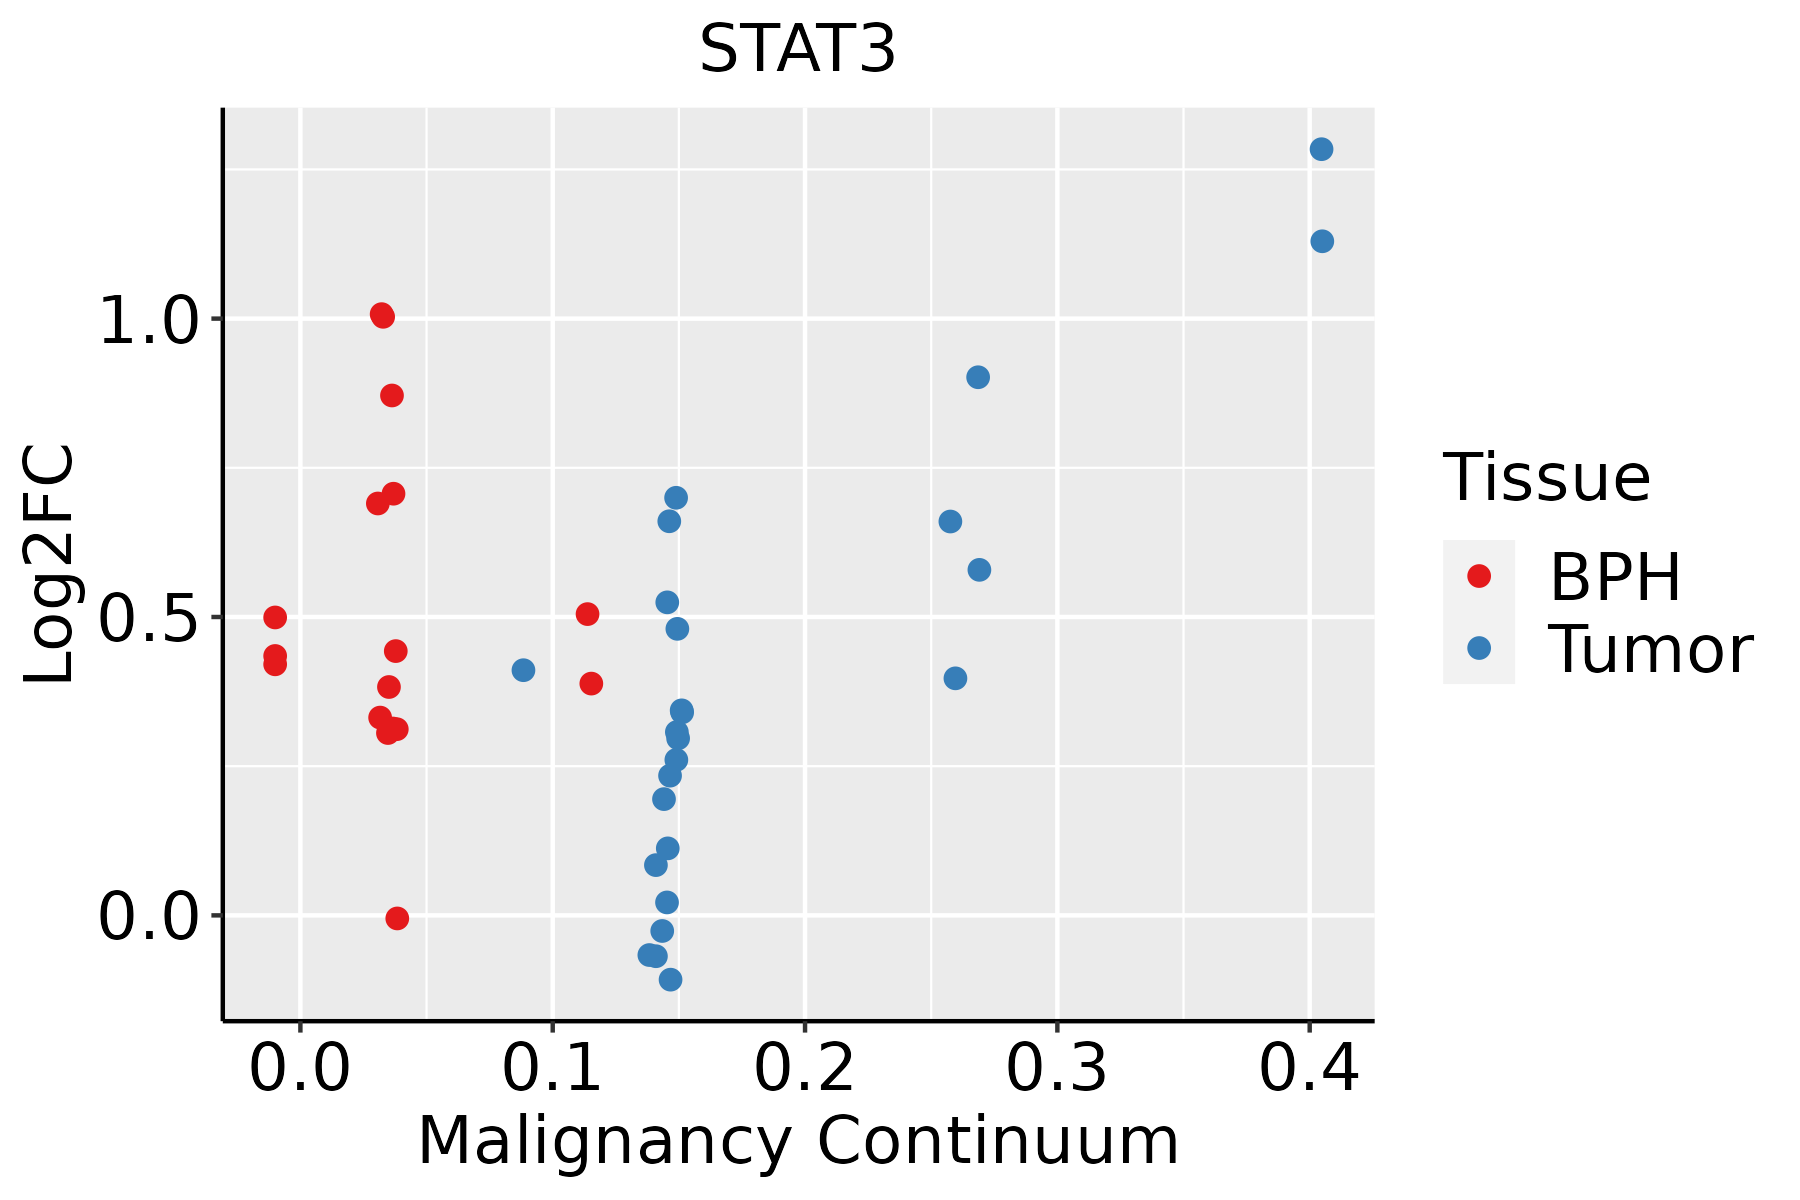 | BPH: Benign Prostatic Hyperplasia |
| Skin | 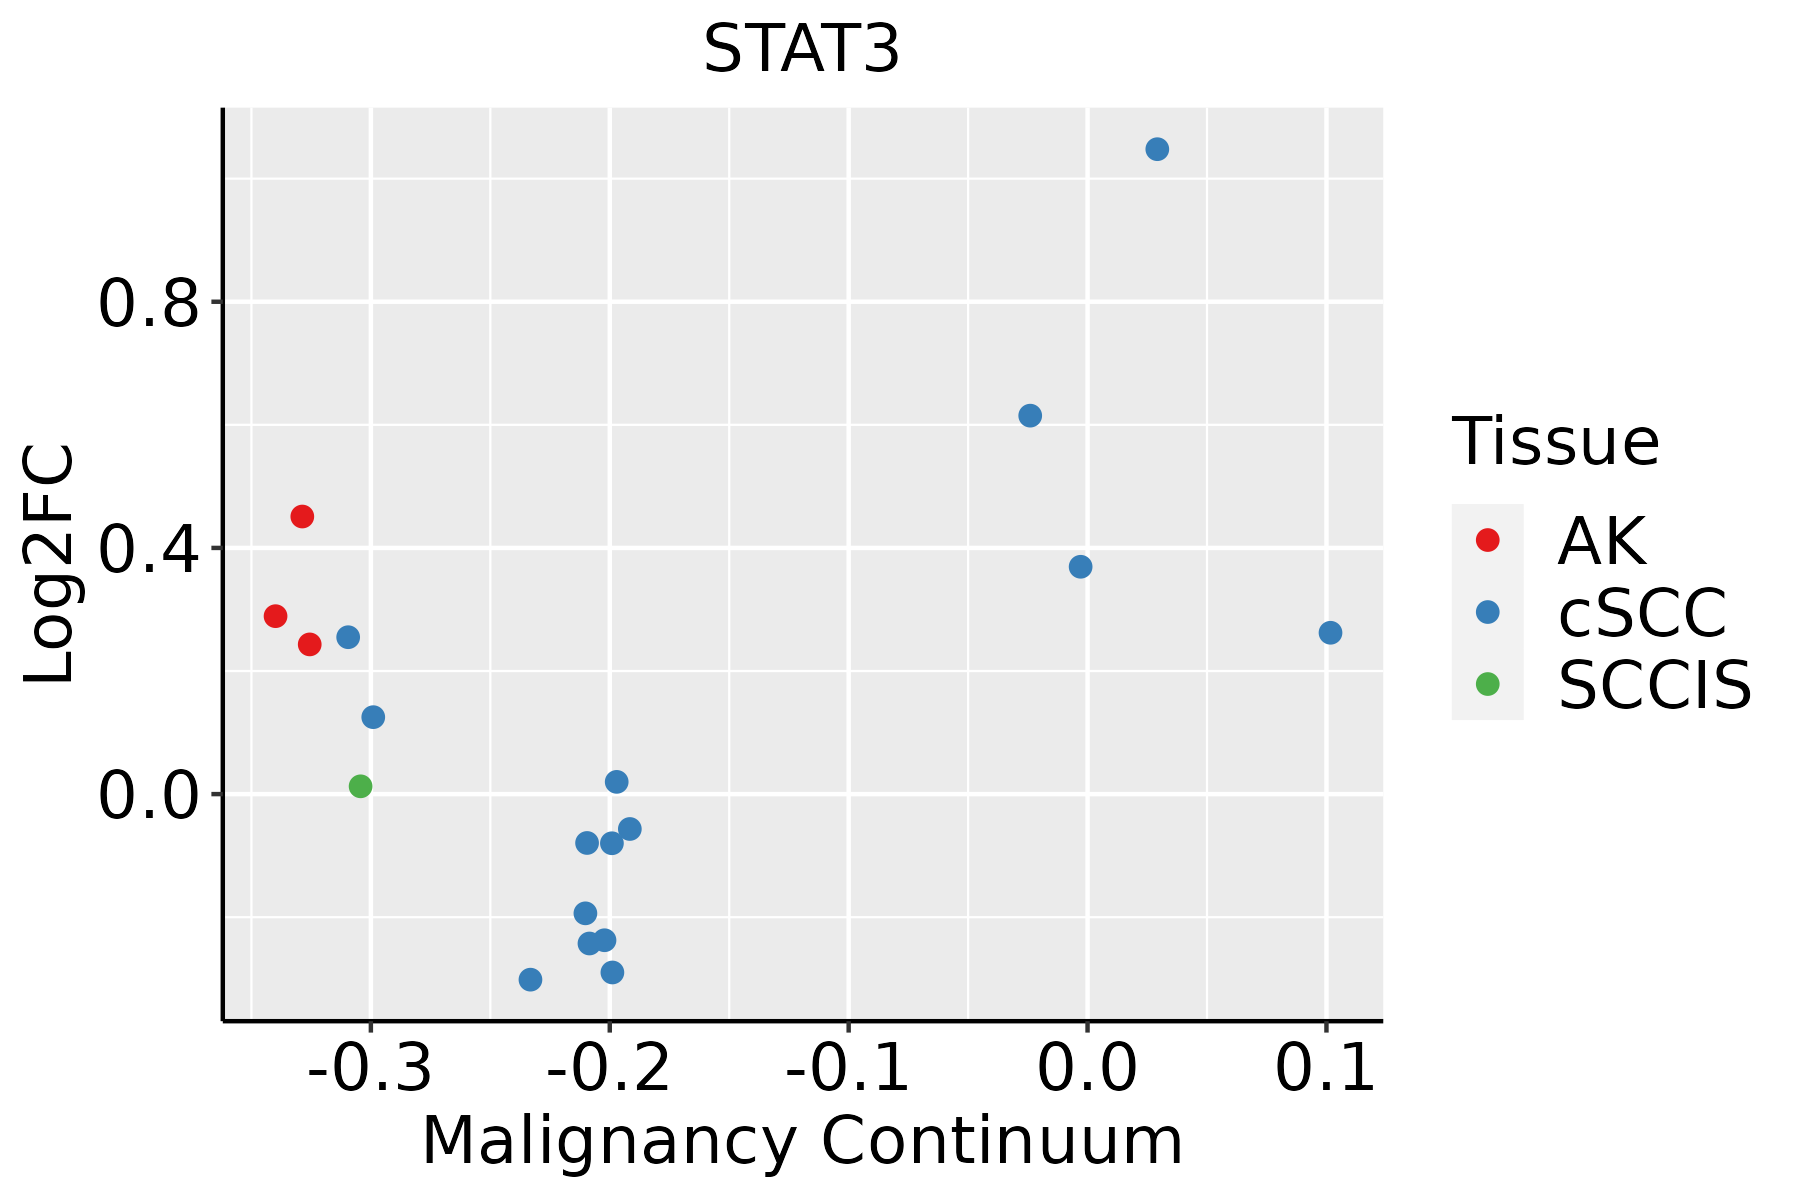 | AK: Actinic keratosis |
| cSCC: Cutaneous squamous cell carcinoma |
| SCCIS:squamous cell carcinoma in situ |
| Thyroid |  | ATC: Anaplastic thyroid cancer |
| HT: Hashimoto's thyroiditis |
| PTC: Papillary thyroid cancer |
| GO ID | Tissue | Disease Stage | Description | Gene Ratio | Bg Ratio | pvalue | p.adjust | Count |
| GO:004603410 | Cervix | CC | ATP metabolic process | 90/2311 | 277/18723 | 7.90e-19 | 2.36e-15 | 90 |
| GO:005254710 | Cervix | CC | regulation of peptidase activity | 112/2311 | 461/18723 | 6.70e-13 | 3.08e-10 | 112 |
| GO:004586210 | Cervix | CC | positive regulation of proteolysis | 95/2311 | 372/18723 | 1.84e-12 | 6.86e-10 | 95 |
| GO:005254810 | Cervix | CC | regulation of endopeptidase activity | 103/2311 | 432/18723 | 1.89e-11 | 5.14e-09 | 103 |
| GO:00725949 | Cervix | CC | establishment of protein localization to organelle | 99/2311 | 422/18723 | 1.23e-10 | 2.11e-08 | 99 |
| GO:00421108 | Cervix | CC | T cell activation | 107/2311 | 487/18723 | 1.24e-09 | 1.46e-07 | 107 |
| GO:00506737 | Cervix | CC | epithelial cell proliferation | 98/2311 | 437/18723 | 2.01e-09 | 2.15e-07 | 98 |
| GO:00060919 | Cervix | CC | generation of precursor metabolites and energy | 105/2311 | 490/18723 | 7.40e-09 | 6.61e-07 | 105 |
| GO:001095210 | Cervix | CC | positive regulation of peptidase activity | 54/2311 | 197/18723 | 8.06e-09 | 6.99e-07 | 54 |
| GO:00069139 | Cervix | CC | nucleocytoplasmic transport | 71/2311 | 301/18723 | 4.04e-08 | 2.54e-06 | 71 |
| GO:00511699 | Cervix | CC | nuclear transport | 71/2311 | 301/18723 | 4.04e-08 | 2.54e-06 | 71 |
| GO:00345048 | Cervix | CC | protein localization to nucleus | 68/2311 | 290/18723 | 9.91e-08 | 5.25e-06 | 68 |
| GO:003133010 | Cervix | CC | negative regulation of cellular catabolic process | 63/2311 | 262/18723 | 1.10e-07 | 5.68e-06 | 63 |
| GO:001095010 | Cervix | CC | positive regulation of endopeptidase activity | 48/2311 | 179/18723 | 1.12e-07 | 5.71e-06 | 48 |
| GO:003009910 | Cervix | CC | myeloid cell differentiation | 83/2311 | 381/18723 | 1.31e-07 | 6.42e-06 | 83 |
| GO:00506787 | Cervix | CC | regulation of epithelial cell proliferation | 83/2311 | 381/18723 | 1.31e-07 | 6.42e-06 | 83 |
| GO:190370610 | Cervix | CC | regulation of hemopoiesis | 80/2311 | 367/18723 | 2.14e-07 | 9.55e-06 | 80 |
| GO:000226210 | Cervix | CC | myeloid cell homeostasis | 43/2311 | 157/18723 | 2.66e-07 | 1.12e-05 | 43 |
| GO:00075689 | Cervix | CC | aging | 75/2311 | 339/18723 | 2.75e-07 | 1.13e-05 | 75 |
| GO:00091449 | Cervix | CC | purine nucleoside triphosphate metabolic process | 29/2311 | 88/18723 | 3.62e-07 | 1.45e-05 | 29 |
| Pathway ID | Tissue | Disease Stage | Description | Gene Ratio | Bg Ratio | pvalue | p.adjust | qvalue | Count |
| hsa0517120 | Cervix | CC | Coronavirus disease - COVID-19 | 111/1267 | 232/8465 | 1.82e-33 | 5.90e-31 | 3.49e-31 | 111 |
| hsa0541720 | Cervix | CC | Lipid and atherosclerosis | 65/1267 | 215/8465 | 6.47e-09 | 1.10e-07 | 6.52e-08 | 65 |
| hsa0516720 | Cervix | CC | Kaposi sarcoma-associated herpesvirus infection | 60/1267 | 194/8465 | 9.74e-09 | 1.58e-07 | 9.33e-08 | 60 |
| hsa0516318 | Cervix | CC | Human cytomegalovirus infection | 65/1267 | 225/8465 | 4.59e-08 | 6.47e-07 | 3.83e-07 | 65 |
| hsa0520516 | Cervix | CC | Proteoglycans in cancer | 60/1267 | 205/8465 | 9.13e-08 | 1.18e-06 | 7.00e-07 | 60 |
| hsa0516920 | Cervix | CC | Epstein-Barr virus infection | 57/1267 | 202/8465 | 7.30e-07 | 7.39e-06 | 4.37e-06 | 57 |
| hsa0514514 | Cervix | CC | Toxoplasmosis | 34/1267 | 112/8465 | 2.42e-05 | 1.82e-04 | 1.08e-04 | 34 |
| hsa052128 | Cervix | CC | Pancreatic cancer | 24/1267 | 76/8465 | 1.89e-04 | 1.11e-03 | 6.55e-04 | 24 |
| hsa052234 | Cervix | CC | Non-small cell lung cancer | 21/1267 | 72/8465 | 1.48e-03 | 6.32e-03 | 3.74e-03 | 21 |
| hsa046596 | Cervix | CC | Th17 cell differentiation | 28/1267 | 108/8465 | 1.99e-03 | 7.98e-03 | 4.72e-03 | 28 |
| hsa04062 | Cervix | CC | Chemokine signaling pathway | 43/1267 | 192/8465 | 3.60e-03 | 1.34e-02 | 7.91e-03 | 43 |
| hsa0406618 | Cervix | CC | HIF-1 signaling pathway | 27/1267 | 109/8465 | 4.72e-03 | 1.64e-02 | 9.72e-03 | 27 |
| hsa049336 | Cervix | CC | AGE-RAGE signaling pathway in diabetic complications | 25/1267 | 100/8465 | 5.64e-03 | 1.88e-02 | 1.11e-02 | 25 |
| hsa049172 | Cervix | CC | Prolactin signaling pathway | 18/1267 | 70/8465 | 1.29e-02 | 3.87e-02 | 2.29e-02 | 18 |
| hsa05171110 | Cervix | CC | Coronavirus disease - COVID-19 | 111/1267 | 232/8465 | 1.82e-33 | 5.90e-31 | 3.49e-31 | 111 |
| hsa05417110 | Cervix | CC | Lipid and atherosclerosis | 65/1267 | 215/8465 | 6.47e-09 | 1.10e-07 | 6.52e-08 | 65 |
| hsa05167110 | Cervix | CC | Kaposi sarcoma-associated herpesvirus infection | 60/1267 | 194/8465 | 9.74e-09 | 1.58e-07 | 9.33e-08 | 60 |
| hsa0516319 | Cervix | CC | Human cytomegalovirus infection | 65/1267 | 225/8465 | 4.59e-08 | 6.47e-07 | 3.83e-07 | 65 |
| hsa0520517 | Cervix | CC | Proteoglycans in cancer | 60/1267 | 205/8465 | 9.13e-08 | 1.18e-06 | 7.00e-07 | 60 |
| hsa05169110 | Cervix | CC | Epstein-Barr virus infection | 57/1267 | 202/8465 | 7.30e-07 | 7.39e-06 | 4.37e-06 | 57 |
| TF | Cell Type | Tissue | Disease Stage | Target Gene | RSS | Regulon Activity |
| STAT3 | TREG | Endometrium | ADJ | GNA12,STAT5B,TNFRSF9, etc. | 6.57e-02 |  |
| STAT3 | TREG | Endometrium | AEH | GNA12,STAT5B,TNFRSF9, etc. | 1.64e-01 |  |
| STAT3 | CD8TEREX | Endometrium | AEH | GNA12,STAT5B,TNFRSF9, etc. | 1.21e-01 | |
| STAT3 | TREG | Endometrium | EEC | GNA12,STAT5B,TNFRSF9, etc. | 1.34e-01 |  |
| STAT3 | CD8TEREX | Endometrium | EEC | GNA12,STAT5B,TNFRSF9, etc. | 2.12e-01 | |
| STAT3 | STM | Esophagus | ESCC | ALDH9A1,MALAT1,ETV6, etc. | 4.44e-01 |  |
| STAT3 | CD8TEXINT | Lung | ADJ | SLC2A3,CRYBG1,RAPGEF6, etc. | 1.13e-01 |  |
| STAT3 | CD8TEXP | Lung | ADJ | SLC2A3,CRYBG1,RAPGEF6, etc. | 1.21e-01 | |
| STAT3 | MDSC | Lung | Healthy | TAPBP,RSPH3,WARS, etc. | 8.71e-01 |  |
| STAT3 | MAIT | Oral cavity | NEOLP | HBP1,DPY19L1,VPS37B, etc. | 1.89e-01 |  |
| Hugo Symbol | Variant Class | Variant Classification | dbSNP RS | HGVSc | HGVSp | HGVSp Short | SWISSPROT | BIOTYPE | SIFT | PolyPhen | Tumor Sample Barcode | Tissue | Histology | Sex | Age | Stage | Therapy Types | Drugs | Outcome |
| STAT3 | SNV | Missense_Mutation | novel | c.1879N>A | p.Asp627Asn | p.D627N | P40763 | protein_coding | tolerated(0.25) | benign(0.365) | TCGA-AG-A00Y-01 | Colorectum | rectum adenocarcinoma | Male | >=65 | I/II | Unknown | Unknown | PD |
| STAT3 | SNV | Missense_Mutation | novel | c.1672N>A | p.Gly558Ser | p.G558S | P40763 | protein_coding | tolerated(1) | benign(0.391) | TCGA-AG-A032-01 | Colorectum | rectum adenocarcinoma | Male | >=65 | III/IV | Targeted Molecular therapy | bevacizumab | PD |
| STAT3 | SNV | Missense_Mutation | novel | c.2127N>T | p.Lys709Asn | p.K709N | P40763 | protein_coding | tolerated(0.18) | benign(0) | TCGA-A5-A0G2-01 | Endometrium | uterine corpus endometrioid carcinoma | Female | <65 | III/IV | Unknown | Unknown | SD |
| STAT3 | SNV | Missense_Mutation | novel | c.1886N>A | p.Ser629Asn | p.S629N | P40763 | protein_coding | tolerated(1) | benign(0.003) | TCGA-A5-A0G2-01 | Endometrium | uterine corpus endometrioid carcinoma | Female | <65 | III/IV | Unknown | Unknown | SD |
| STAT3 | SNV | Missense_Mutation | rs759053963 | c.1567N>A | p.Glu523Lys | p.E523K | P40763 | protein_coding | deleterious(0.01) | probably_damaging(0.983) | TCGA-A5-A0G2-01 | Endometrium | uterine corpus endometrioid carcinoma | Female | <65 | III/IV | Unknown | Unknown | SD |
| STAT3 | SNV | Missense_Mutation | novel | c.931N>A | p.Glu311Lys | p.E311K | P40763 | protein_coding | tolerated(0.82) | benign(0.122) | TCGA-A5-A0G2-01 | Endometrium | uterine corpus endometrioid carcinoma | Female | <65 | III/IV | Unknown | Unknown | SD |
| STAT3 | SNV | Missense_Mutation | novel | c.1387G>T | p.Val463Leu | p.V463L | P40763 | protein_coding | deleterious(0.01) | possibly_damaging(0.565) | TCGA-AJ-A3EJ-01 | Endometrium | uterine corpus endometrioid carcinoma | Female | >=65 | III/IV | Unknown | Unknown | PD |
| STAT3 | SNV | Missense_Mutation | rs140604473 | c.2288C>T | p.Ser763Leu | p.S763L | P40763 | protein_coding | deleterious_low_confidence(0.01) | benign(0.024) | TCGA-AJ-A3OK-01 | Endometrium | uterine corpus endometrioid carcinoma | Female | >=65 | I/II | Chemotherapy | carboplatin | CR |
| STAT3 | SNV | Missense_Mutation | novel | c.1756A>G | p.Met586Val | p.M586V | P40763 | protein_coding | tolerated(0.14) | benign(0) | TCGA-AJ-A8CW-01 | Endometrium | uterine corpus endometrioid carcinoma | Female | <65 | I/II | Unknown | Unknown | SD |
| STAT3 | SNV | Missense_Mutation | | c.1487N>T | p.Pro496Leu | p.P496L | P40763 | protein_coding | deleterious(0) | probably_damaging(0.999) | TCGA-AP-A051-01 | Endometrium | uterine corpus endometrioid carcinoma | Female | >=65 | I/II | Unknown | Unknown | SD |
| Entrez ID | Symbol | Category | Interaction Types | Drug Claim Name | Drug Name | PMIDs |
| 6774 | STAT3 | DRUGGABLE GENOME, CLINICALLY ACTIONABLE, NUCLEAR HORMONE RECEPTOR, TRANSCRIPTION FACTOR COMPLEX, TUMOR SUPPRESSOR, KINASE | | NICLOSAMIDE | NICLOSAMIDE | |
| 6774 | STAT3 | DRUGGABLE GENOME, CLINICALLY ACTIONABLE, NUCLEAR HORMONE RECEPTOR, TRANSCRIPTION FACTOR COMPLEX, TUMOR SUPPRESSOR, KINASE | | Gold-complexed thiosaccharide derivative 3 | | |
| 6774 | STAT3 | DRUGGABLE GENOME, CLINICALLY ACTIONABLE, NUCLEAR HORMONE RECEPTOR, TRANSCRIPTION FACTOR COMPLEX, TUMOR SUPPRESSOR, KINASE | | Platinum IV complexe 1 | | |
| 6774 | STAT3 | DRUGGABLE GENOME, CLINICALLY ACTIONABLE, NUCLEAR HORMONE RECEPTOR, TRANSCRIPTION FACTOR COMPLEX, TUMOR SUPPRESSOR, KINASE | | GNF-PF-1399 | CHEMBL578504 | |
| 6774 | STAT3 | DRUGGABLE GENOME, CLINICALLY ACTIONABLE, NUCLEAR HORMONE RECEPTOR, TRANSCRIPTION FACTOR COMPLEX, TUMOR SUPPRESSOR, KINASE | | Salicylic acid derivative 3 | | |
| 6774 | STAT3 | DRUGGABLE GENOME, CLINICALLY ACTIONABLE, NUCLEAR HORMONE RECEPTOR, TRANSCRIPTION FACTOR COMPLEX, TUMOR SUPPRESSOR, KINASE | | Peptide analog 7 | | |
| 6774 | STAT3 | DRUGGABLE GENOME, CLINICALLY ACTIONABLE, NUCLEAR HORMONE RECEPTOR, TRANSCRIPTION FACTOR COMPLEX, TUMOR SUPPRESSOR, KINASE | | CELECOXIB | CELECOXIB | 21678971 |
| 6774 | STAT3 | DRUGGABLE GENOME, CLINICALLY ACTIONABLE, NUCLEAR HORMONE RECEPTOR, TRANSCRIPTION FACTOR COMPLEX, TUMOR SUPPRESSOR, KINASE | | TAK-114 | | |
| 6774 | STAT3 | DRUGGABLE GENOME, CLINICALLY ACTIONABLE, NUCLEAR HORMONE RECEPTOR, TRANSCRIPTION FACTOR COMPLEX, TUMOR SUPPRESSOR, KINASE | | Salicylic acid derivative 1 | | |
| 6774 | STAT3 | DRUGGABLE GENOME, CLINICALLY ACTIONABLE, NUCLEAR HORMONE RECEPTOR, TRANSCRIPTION FACTOR COMPLEX, TUMOR SUPPRESSOR, KINASE | | AZD-1480 | AZD-1480 | 21138246,24978112 |


