
|
|||||
|
 | |
| |
| |
| |
| |
| |
|
Gene: RNF149 |
Gene summary for RNF149 |
| Gene information | Species | Human | Gene symbol | RNF149 | Gene ID | 284996 |
| Gene name | ring finger protein 149 | |
| Gene Alias | DNAPTP2 | |
| Cytomap | 2q11.2 | |
| Gene Type | protein-coding | GO ID | GO:0000165 | UniProtAcc | Q8NC42 |
Top |
Malignant transformation analysis |
| Identification of the aberrant gene expression in precancerous and cancerous lesions by comparing the gene expression of stem-like cells in diseased tissues with normal stem cells |
| Entrez ID | Symbol | Replicates | Species | Organ | Tissue | Adj P-value | Log2FC | Malignancy |
| 284996 | RNF149 | HTA11_347_2000001011 | Human | Colorectum | AD | 1.61e-06 | 4.46e-01 | -0.1954 |
| 284996 | RNF149 | HTA11_411_2000001011 | Human | Colorectum | SER | 7.39e-04 | 8.45e-01 | -0.2602 |
| 284996 | RNF149 | HTA11_1391_2000001011 | Human | Colorectum | AD | 1.89e-03 | 4.57e-01 | -0.059 |
| 284996 | RNF149 | HTA11_99999970781_79442 | Human | Colorectum | MSS | 1.45e-04 | 4.55e-01 | 0.294 |
| 284996 | RNF149 | HTA11_99999971662_82457 | Human | Colorectum | MSS | 1.56e-03 | 4.92e-01 | 0.3859 |
| 284996 | RNF149 | A015-C-203 | Human | Colorectum | FAP | 8.98e-21 | -3.48e-01 | -0.1294 |
| 284996 | RNF149 | A015-C-204 | Human | Colorectum | FAP | 2.66e-04 | -3.00e-01 | -0.0228 |
| 284996 | RNF149 | A002-C-201 | Human | Colorectum | FAP | 1.83e-08 | -2.23e-01 | 0.0324 |
| 284996 | RNF149 | A001-C-108 | Human | Colorectum | FAP | 8.02e-13 | -2.52e-01 | -0.0272 |
| 284996 | RNF149 | A002-C-205 | Human | Colorectum | FAP | 1.04e-13 | -3.06e-01 | -0.1236 |
| 284996 | RNF149 | A001-C-104 | Human | Colorectum | FAP | 3.02e-02 | -1.62e-01 | 0.0184 |
| 284996 | RNF149 | A015-C-006 | Human | Colorectum | FAP | 2.00e-11 | -3.19e-02 | -0.0994 |
| 284996 | RNF149 | A015-C-106 | Human | Colorectum | FAP | 2.51e-06 | -2.09e-01 | -0.0511 |
| 284996 | RNF149 | A002-C-114 | Human | Colorectum | FAP | 2.16e-10 | -2.75e-01 | -0.1561 |
| 284996 | RNF149 | A015-C-104 | Human | Colorectum | FAP | 8.31e-25 | -1.47e-01 | -0.1899 |
| 284996 | RNF149 | A001-C-014 | Human | Colorectum | FAP | 2.23e-10 | -1.74e-01 | 0.0135 |
| 284996 | RNF149 | A002-C-016 | Human | Colorectum | FAP | 1.67e-15 | -2.98e-01 | 0.0521 |
| 284996 | RNF149 | A015-C-002 | Human | Colorectum | FAP | 5.40e-07 | -2.87e-01 | -0.0763 |
| 284996 | RNF149 | A001-C-203 | Human | Colorectum | FAP | 5.87e-09 | -2.24e-01 | -0.0481 |
| 284996 | RNF149 | A002-C-116 | Human | Colorectum | FAP | 3.84e-26 | -2.71e-01 | -0.0452 |
| Page: 1 2 3 4 5 6 7 8 |
| Tissue | Expression Dynamics | Abbreviation |
| Colorectum (GSE201348) |  | FAP: Familial adenomatous polyposis |
| CRC: Colorectal cancer | ||
| Colorectum (HTA11) |  | AD: Adenomas |
| SER: Sessile serrated lesions | ||
| MSI-H: Microsatellite-high colorectal cancer | ||
| MSS: Microsatellite stable colorectal cancer | ||
| Esophagus | 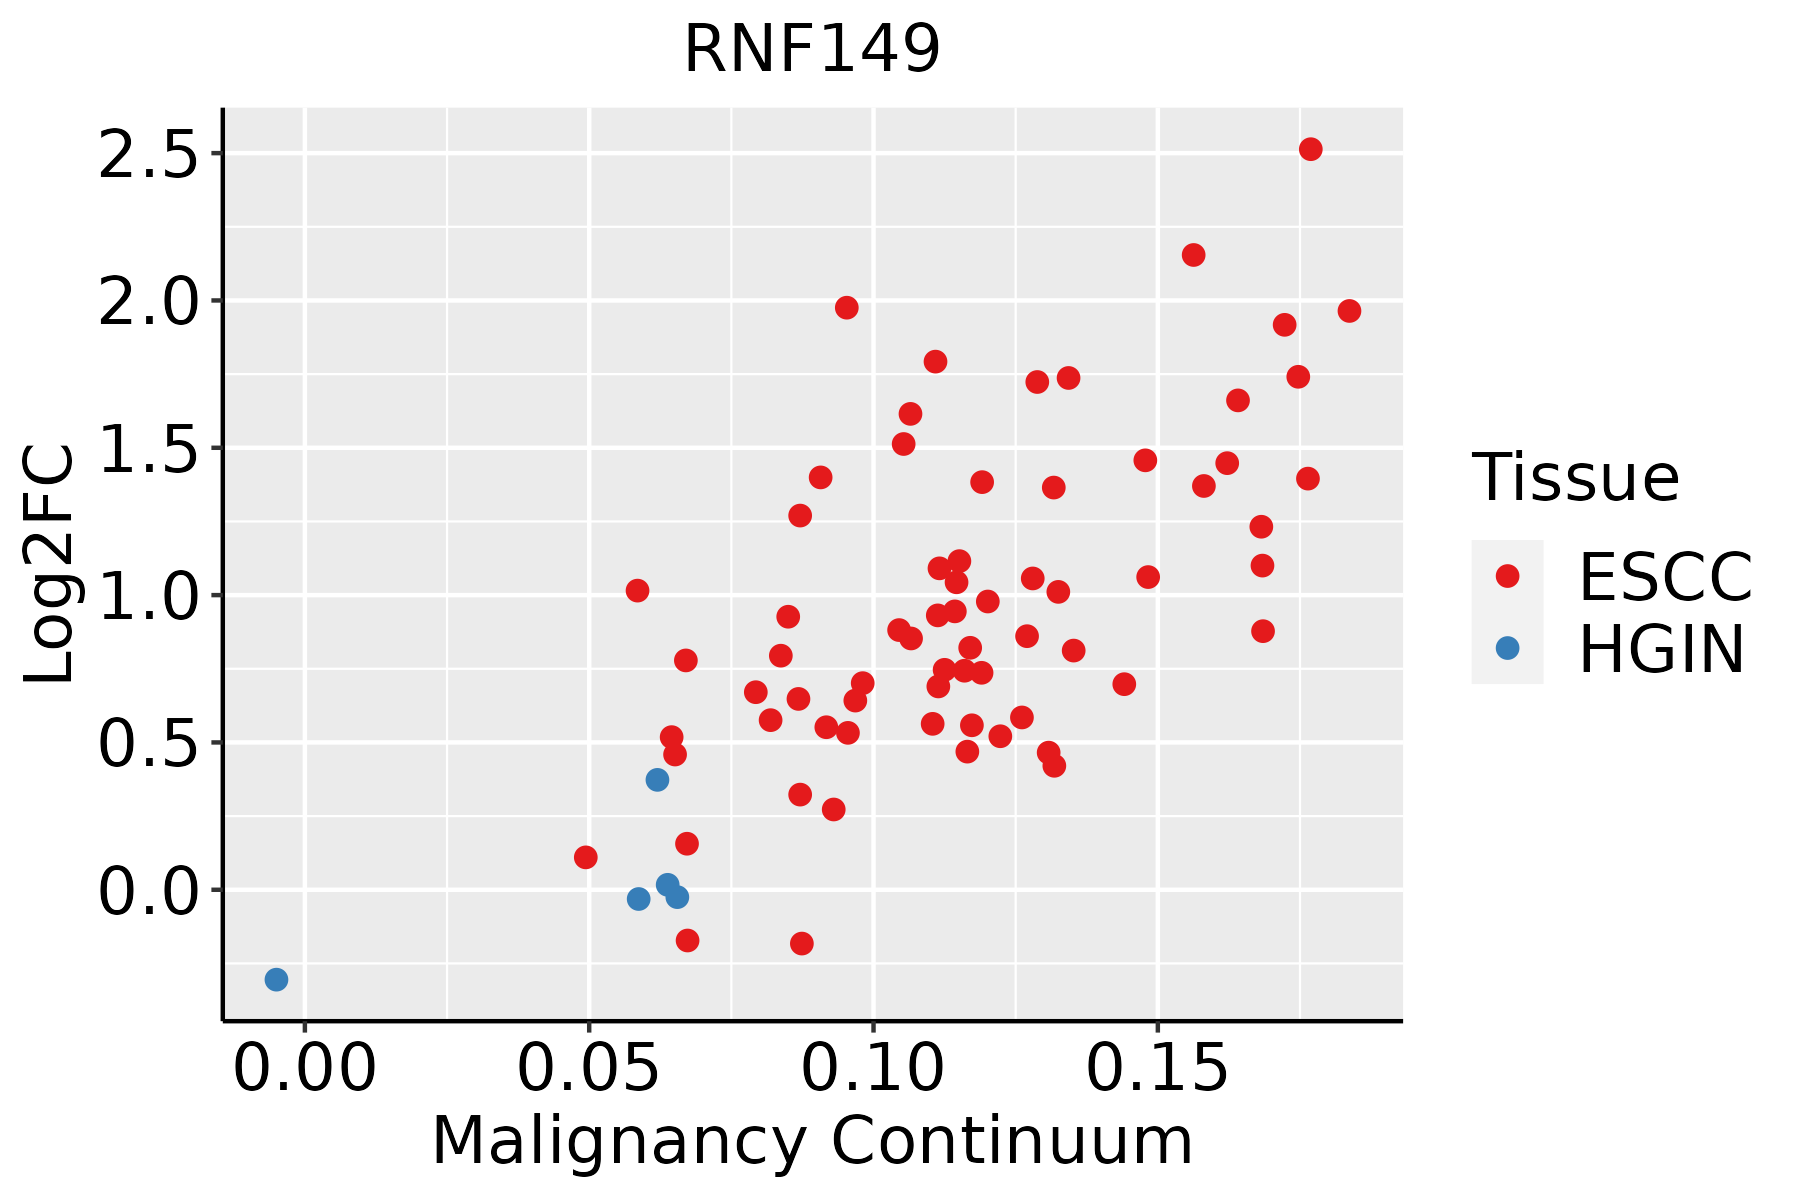 | ESCC: Esophageal squamous cell carcinoma |
| HGIN: High-grade intraepithelial neoplasias | ||
| LGIN: Low-grade intraepithelial neoplasias | ||
| Liver | 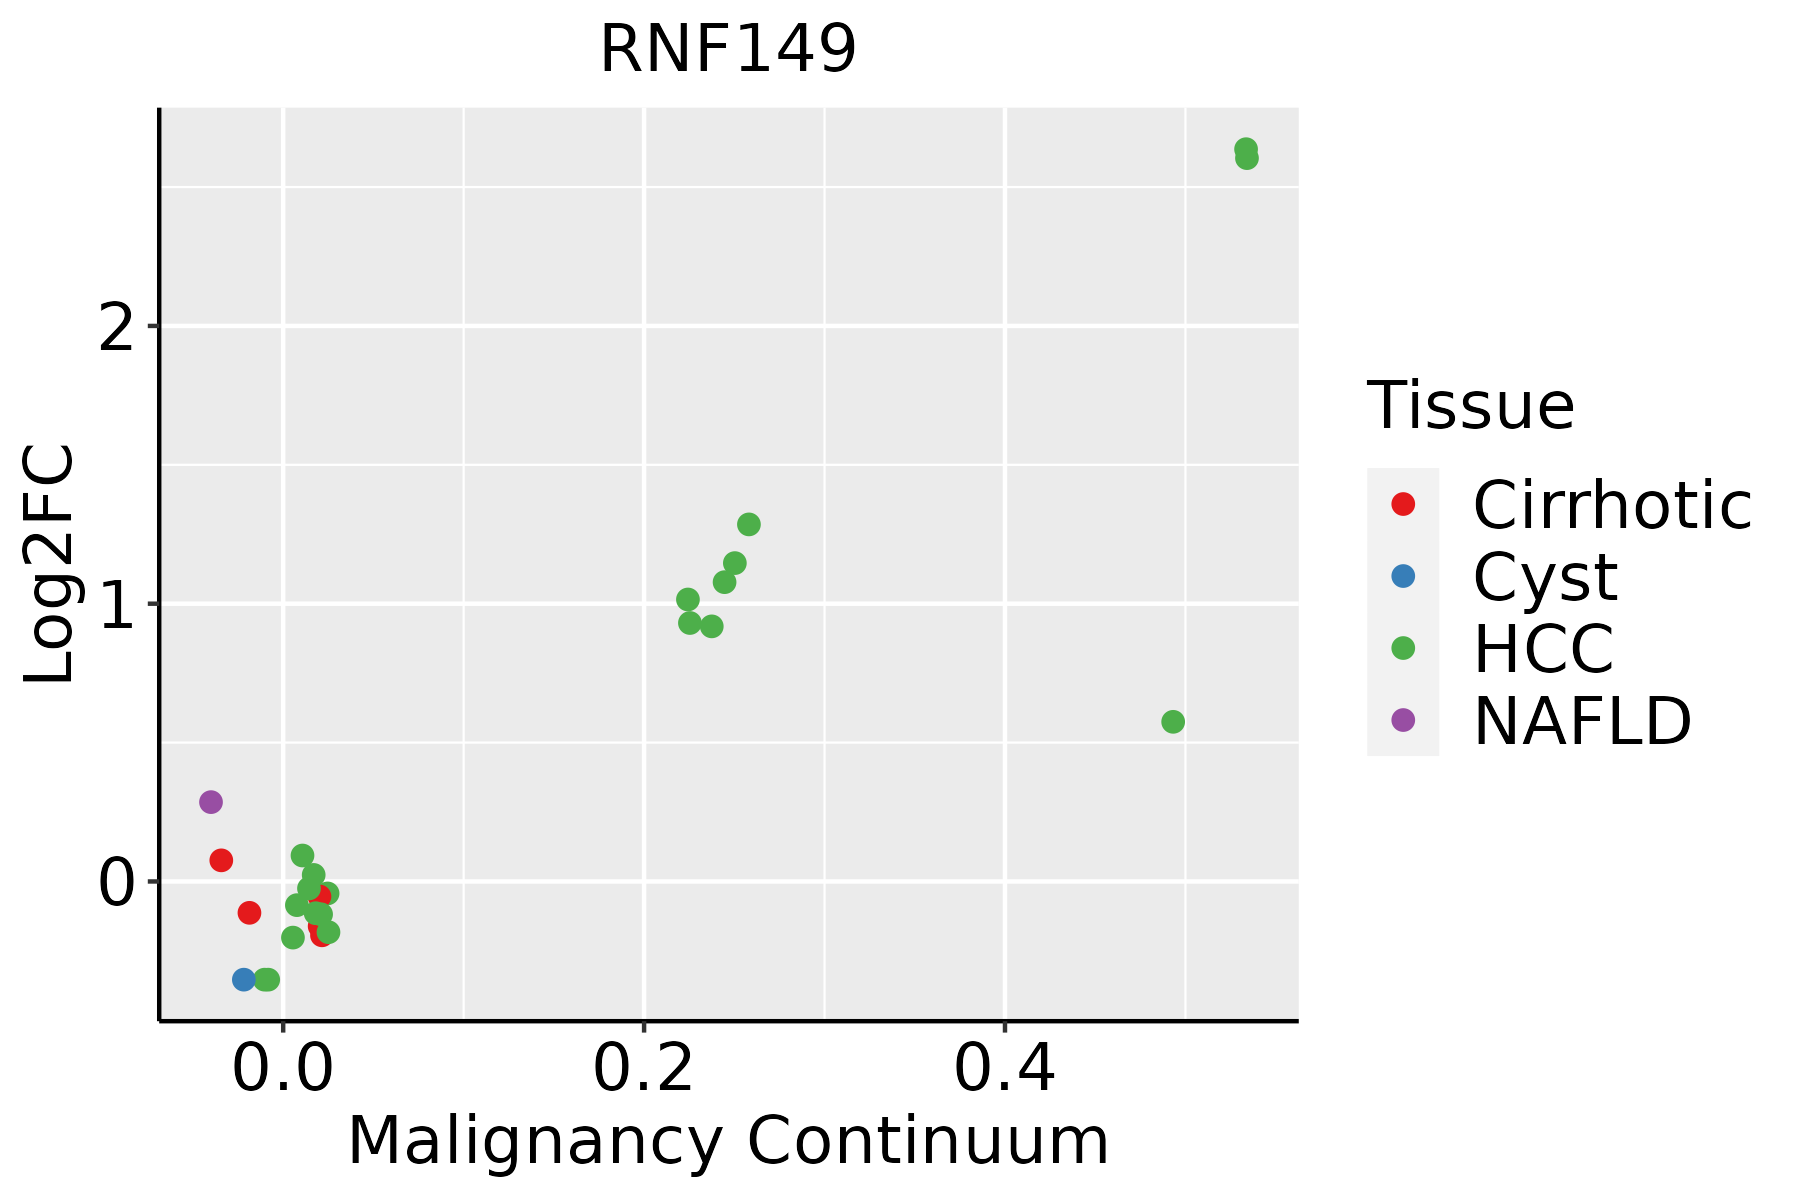 | HCC: Hepatocellular carcinoma |
| NAFLD: Non-alcoholic fatty liver disease | ||
| Lung |  | AAH: Atypical adenomatous hyperplasia |
| AIS: Adenocarcinoma in situ | ||
| IAC: Invasive lung adenocarcinoma | ||
| MIA: Minimally invasive adenocarcinoma | ||
| Oral Cavity | 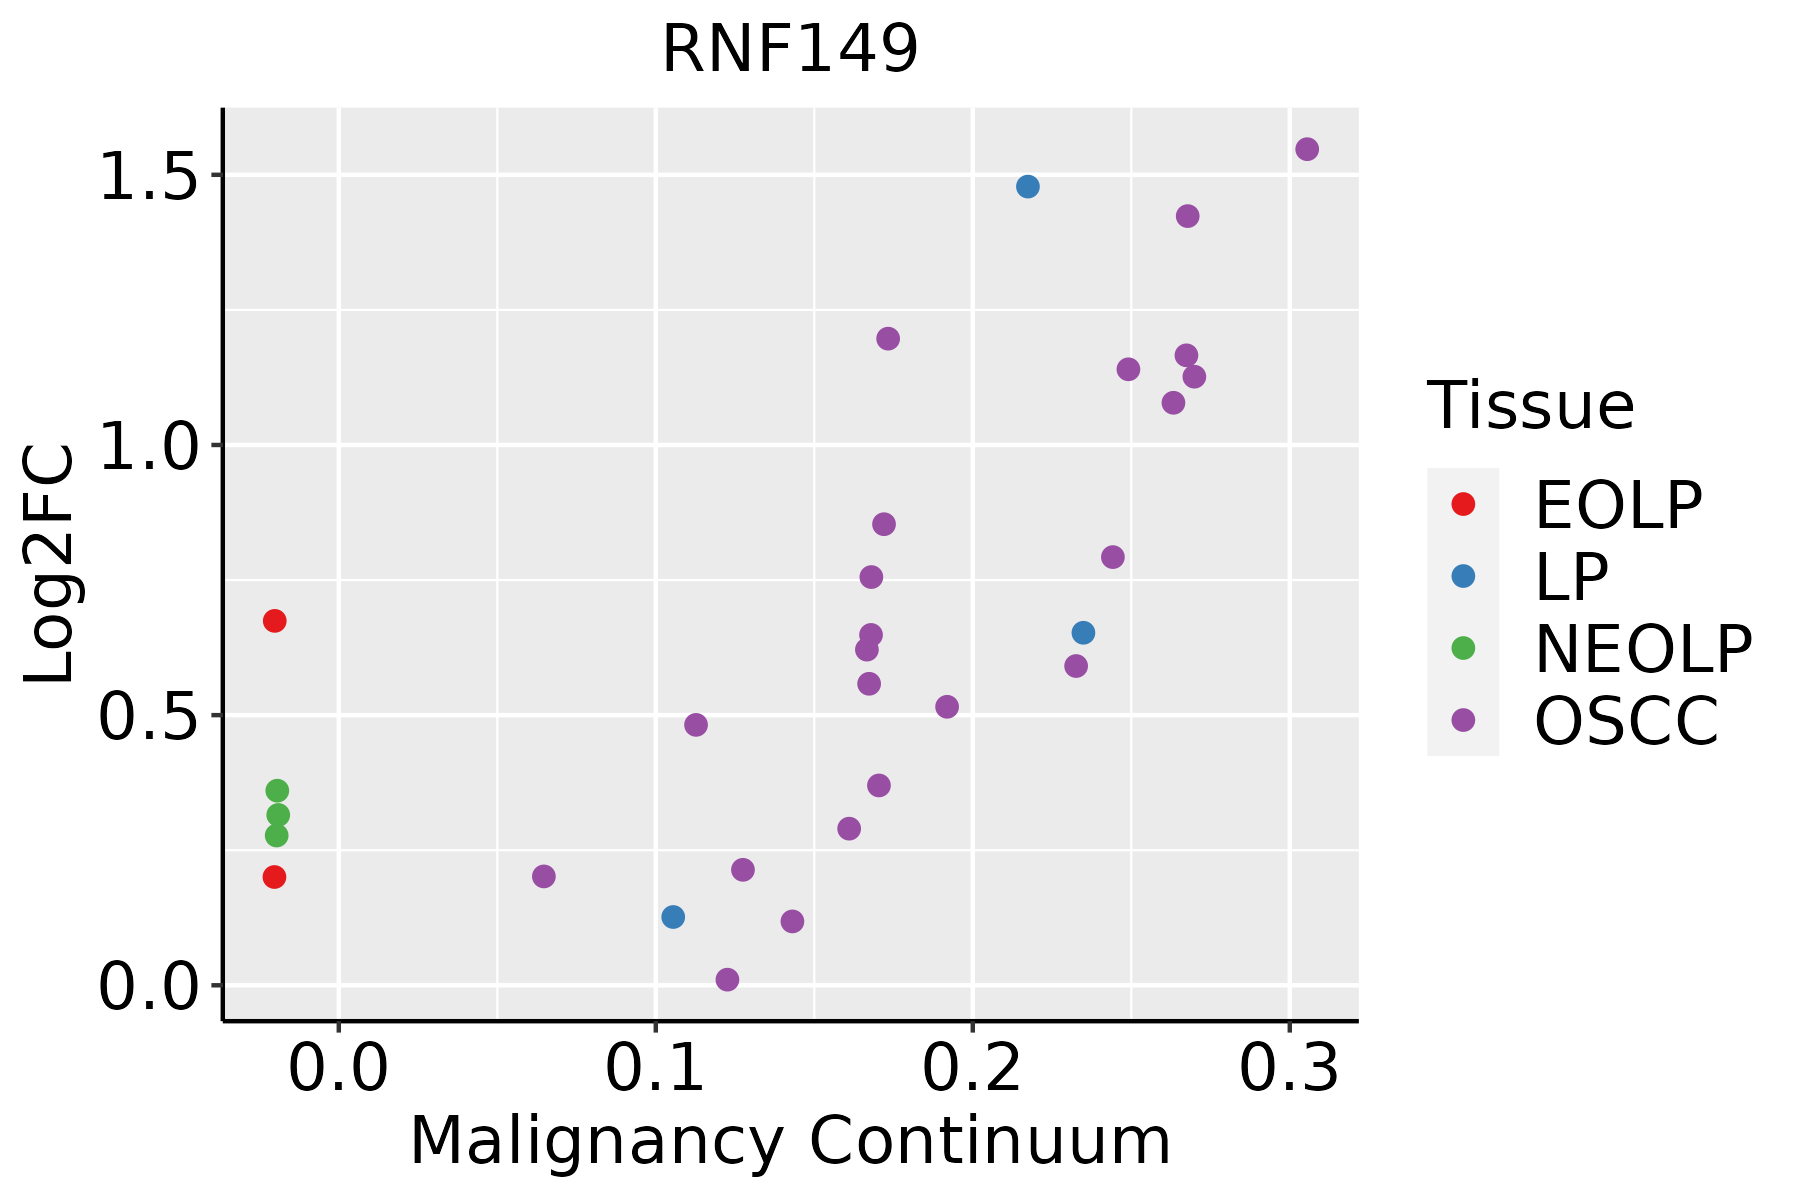 | EOLP: Erosive Oral lichen planus |
| LP: leukoplakia | ||
| NEOLP: Non-erosive oral lichen planus | ||
| OSCC: Oral squamous cell carcinoma | ||
| Skin | 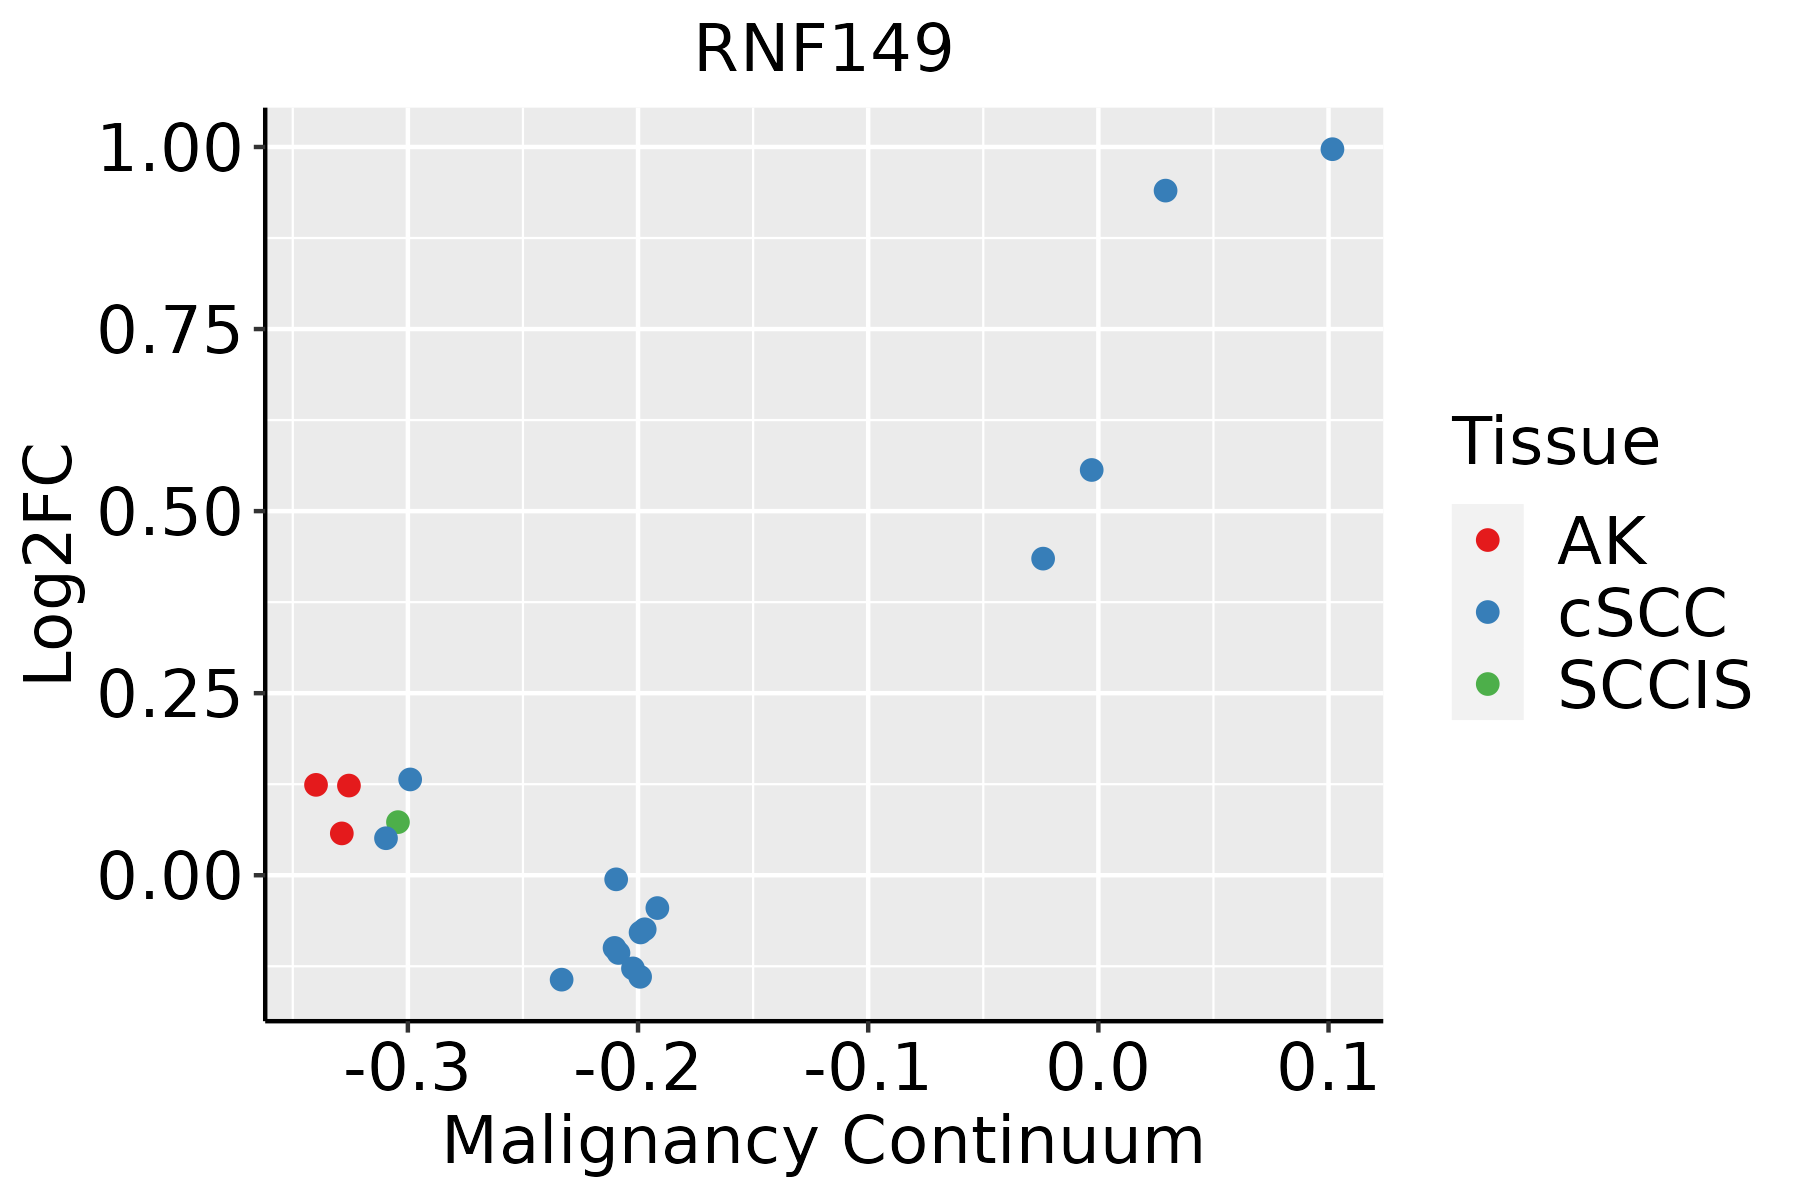 | AK: Actinic keratosis |
| cSCC: Cutaneous squamous cell carcinoma | ||
| SCCIS:squamous cell carcinoma in situ | ||
| Thyroid |  | ATC: Anaplastic thyroid cancer |
| HT: Hashimoto's thyroiditis | ||
| PTC: Papillary thyroid cancer |
| ∗log2FC in expression of this searched gene in stem-like cells from each diseased tissue sample relative to stem-like cells in normal samples in each tissue plotted against the malignancy continuum. Samples are colored based on if they are from different disease stage. |
Top |
Malignant transformation related pathway analysis |
| Find out the enriched GO biological processes and KEGG pathways involved in transition from healthy to precancer to cancer |
| Tissue | Disease Stage | Enriched GO biological Processes |
| Colorectum | AD |  |
| Colorectum | SER |  |
| Colorectum | MSS |  |
| Colorectum | MSI-H |  |
| Colorectum | FAP |  |
| ∗Top 15 enriched GO BP terms are showed in the bar plot of each disease state in each tissue. Each row represents a significant GO biological process which is colored according to the -log10(p.adjust). |
| Page: 1 2 3 4 5 6 7 8 9 |
| GO ID | Tissue | Disease Stage | Description | Gene Ratio | Bg Ratio | pvalue | p.adjust | Count |
| GO:0031647 | Colorectum | AD | regulation of protein stability | 108/3918 | 298/18723 | 6.33e-10 | 5.08e-08 | 108 |
| GO:0009410 | Colorectum | AD | response to xenobiotic stimulus | 128/3918 | 462/18723 | 2.69e-04 | 3.31e-03 | 128 |
| GO:0043409 | Colorectum | AD | negative regulation of MAPK cascade | 57/3918 | 180/18723 | 4.61e-04 | 5.14e-03 | 57 |
| GO:00316471 | Colorectum | SER | regulation of protein stability | 86/2897 | 298/18723 | 2.56e-09 | 2.42e-07 | 86 |
| GO:00434091 | Colorectum | SER | negative regulation of MAPK cascade | 45/2897 | 180/18723 | 5.81e-04 | 7.98e-03 | 45 |
| GO:00316472 | Colorectum | MSS | regulation of protein stability | 103/3467 | 298/18723 | 2.52e-11 | 3.49e-09 | 103 |
| GO:00434092 | Colorectum | MSS | negative regulation of MAPK cascade | 50/3467 | 180/18723 | 1.45e-03 | 1.35e-02 | 50 |
| GO:00094101 | Colorectum | MSS | response to xenobiotic stimulus | 110/3467 | 462/18723 | 2.36e-03 | 1.92e-02 | 110 |
| GO:00316474 | Colorectum | FAP | regulation of protein stability | 70/2622 | 298/18723 | 6.60e-06 | 2.04e-04 | 70 |
| GO:00434094 | Colorectum | FAP | negative regulation of MAPK cascade | 42/2622 | 180/18723 | 4.97e-04 | 5.72e-03 | 42 |
| GO:00094102 | Colorectum | FAP | response to xenobiotic stimulus | 87/2622 | 462/18723 | 2.15e-03 | 1.77e-02 | 87 |
| GO:00316475 | Colorectum | CRC | regulation of protein stability | 58/2078 | 298/18723 | 1.38e-05 | 4.37e-04 | 58 |
| GO:00434095 | Colorectum | CRC | negative regulation of MAPK cascade | 37/2078 | 180/18723 | 1.51e-04 | 2.74e-03 | 37 |
| GO:00094103 | Colorectum | CRC | response to xenobiotic stimulus | 69/2078 | 462/18723 | 6.34e-03 | 4.61e-02 | 69 |
| GO:003164727 | Esophagus | HGIN | regulation of protein stability | 96/2587 | 298/18723 | 2.21e-16 | 5.76e-14 | 96 |
| GO:004340919 | Esophagus | HGIN | negative regulation of MAPK cascade | 38/2587 | 180/18723 | 4.58e-03 | 3.96e-02 | 38 |
| GO:0031647111 | Esophagus | ESCC | regulation of protein stability | 223/8552 | 298/18723 | 5.76e-25 | 1.52e-22 | 223 |
| GO:000941020 | Esophagus | ESCC | response to xenobiotic stimulus | 253/8552 | 462/18723 | 4.55e-05 | 3.58e-04 | 253 |
| GO:0043409110 | Esophagus | ESCC | negative regulation of MAPK cascade | 105/8552 | 180/18723 | 4.13e-04 | 2.35e-03 | 105 |
| GO:00094107 | Liver | NAFLD | response to xenobiotic stimulus | 88/1882 | 462/18723 | 2.53e-09 | 4.11e-07 | 88 |
| Page: 1 2 3 |
| Pathway ID | Tissue | Disease Stage | Description | Gene Ratio | Bg Ratio | pvalue | p.adjust | qvalue | Count |
| Page: 1 |
Top |
Cell-cell communication analysis |
| Identification of potential cell-cell interactions between two cell types and their ligand-receptor pairs for different disease states |
| Ligand | Receptor | LRpair | Pathway | Tissue | Disease Stage |
| Page: 1 |
Top |
Single-cell gene regulatory network inference analysis |
| Find out the significant the regulons (TFs) and the target genes of each regulon across cell types for different disease states |
| TF | Cell Type | Tissue | Disease Stage | Target Gene | RSS | Regulon Activity |
| ∗The dot plots of a searched regulon are shown for all cell subpopulations in each disease state of each tissue based on the regulon specific score inferred using pySCENIC and by calculating the average expression. |
| Page: 1 |
Top |
Somatic mutation of malignant transformation related genes |
| Annotation of somatic variants for genes involved in malignant transformation |
| Hugo Symbol | Variant Class | Variant Classification | dbSNP RS | HGVSc | HGVSp | HGVSp Short | SWISSPROT | BIOTYPE | SIFT | PolyPhen | Tumor Sample Barcode | Tissue | Histology | Sex | Age | Stage | Therapy Types | Drugs | Outcome |
| RNF149 | SNV | Missense_Mutation | c.1195N>T | p.Ile399Phe | p.I399F | Q8NC42 | protein_coding | deleterious_low_confidence(0.01) | benign(0.012) | TCGA-BR-4369-01 | Stomach | stomach adenocarcinoma | Male | >=65 | I/II | Unknown | Unknown | SD | |
| RNF149 | SNV | Missense_Mutation | novel | c.151N>G | p.Thr51Ala | p.T51A | Q8NC42 | protein_coding | tolerated(0.19) | benign(0.024) | TCGA-VQ-A8PP-01 | Stomach | stomach adenocarcinoma | Male | >=65 | III/IV | Chemotherapy | fluorouracil | PD |
| Page: 1 2 3 |
Top |
Related drugs of malignant transformation related genes |
| Identification of chemicals and drugs interact with genes involved in malignant transfromation |
| (DGIdb 4.0) |
| Entrez ID | Symbol | Category | Interaction Types | Drug Claim Name | Drug Name | PMIDs |
| Page: 1 |

Copyright 2023-Present -The University of Texas Health Science Center at Houston |