
|
|||||
|
 | |
| |
| |
| |
| |
| |
|
Gene: REEP4 |
Gene summary for REEP4 |
| Gene information | Species | Human | Gene symbol | REEP4 | Gene ID | 80346 |
| Gene name | receptor accessory protein 4 | |
| Gene Alias | C8orf20 | |
| Cytomap | 8p21.3 | |
| Gene Type | protein-coding | GO ID | GO:0000278 | UniProtAcc | E5RGS2 |
Top |
Malignant transformation analysis |
| Identification of the aberrant gene expression in precancerous and cancerous lesions by comparing the gene expression of stem-like cells in diseased tissues with normal stem cells |
| Entrez ID | Symbol | Replicates | Species | Organ | Tissue | Adj P-value | Log2FC | Malignancy |
| 80346 | REEP4 | HTA11_1938_2000001011 | Human | Colorectum | AD | 7.47e-04 | 2.32e-01 | -0.0811 |
| 80346 | REEP4 | HTA11_347_2000001011 | Human | Colorectum | AD | 7.89e-06 | 3.25e-01 | -0.1954 |
| 80346 | REEP4 | HTA11_411_2000001011 | Human | Colorectum | SER | 2.97e-05 | 6.91e-01 | -0.2602 |
| 80346 | REEP4 | HTA11_3361_2000001011 | Human | Colorectum | AD | 4.01e-03 | 2.23e-01 | -0.1207 |
| 80346 | REEP4 | HTA11_696_2000001011 | Human | Colorectum | AD | 7.70e-10 | 3.40e-01 | -0.1464 |
| 80346 | REEP4 | HTA11_866_2000001011 | Human | Colorectum | AD | 1.12e-08 | 1.85e-01 | -0.1001 |
| 80346 | REEP4 | HTA11_5212_2000001011 | Human | Colorectum | AD | 8.80e-04 | 2.87e-01 | -0.2061 |
| 80346 | REEP4 | HTA11_7663_2000001011 | Human | Colorectum | SER | 7.65e-03 | 2.54e-01 | 0.0131 |
| 80346 | REEP4 | HTA11_7696_3000711011 | Human | Colorectum | AD | 6.11e-05 | 1.72e-01 | 0.0674 |
| 80346 | REEP4 | LZE4T | Human | Esophagus | ESCC | 3.64e-21 | 7.32e-01 | 0.0811 |
| 80346 | REEP4 | LZE8T | Human | Esophagus | ESCC | 2.46e-02 | 9.90e-02 | 0.067 |
| 80346 | REEP4 | LZE20T | Human | Esophagus | ESCC | 1.22e-03 | 2.46e-01 | 0.0662 |
| 80346 | REEP4 | LZE21D1 | Human | Esophagus | HGIN | 2.23e-02 | 4.10e-01 | 0.0632 |
| 80346 | REEP4 | LZE22D1 | Human | Esophagus | HGIN | 9.58e-03 | 2.98e-01 | 0.0595 |
| 80346 | REEP4 | LZE22T | Human | Esophagus | ESCC | 3.08e-05 | 4.69e-01 | 0.068 |
| 80346 | REEP4 | LZE24T | Human | Esophagus | ESCC | 2.54e-26 | 7.47e-01 | 0.0596 |
| 80346 | REEP4 | LZE21T | Human | Esophagus | ESCC | 8.06e-07 | 6.80e-01 | 0.0655 |
| 80346 | REEP4 | P1T-E | Human | Esophagus | ESCC | 2.15e-07 | 6.24e-01 | 0.0875 |
| 80346 | REEP4 | P2T-E | Human | Esophagus | ESCC | 1.93e-26 | 5.98e-01 | 0.1177 |
| 80346 | REEP4 | P4T-E | Human | Esophagus | ESCC | 1.09e-44 | 1.25e+00 | 0.1323 |
| Page: 1 2 3 4 5 6 |
| Tissue | Expression Dynamics | Abbreviation |
| Colorectum (GSE201348) |  | FAP: Familial adenomatous polyposis |
| CRC: Colorectal cancer | ||
| Colorectum (HTA11) |  | AD: Adenomas |
| SER: Sessile serrated lesions | ||
| MSI-H: Microsatellite-high colorectal cancer | ||
| MSS: Microsatellite stable colorectal cancer | ||
| Esophagus | 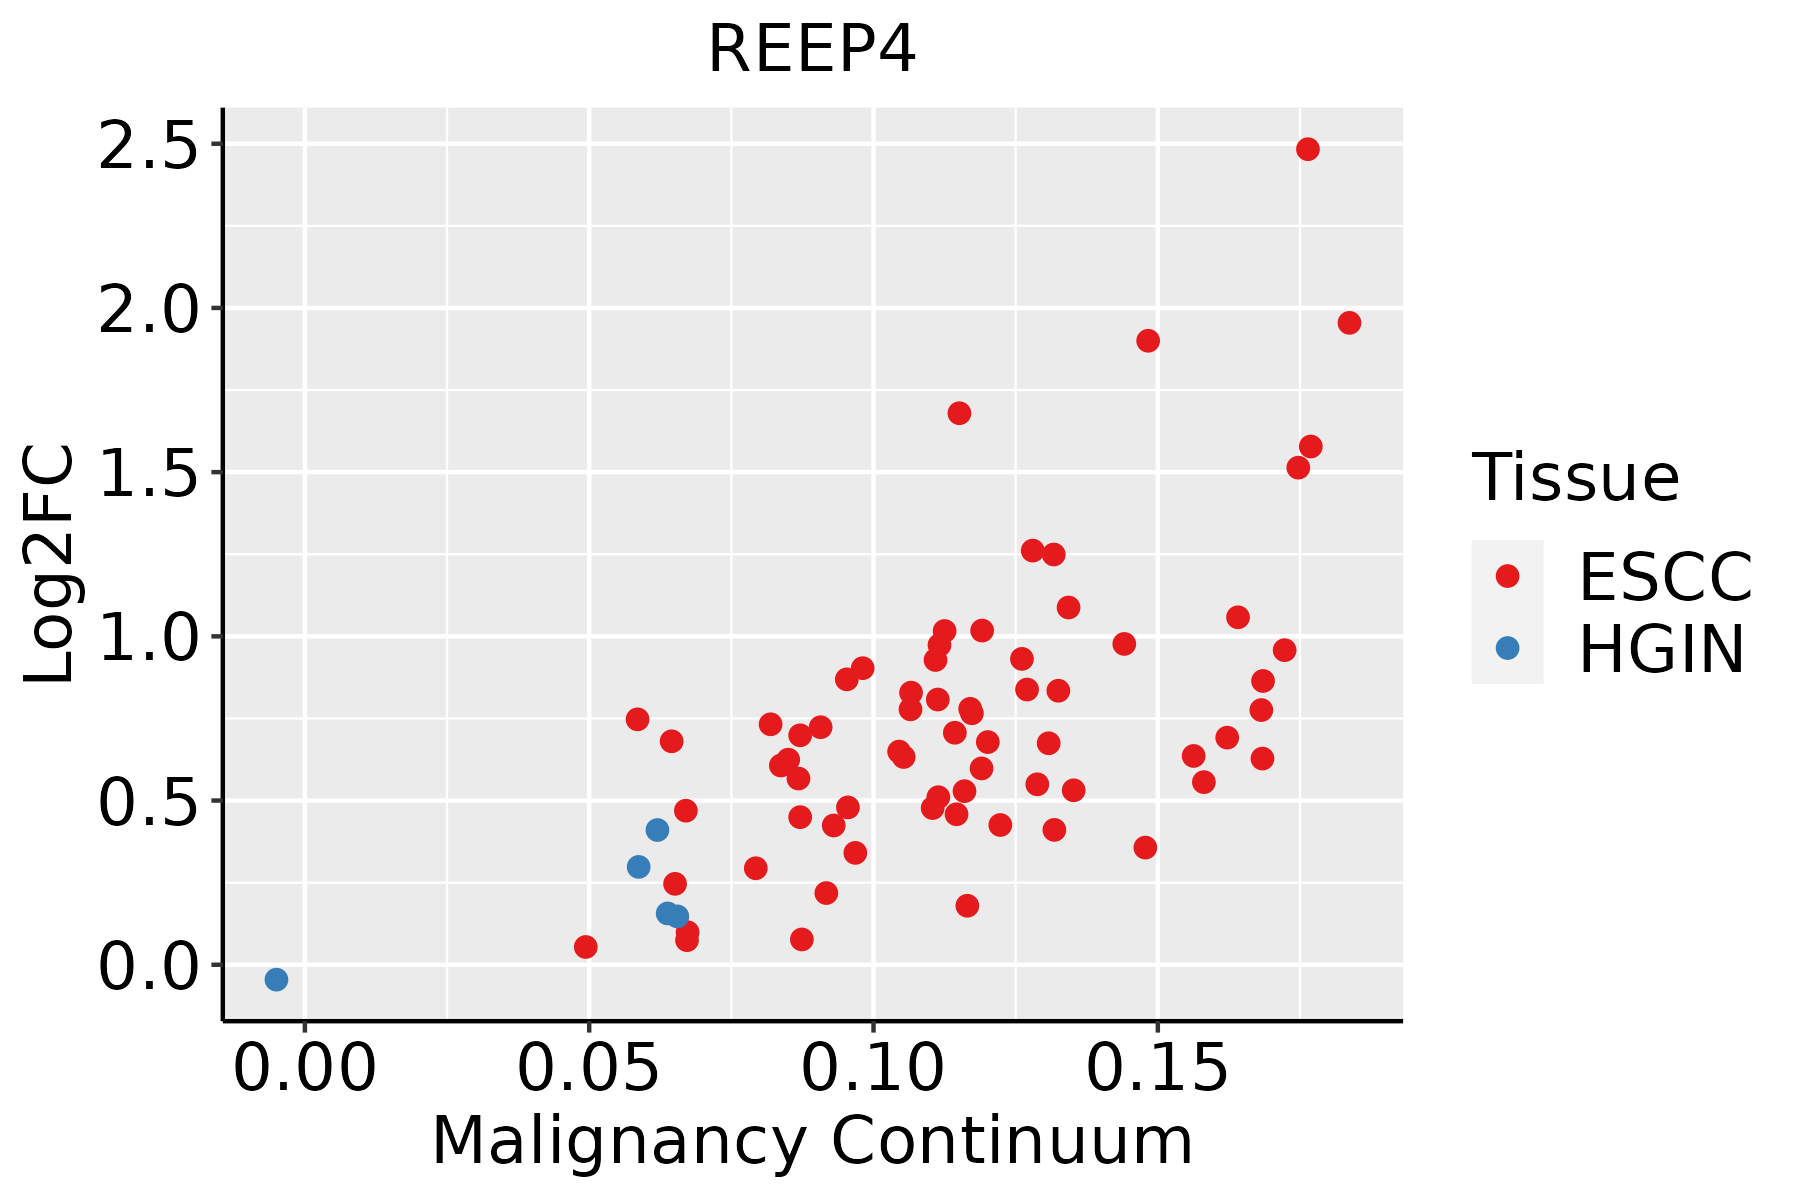 | ESCC: Esophageal squamous cell carcinoma |
| HGIN: High-grade intraepithelial neoplasias | ||
| LGIN: Low-grade intraepithelial neoplasias | ||
| Oral Cavity | 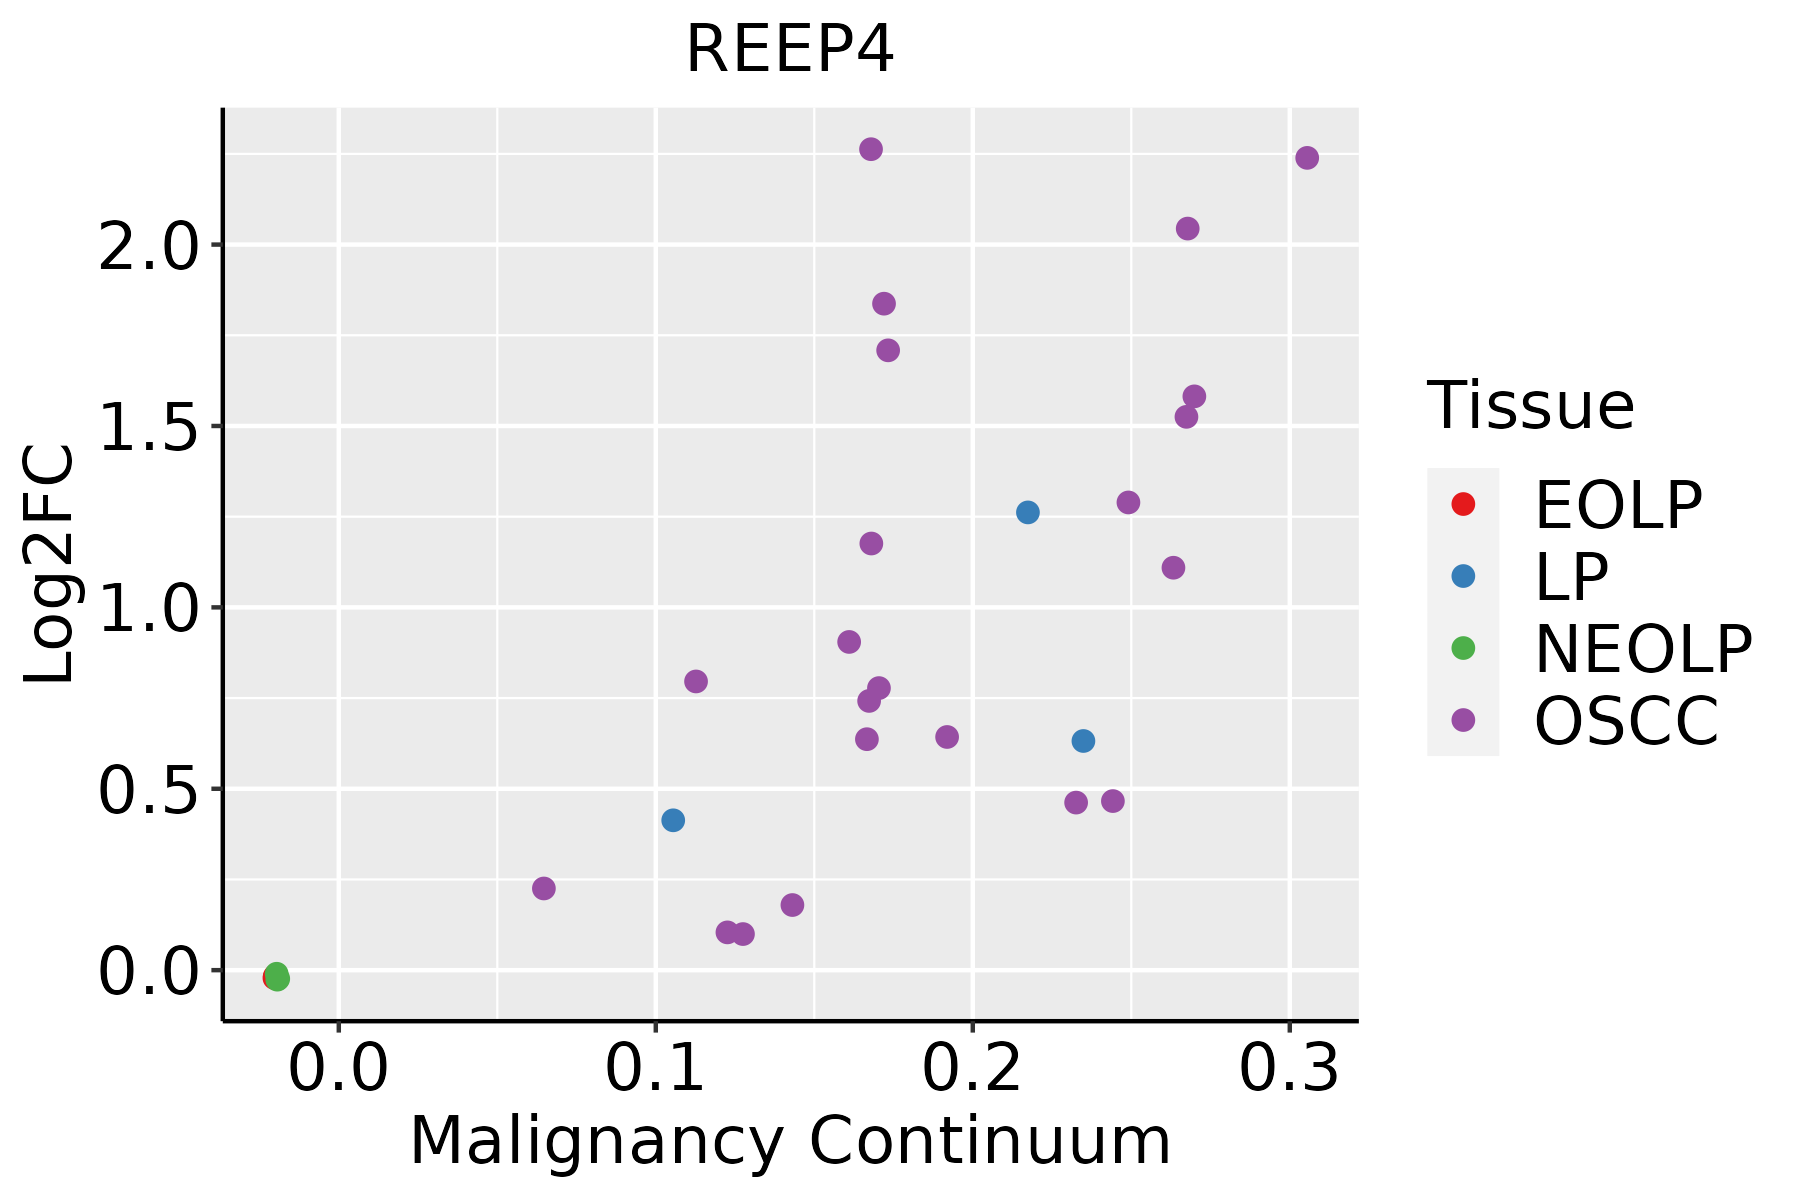 | EOLP: Erosive Oral lichen planus |
| LP: leukoplakia | ||
| NEOLP: Non-erosive oral lichen planus | ||
| OSCC: Oral squamous cell carcinoma | ||
| Skin | 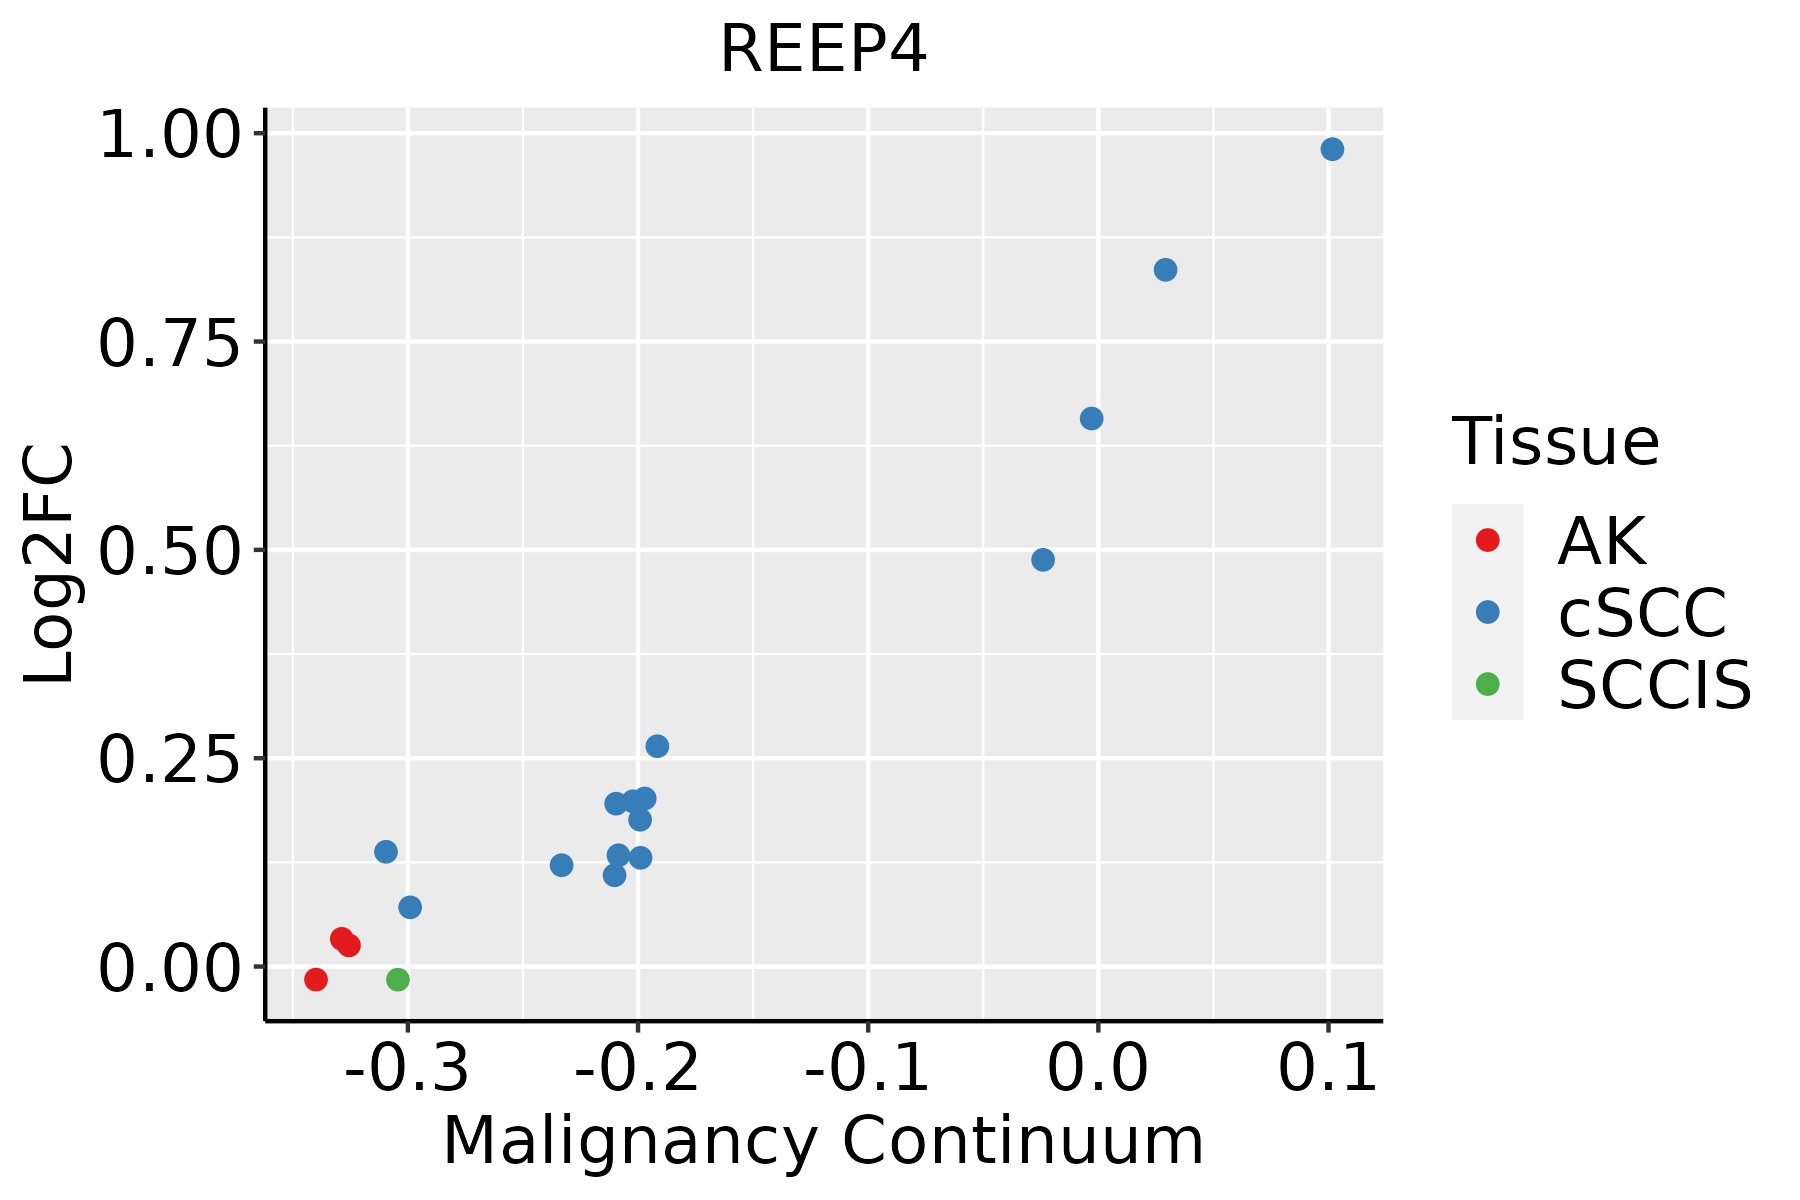 | AK: Actinic keratosis |
| cSCC: Cutaneous squamous cell carcinoma | ||
| SCCIS:squamous cell carcinoma in situ |
| ∗log2FC in expression of this searched gene in stem-like cells from each diseased tissue sample relative to stem-like cells in normal samples in each tissue plotted against the malignancy continuum. Samples are colored based on if they are from different disease stage. |
Top |
Malignant transformation related pathway analysis |
| Find out the enriched GO biological processes and KEGG pathways involved in transition from healthy to precancer to cancer |
| Tissue | Disease Stage | Enriched GO biological Processes |
| Colorectum | AD |  |
| Colorectum | SER |  |
| Colorectum | MSS |  |
| Colorectum | MSI-H |  |
| Colorectum | FAP |  |
| ∗Top 15 enriched GO BP terms are showed in the bar plot of each disease state in each tissue. Each row represents a significant GO biological process which is colored according to the -log10(p.adjust). |
| Page: 1 2 3 4 5 6 7 8 9 |
| GO ID | Tissue | Disease Stage | Description | Gene Ratio | Bg Ratio | pvalue | p.adjust | Count |
| GO:0071709 | Colorectum | AD | membrane assembly | 22/3918 | 50/18723 | 2.00e-04 | 2.66e-03 | 22 |
| GO:0044091 | Colorectum | AD | membrane biogenesis | 22/3918 | 55/18723 | 9.88e-04 | 9.28e-03 | 22 |
| GO:0007029 | Colorectum | AD | endoplasmic reticulum organization | 31/3918 | 87/18723 | 1.08e-03 | 1.00e-02 | 31 |
| GO:0071786 | Colorectum | AD | endoplasmic reticulum tubular network organization | 9/3918 | 18/18723 | 5.82e-03 | 3.67e-02 | 9 |
| GO:0140014 | Colorectum | AD | mitotic nuclear division | 78/3918 | 287/18723 | 6.48e-03 | 4.05e-02 | 78 |
| GO:00717091 | Colorectum | SER | membrane assembly | 20/2897 | 50/18723 | 2.45e-05 | 6.84e-04 | 20 |
| GO:00440911 | Colorectum | SER | membrane biogenesis | 20/2897 | 55/18723 | 1.21e-04 | 2.49e-03 | 20 |
| GO:00070291 | Colorectum | SER | endoplasmic reticulum organization | 23/2897 | 87/18723 | 5.77e-03 | 4.23e-02 | 23 |
| GO:00069975 | Esophagus | HGIN | nucleus organization | 34/2587 | 133/18723 | 2.20e-04 | 4.00e-03 | 34 |
| GO:01400146 | Esophagus | HGIN | mitotic nuclear division | 61/2587 | 287/18723 | 3.38e-04 | 5.55e-03 | 61 |
| GO:00717634 | Esophagus | HGIN | nuclear membrane organization | 12/2587 | 33/18723 | 9.97e-04 | 1.25e-02 | 12 |
| GO:00314683 | Esophagus | HGIN | nuclear envelope reassembly | 7/2587 | 14/18723 | 1.34e-03 | 1.57e-02 | 7 |
| GO:00070295 | Esophagus | HGIN | endoplasmic reticulum organization | 22/2587 | 87/18723 | 3.07e-03 | 2.90e-02 | 22 |
| GO:00069983 | Esophagus | HGIN | nuclear envelope organization | 14/2587 | 47/18723 | 3.49e-03 | 3.23e-02 | 14 |
| GO:014001414 | Esophagus | ESCC | mitotic nuclear division | 218/8552 | 287/18723 | 6.17e-26 | 1.78e-23 | 218 |
| GO:00482853 | Esophagus | ESCC | organelle fission | 301/8552 | 488/18723 | 4.64e-13 | 2.12e-11 | 301 |
| GO:00002802 | Esophagus | ESCC | nuclear division | 270/8552 | 439/18723 | 1.17e-11 | 4.24e-10 | 270 |
| GO:000699713 | Esophagus | ESCC | nucleus organization | 96/8552 | 133/18723 | 4.66e-10 | 1.21e-08 | 96 |
| GO:000702914 | Esophagus | ESCC | endoplasmic reticulum organization | 65/8552 | 87/18723 | 3.28e-08 | 6.08e-07 | 65 |
| GO:000699811 | Esophagus | ESCC | nuclear envelope organization | 39/8552 | 47/18723 | 1.48e-07 | 2.35e-06 | 39 |
| Page: 1 2 3 |
| Pathway ID | Tissue | Disease Stage | Description | Gene Ratio | Bg Ratio | pvalue | p.adjust | qvalue | Count |
| Page: 1 |
Top |
Cell-cell communication analysis |
| Identification of potential cell-cell interactions between two cell types and their ligand-receptor pairs for different disease states |
| Ligand | Receptor | LRpair | Pathway | Tissue | Disease Stage |
| Page: 1 |
Top |
Single-cell gene regulatory network inference analysis |
| Find out the significant the regulons (TFs) and the target genes of each regulon across cell types for different disease states |
| TF | Cell Type | Tissue | Disease Stage | Target Gene | RSS | Regulon Activity |
| ∗The dot plots of a searched regulon are shown for all cell subpopulations in each disease state of each tissue based on the regulon specific score inferred using pySCENIC and by calculating the average expression. |
| Page: 1 |
Top |
Somatic mutation of malignant transformation related genes |
| Annotation of somatic variants for genes involved in malignant transformation |
| Hugo Symbol | Variant Class | Variant Classification | dbSNP RS | HGVSc | HGVSp | HGVSp Short | SWISSPROT | BIOTYPE | SIFT | PolyPhen | Tumor Sample Barcode | Tissue | Histology | Sex | Age | Stage | Therapy Types | Drugs | Outcome |
| REEP4 | SNV | Missense_Mutation | c.79N>A | p.Val27Met | p.V27M | Q9H6H4 | protein_coding | deleterious(0) | probably_damaging(0.999) | TCGA-HF-7132-01 | Stomach | stomach adenocarcinoma | Male | Unknown | I/II | Chemotherapy | fluorouracil | SD |
| Page: 1 2 3 |
Top |
Related drugs of malignant transformation related genes |
| Identification of chemicals and drugs interact with genes involved in malignant transfromation |
| (DGIdb 4.0) |
| Entrez ID | Symbol | Category | Interaction Types | Drug Claim Name | Drug Name | PMIDs |
| Page: 1 |

Copyright 2023-Present -The University of Texas Health Science Center at Houston |