
|
|||||
|
 | |
| |
| |
| |
| |
| |
|
Gene: RBKS |
Gene summary for RBKS |
| Gene information | Species | Human | Gene symbol | RBKS | Gene ID | 64080 |
| Gene name | ribokinase | |
| Gene Alias | RBSK | |
| Cytomap | 2p23.2 | |
| Gene Type | protein-coding | GO ID | GO:0005975 | UniProtAcc | Q9H477 |
Top |
Malignant transformation analysis |
| Identification of the aberrant gene expression in precancerous and cancerous lesions by comparing the gene expression of stem-like cells in diseased tissues with normal stem cells |
| Entrez ID | Symbol | Replicates | Species | Organ | Tissue | Adj P-value | Log2FC | Malignancy |
| 64080 | RBKS | LZE4T | Human | Esophagus | ESCC | 1.29e-02 | 1.30e-01 | 0.0811 |
| 64080 | RBKS | LZE24T | Human | Esophagus | ESCC | 1.36e-07 | 1.87e-01 | 0.0596 |
| 64080 | RBKS | LZE6T | Human | Esophagus | ESCC | 4.59e-02 | 1.44e-01 | 0.0845 |
| 64080 | RBKS | P1T-E | Human | Esophagus | ESCC | 1.36e-05 | 2.29e-01 | 0.0875 |
| 64080 | RBKS | P2T-E | Human | Esophagus | ESCC | 4.31e-06 | 1.66e-01 | 0.1177 |
| 64080 | RBKS | P4T-E | Human | Esophagus | ESCC | 7.59e-12 | 1.98e-01 | 0.1323 |
| 64080 | RBKS | P5T-E | Human | Esophagus | ESCC | 4.30e-10 | 2.01e-01 | 0.1327 |
| 64080 | RBKS | P8T-E | Human | Esophagus | ESCC | 2.05e-07 | 1.23e-01 | 0.0889 |
| 64080 | RBKS | P10T-E | Human | Esophagus | ESCC | 1.96e-05 | 1.25e-01 | 0.116 |
| 64080 | RBKS | P11T-E | Human | Esophagus | ESCC | 1.74e-04 | 2.54e-01 | 0.1426 |
| 64080 | RBKS | P12T-E | Human | Esophagus | ESCC | 4.31e-06 | 1.38e-01 | 0.1122 |
| 64080 | RBKS | P15T-E | Human | Esophagus | ESCC | 6.50e-04 | 9.91e-02 | 0.1149 |
| 64080 | RBKS | P16T-E | Human | Esophagus | ESCC | 1.78e-03 | 1.65e-01 | 0.1153 |
| 64080 | RBKS | P20T-E | Human | Esophagus | ESCC | 1.89e-12 | 2.14e-01 | 0.1124 |
| 64080 | RBKS | P21T-E | Human | Esophagus | ESCC | 9.53e-09 | 1.61e-01 | 0.1617 |
| 64080 | RBKS | P22T-E | Human | Esophagus | ESCC | 7.98e-13 | 3.16e-01 | 0.1236 |
| 64080 | RBKS | P23T-E | Human | Esophagus | ESCC | 1.44e-13 | 3.89e-01 | 0.108 |
| 64080 | RBKS | P24T-E | Human | Esophagus | ESCC | 4.44e-08 | 2.52e-01 | 0.1287 |
| 64080 | RBKS | P26T-E | Human | Esophagus | ESCC | 5.55e-05 | 1.42e-01 | 0.1276 |
| 64080 | RBKS | P27T-E | Human | Esophagus | ESCC | 9.30e-07 | 1.47e-01 | 0.1055 |
| Page: 1 2 3 |
| Tissue | Expression Dynamics | Abbreviation |
| Esophagus |  | ESCC: Esophageal squamous cell carcinoma |
| HGIN: High-grade intraepithelial neoplasias | ||
| LGIN: Low-grade intraepithelial neoplasias | ||
| Liver | 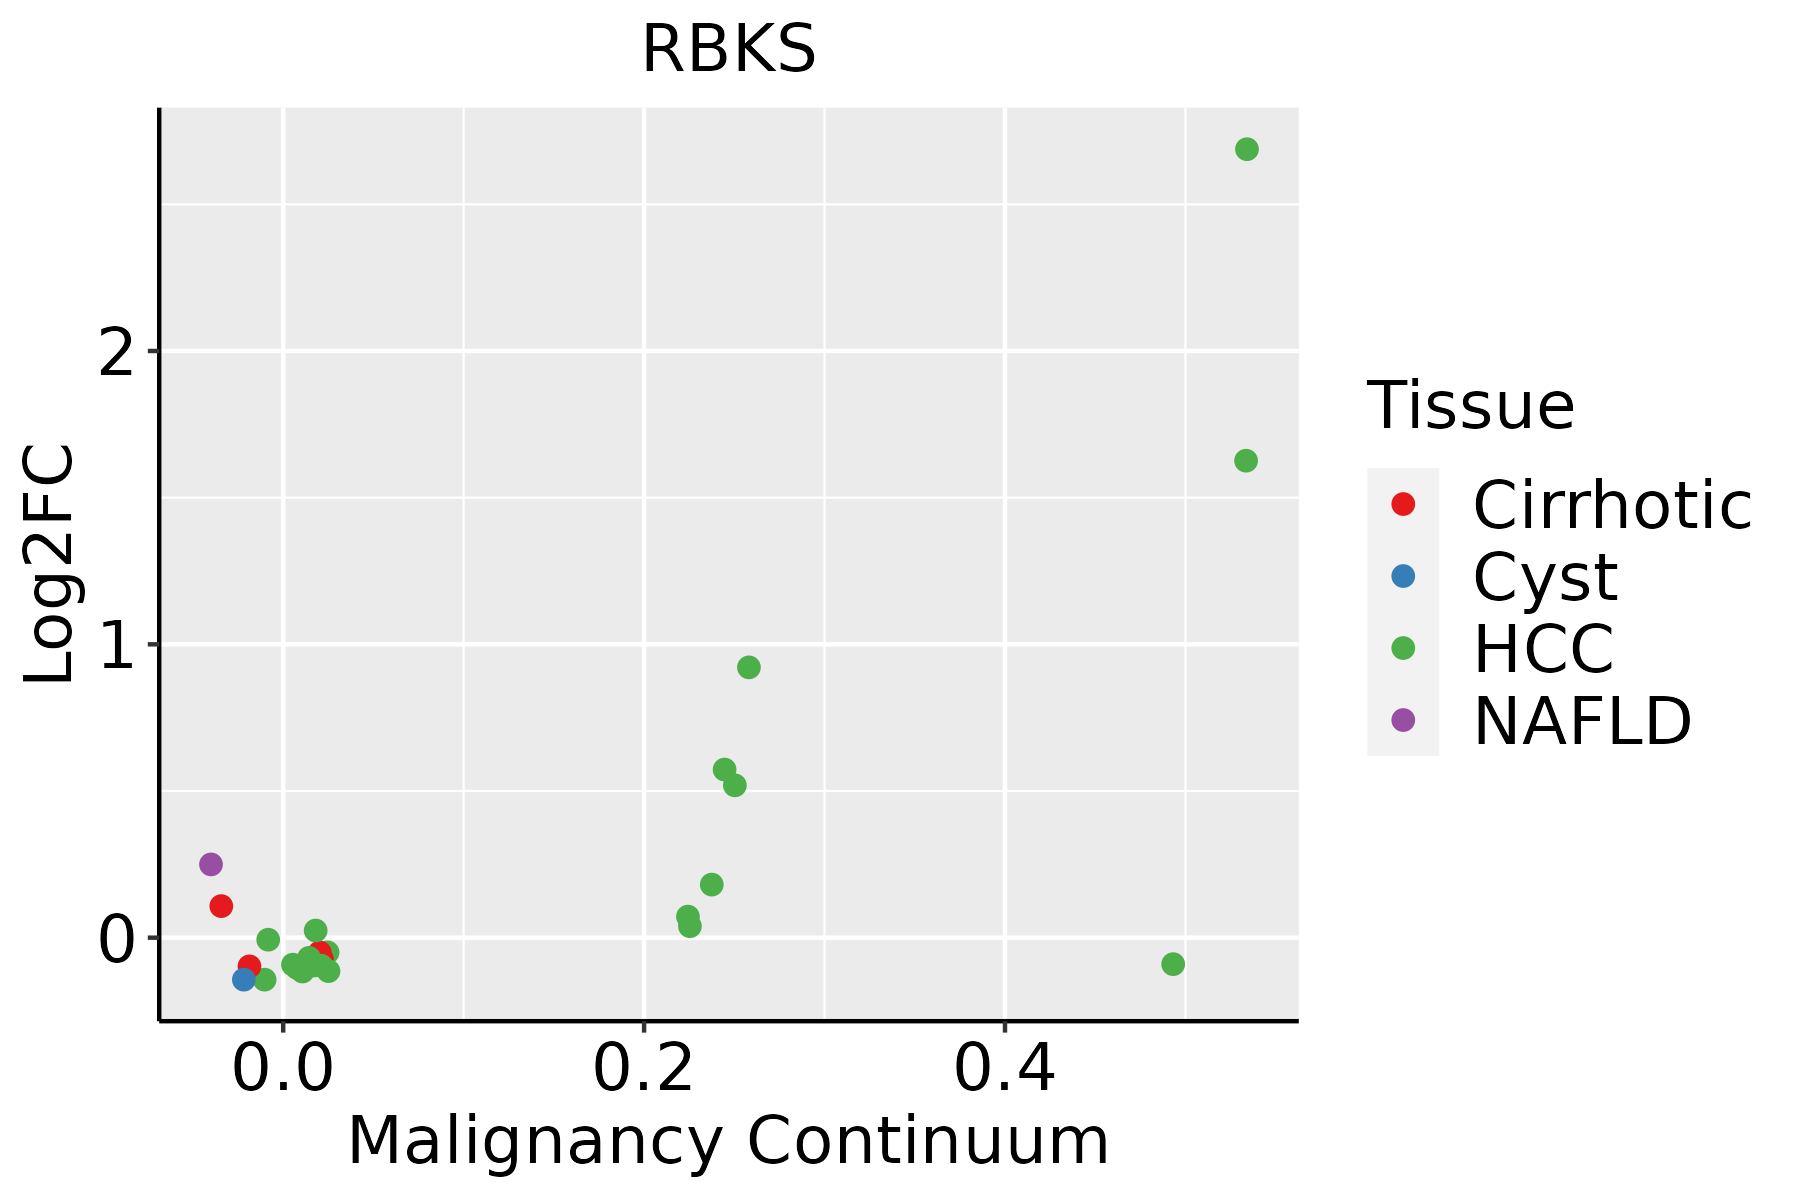 | HCC: Hepatocellular carcinoma |
| NAFLD: Non-alcoholic fatty liver disease |
| ∗log2FC in expression of this searched gene in stem-like cells from each diseased tissue sample relative to stem-like cells in normal samples in each tissue plotted against the malignancy continuum. Samples are colored based on if they are from different disease stage. |
Top |
Malignant transformation related pathway analysis |
| Find out the enriched GO biological processes and KEGG pathways involved in transition from healthy to precancer to cancer |
| Tissue | Disease Stage | Enriched GO biological Processes |
| Colorectum | AD |  |
| Colorectum | SER |  |
| Colorectum | MSS |  |
| Colorectum | MSI-H |  |
| Colorectum | FAP |  |
| ∗Top 15 enriched GO BP terms are showed in the bar plot of each disease state in each tissue. Each row represents a significant GO biological process which is colored according to the -log10(p.adjust). |
| Page: 1 2 3 4 5 6 7 8 9 |
| GO ID | Tissue | Disease Stage | Description | Gene Ratio | Bg Ratio | pvalue | p.adjust | Count |
| GO:0006091110 | Esophagus | ESCC | generation of precursor metabolites and energy | 331/8552 | 490/18723 | 3.86e-23 | 8.45e-21 | 331 |
| GO:00059969 | Esophagus | ESCC | monosaccharide metabolic process | 159/8552 | 257/18723 | 1.11e-07 | 1.81e-06 | 159 |
| GO:00442626 | Esophagus | ESCC | cellular carbohydrate metabolic process | 160/8552 | 283/18723 | 1.43e-04 | 9.66e-04 | 160 |
| GO:001605216 | Esophagus | ESCC | carbohydrate catabolic process | 91/8552 | 154/18723 | 5.39e-04 | 2.97e-03 | 91 |
| GO:00442827 | Esophagus | ESCC | small molecule catabolic process | 201/8552 | 376/18723 | 1.35e-03 | 6.41e-03 | 201 |
| GO:000674012 | Esophagus | ESCC | NADPH regeneration | 13/8552 | 16/18723 | 4.05e-03 | 1.62e-02 | 13 |
| GO:000609812 | Esophagus | ESCC | pentose-phosphate shunt | 12/8552 | 15/18723 | 7.31e-03 | 2.63e-02 | 12 |
| GO:00067393 | Esophagus | ESCC | NADP metabolic process | 23/8552 | 35/18723 | 1.34e-02 | 4.38e-02 | 23 |
| GO:000609112 | Liver | Cirrhotic | generation of precursor metabolites and energy | 238/4634 | 490/18723 | 6.85e-31 | 1.07e-27 | 238 |
| GO:004428211 | Liver | Cirrhotic | small molecule catabolic process | 151/4634 | 376/18723 | 2.20e-11 | 1.34e-09 | 151 |
| GO:000599612 | Liver | Cirrhotic | monosaccharide metabolic process | 104/4634 | 257/18723 | 1.74e-08 | 6.32e-07 | 104 |
| GO:001605212 | Liver | Cirrhotic | carbohydrate catabolic process | 66/4634 | 154/18723 | 6.10e-07 | 1.32e-05 | 66 |
| GO:004426211 | Liver | Cirrhotic | cellular carbohydrate metabolic process | 97/4634 | 283/18723 | 1.89e-04 | 1.76e-03 | 97 |
| GO:0006098 | Liver | Cirrhotic | pentose-phosphate shunt | 9/4634 | 15/18723 | 3.88e-03 | 2.10e-02 | 9 |
| GO:0051156 | Liver | Cirrhotic | glucose 6-phosphate metabolic process | 12/4634 | 24/18723 | 6.58e-03 | 3.25e-02 | 12 |
| GO:0006740 | Liver | Cirrhotic | NADPH regeneration | 9/4634 | 16/18723 | 6.94e-03 | 3.38e-02 | 9 |
| GO:000609122 | Liver | HCC | generation of precursor metabolites and energy | 340/7958 | 490/18723 | 4.04e-34 | 2.85e-31 | 340 |
| GO:000599621 | Liver | HCC | monosaccharide metabolic process | 167/7958 | 257/18723 | 2.31e-13 | 1.25e-11 | 167 |
| GO:004428221 | Liver | HCC | small molecule catabolic process | 225/7958 | 376/18723 | 6.50e-12 | 2.80e-10 | 225 |
| GO:001605222 | Liver | HCC | carbohydrate catabolic process | 99/7958 | 154/18723 | 3.79e-08 | 8.30e-07 | 99 |
| Page: 1 2 |
| Pathway ID | Tissue | Disease Stage | Description | Gene Ratio | Bg Ratio | pvalue | p.adjust | qvalue | Count |
| hsa00030 | Liver | Cirrhotic | Pentose phosphate pathway | 16/2530 | 30/8465 | 6.04e-03 | 2.12e-02 | 1.30e-02 | 16 |
| hsa000301 | Liver | Cirrhotic | Pentose phosphate pathway | 16/2530 | 30/8465 | 6.04e-03 | 2.12e-02 | 1.30e-02 | 16 |
| hsa000302 | Liver | HCC | Pentose phosphate pathway | 21/4020 | 30/8465 | 1.06e-02 | 2.71e-02 | 1.51e-02 | 21 |
| hsa000303 | Liver | HCC | Pentose phosphate pathway | 21/4020 | 30/8465 | 1.06e-02 | 2.71e-02 | 1.51e-02 | 21 |
| Page: 1 |
Top |
Cell-cell communication analysis |
| Identification of potential cell-cell interactions between two cell types and their ligand-receptor pairs for different disease states |
| Ligand | Receptor | LRpair | Pathway | Tissue | Disease Stage |
| Page: 1 |
Top |
Single-cell gene regulatory network inference analysis |
| Find out the significant the regulons (TFs) and the target genes of each regulon across cell types for different disease states |
| TF | Cell Type | Tissue | Disease Stage | Target Gene | RSS | Regulon Activity |
| ∗The dot plots of a searched regulon are shown for all cell subpopulations in each disease state of each tissue based on the regulon specific score inferred using pySCENIC and by calculating the average expression. |
| Page: 1 |
Top |
Somatic mutation of malignant transformation related genes |
| Annotation of somatic variants for genes involved in malignant transformation |
| Hugo Symbol | Variant Class | Variant Classification | dbSNP RS | HGVSc | HGVSp | HGVSp Short | SWISSPROT | BIOTYPE | SIFT | PolyPhen | Tumor Sample Barcode | Tissue | Histology | Sex | Age | Stage | Therapy Types | Drugs | Outcome |
| RBKS | SNV | Missense_Mutation | novel | c.19N>G | p.Pro7Ala | p.P7A | Q9H477 | protein_coding | deleterious_low_confidence(0.02) | benign(0.021) | TCGA-IN-A6RL-01 | Stomach | stomach adenocarcinoma | Male | >=65 | III/IV | Unknown | Unknown | PD |
| RBKS | SNV | Missense_Mutation | novel | c.393N>T | p.Leu131Phe | p.L131F | Q9H477 | protein_coding | deleterious(0) | probably_damaging(0.979) | TCGA-FE-A237-01 | Thyroid | thyroid carcinoma | Female | <65 | I/II | Unknown | Unknown | PD |
| Page: 1 2 3 |
Top |
Related drugs of malignant transformation related genes |
| Identification of chemicals and drugs interact with genes involved in malignant transfromation |
| (DGIdb 4.0) |
| Entrez ID | Symbol | Category | Interaction Types | Drug Claim Name | Drug Name | PMIDs |
| Page: 1 |

Copyright 2023-Present -The University of Texas Health Science Center at Houston |