
|
|||||
|
 | |
| |
| |
| |
| |
| |
|
Gene: PTPRH |
Gene summary for PTPRH |
| Gene information | Species | Human | Gene symbol | PTPRH | Gene ID | 5794 |
| Gene name | protein tyrosine phosphatase receptor type H | |
| Gene Alias | R-PTP-H | |
| Cytomap | 19q13.42 | |
| Gene Type | protein-coding | GO ID | GO:0001932 | UniProtAcc | NA |
Top |
Malignant transformation analysis |
| Identification of the aberrant gene expression in precancerous and cancerous lesions by comparing the gene expression of stem-like cells in diseased tissues with normal stem cells |
| Entrez ID | Symbol | Replicates | Species | Organ | Tissue | Adj P-value | Log2FC | Malignancy |
| 5794 | PTPRH | HTA11_2487_2000001011 | Human | Colorectum | SER | 7.50e-12 | 5.20e-01 | -0.1808 |
| 5794 | PTPRH | HTA11_1938_2000001011 | Human | Colorectum | AD | 5.89e-05 | 2.75e-01 | -0.0811 |
| 5794 | PTPRH | HTA11_347_2000001011 | Human | Colorectum | AD | 1.80e-13 | 4.99e-01 | -0.1954 |
| 5794 | PTPRH | HTA11_411_2000001011 | Human | Colorectum | SER | 5.36e-09 | 1.36e+00 | -0.2602 |
| 5794 | PTPRH | HTA11_2112_2000001011 | Human | Colorectum | SER | 1.01e-02 | 6.06e-01 | -0.2196 |
| 5794 | PTPRH | HTA11_696_2000001011 | Human | Colorectum | AD | 3.10e-07 | 4.25e-01 | -0.1464 |
| 5794 | PTPRH | HTA11_1391_2000001011 | Human | Colorectum | AD | 1.02e-02 | 2.74e-01 | -0.059 |
| 5794 | PTPRH | HTA11_5212_2000001011 | Human | Colorectum | AD | 3.27e-04 | 4.04e-01 | -0.2061 |
| 5794 | PTPRH | LZE24T | Human | Esophagus | ESCC | 4.15e-02 | 9.96e-02 | 0.0596 |
| 5794 | PTPRH | P1T-E | Human | Esophagus | ESCC | 2.97e-02 | 3.41e-01 | 0.0875 |
| 5794 | PTPRH | P8T-E | Human | Esophagus | ESCC | 4.17e-05 | 1.57e-01 | 0.0889 |
| 5794 | PTPRH | P23T-E | Human | Esophagus | ESCC | 6.53e-09 | 2.36e-01 | 0.108 |
| 5794 | PTPRH | P26T-E | Human | Esophagus | ESCC | 4.41e-07 | 1.91e-01 | 0.1276 |
| 5794 | PTPRH | P37T-E | Human | Esophagus | ESCC | 4.27e-06 | 1.53e-01 | 0.1371 |
| 5794 | PTPRH | P75T-E | Human | Esophagus | ESCC | 1.62e-13 | 2.75e-01 | 0.1125 |
| 5794 | PTPRH | P82T-E | Human | Esophagus | ESCC | 1.51e-11 | 5.56e-01 | 0.1072 |
| 5794 | PTPRH | P94T-E | Human | Esophagus | ESCC | 1.38e-05 | 4.88e-01 | 0.0879 |
| 5794 | PTPRH | P104T-E | Human | Esophagus | ESCC | 3.26e-14 | 5.71e-01 | 0.0931 |
| 5794 | PTPRH | P127T-E | Human | Esophagus | ESCC | 7.76e-04 | 1.09e-01 | 0.0826 |
| 5794 | PTPRH | P128T-E | Human | Esophagus | ESCC | 1.29e-09 | 3.46e-01 | 0.1241 |
| Page: 1 2 |
| Tissue | Expression Dynamics | Abbreviation |
| Colorectum (GSE201348) |  | FAP: Familial adenomatous polyposis |
| CRC: Colorectal cancer | ||
| Colorectum (HTA11) |  | AD: Adenomas |
| SER: Sessile serrated lesions | ||
| MSI-H: Microsatellite-high colorectal cancer | ||
| MSS: Microsatellite stable colorectal cancer | ||
| Esophagus | 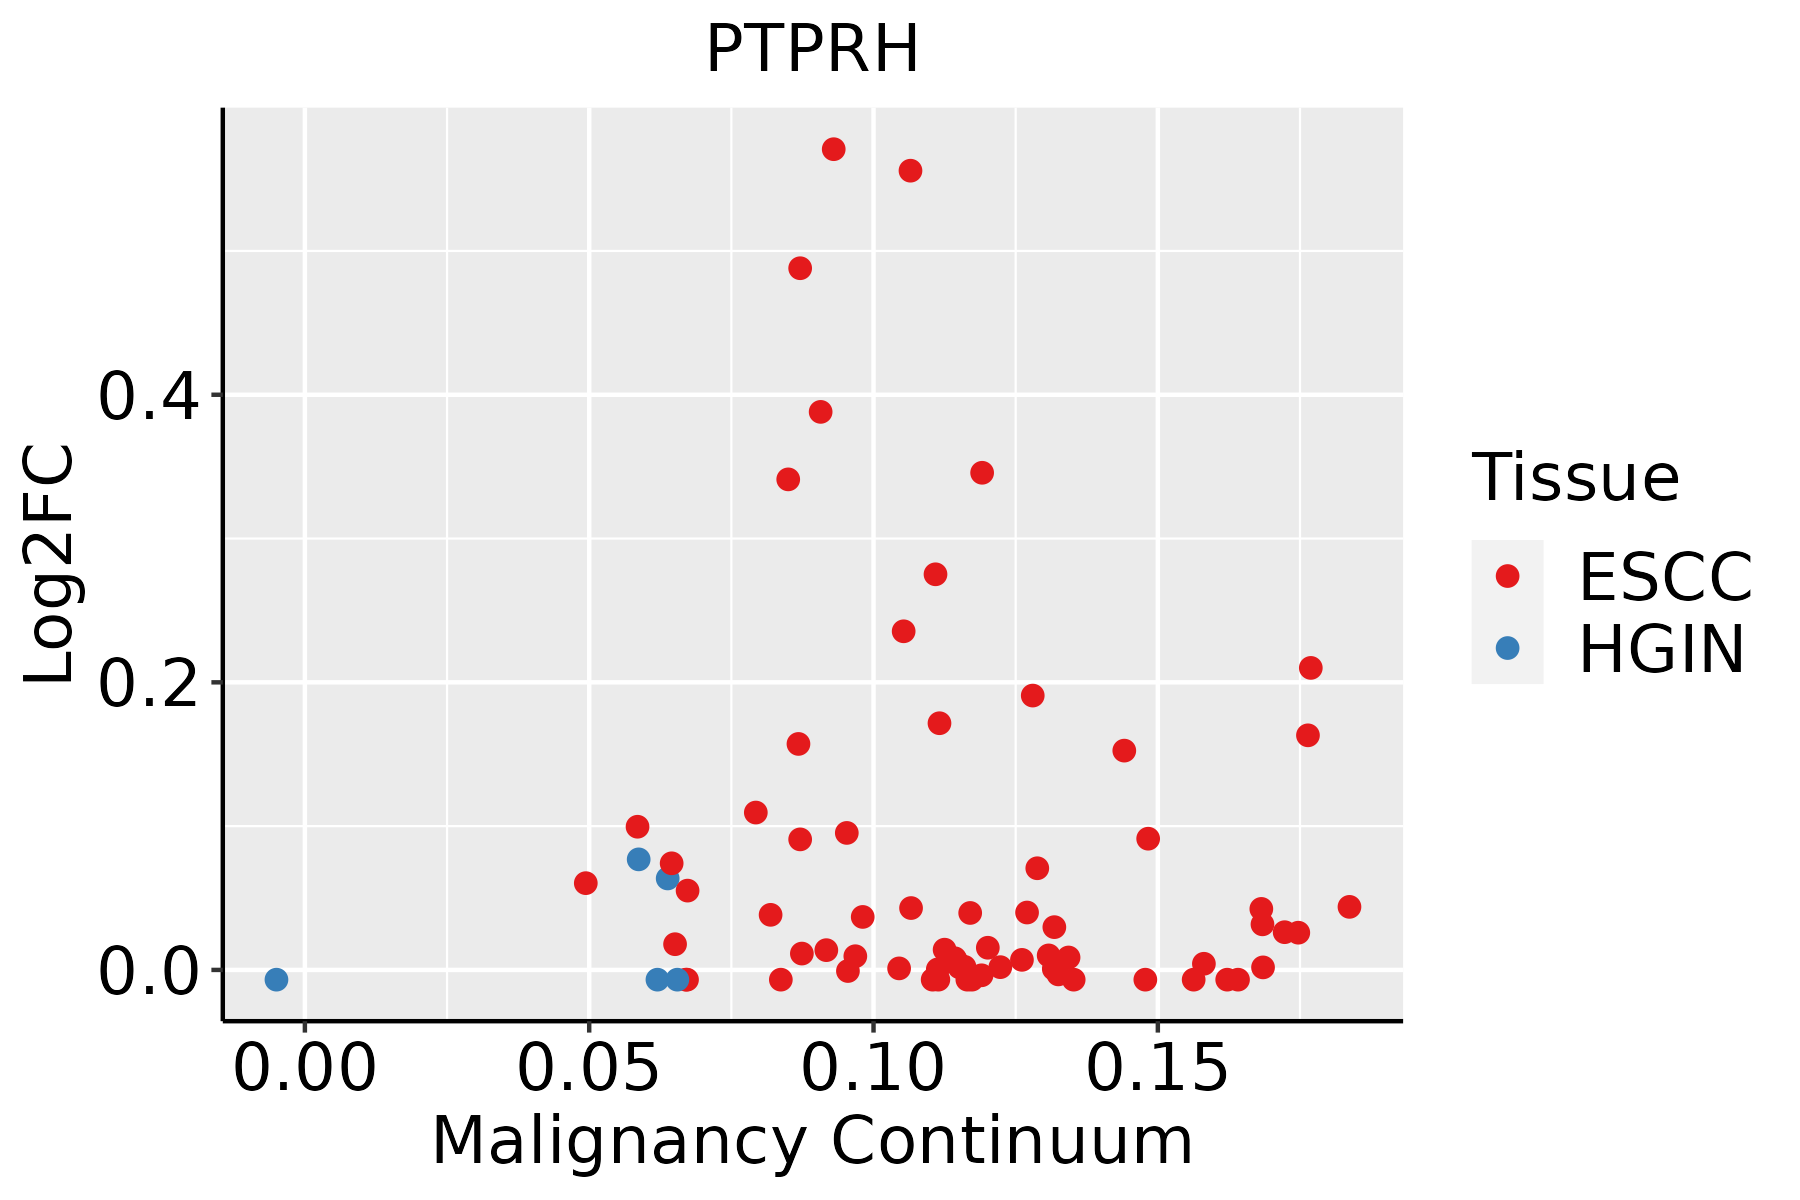 | ESCC: Esophageal squamous cell carcinoma |
| HGIN: High-grade intraepithelial neoplasias | ||
| LGIN: Low-grade intraepithelial neoplasias | ||
| GC | 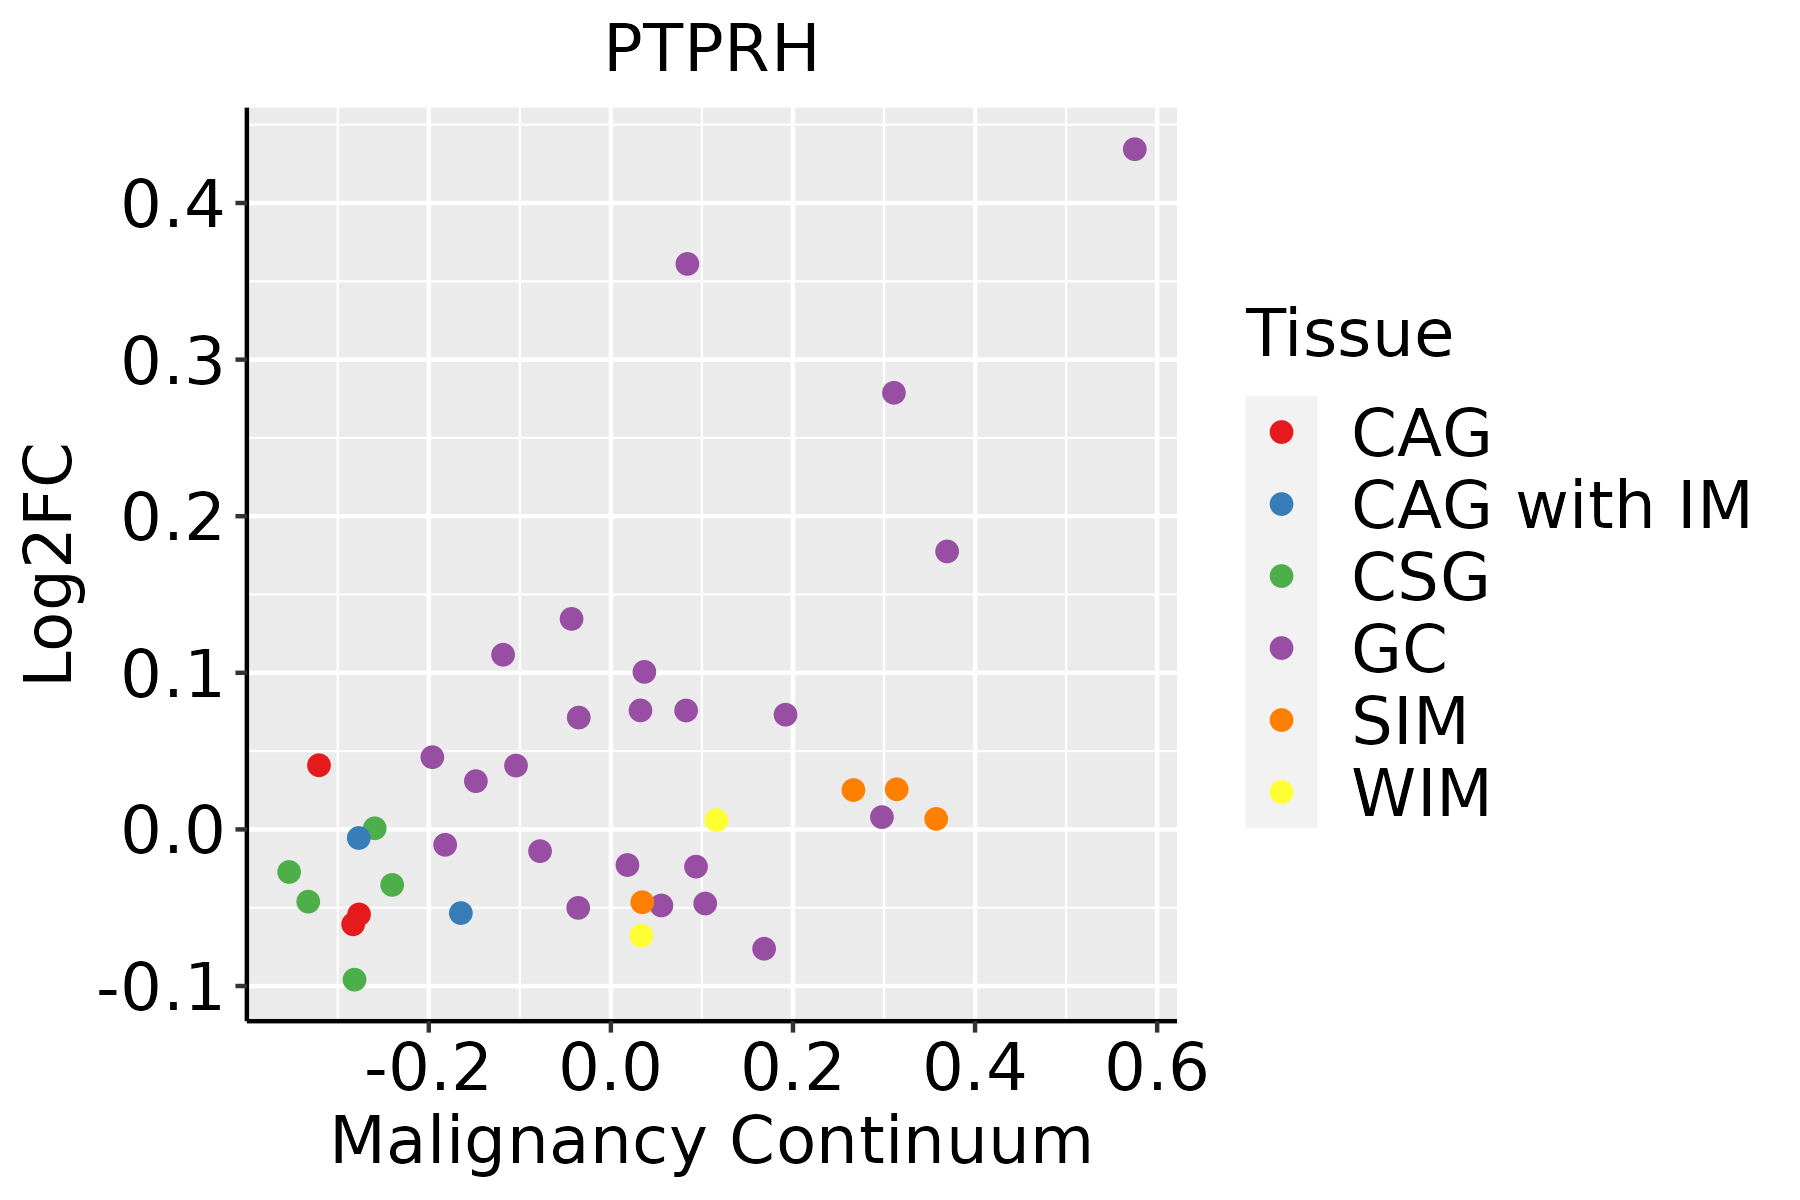 | CAG: Chronic atrophic gastritis |
| CAG with IM: Chronic atrophic gastritis with intestinal metaplasia | ||
| CSG: Chronic superficial gastritis | ||
| GC: Gastric cancer | ||
| SIM: Severe intestinal metaplasia | ||
| WIM: Wild intestinal metaplasia |
| ∗log2FC in expression of this searched gene in stem-like cells from each diseased tissue sample relative to stem-like cells in normal samples in each tissue plotted against the malignancy continuum. Samples are colored based on if they are from different disease stage. |
Top |
Malignant transformation related pathway analysis |
| Find out the enriched GO biological processes and KEGG pathways involved in transition from healthy to precancer to cancer |
| Tissue | Disease Stage | Enriched GO biological Processes |
| Colorectum | AD |  |
| Colorectum | SER |  |
| Colorectum | MSS |  |
| Colorectum | MSI-H |  |
| Colorectum | FAP |  |
| ∗Top 15 enriched GO BP terms are showed in the bar plot of each disease state in each tissue. Each row represents a significant GO biological process which is colored according to the -log10(p.adjust). |
| Page: 1 2 3 4 5 6 7 8 9 |
| GO ID | Tissue | Disease Stage | Description | Gene Ratio | Bg Ratio | pvalue | p.adjust | Count |
| GO:0010563 | Colorectum | AD | negative regulation of phosphorus metabolic process | 130/3918 | 442/18723 | 1.26e-05 | 2.76e-04 | 130 |
| GO:0045936 | Colorectum | AD | negative regulation of phosphate metabolic process | 129/3918 | 441/18723 | 1.81e-05 | 3.76e-04 | 129 |
| GO:0016311 | Colorectum | AD | dephosphorylation | 123/3918 | 417/18723 | 1.84e-05 | 3.82e-04 | 123 |
| GO:0051348 | Colorectum | AD | negative regulation of transferase activity | 85/3918 | 268/18723 | 2.07e-05 | 4.19e-04 | 85 |
| GO:0006470 | Colorectum | AD | protein dephosphorylation | 88/3918 | 281/18723 | 2.56e-05 | 4.89e-04 | 88 |
| GO:0042326 | Colorectum | AD | negative regulation of phosphorylation | 112/3918 | 385/18723 | 8.02e-05 | 1.27e-03 | 112 |
| GO:0001933 | Colorectum | AD | negative regulation of protein phosphorylation | 101/3918 | 342/18723 | 9.39e-05 | 1.42e-03 | 101 |
| GO:0006469 | Colorectum | AD | negative regulation of protein kinase activity | 65/3918 | 212/18723 | 5.21e-04 | 5.62e-03 | 65 |
| GO:0033673 | Colorectum | AD | negative regulation of kinase activity | 71/3918 | 237/18723 | 6.18e-04 | 6.47e-03 | 71 |
| GO:00513481 | Colorectum | SER | negative regulation of transferase activity | 70/2897 | 268/18723 | 4.27e-06 | 1.62e-04 | 70 |
| GO:00105631 | Colorectum | SER | negative regulation of phosphorus metabolic process | 101/2897 | 442/18723 | 2.39e-05 | 6.70e-04 | 101 |
| GO:00459361 | Colorectum | SER | negative regulation of phosphate metabolic process | 100/2897 | 441/18723 | 3.62e-05 | 9.39e-04 | 100 |
| GO:00019331 | Colorectum | SER | negative regulation of protein phosphorylation | 79/2897 | 342/18723 | 1.21e-04 | 2.49e-03 | 79 |
| GO:00423261 | Colorectum | SER | negative regulation of phosphorylation | 86/2897 | 385/18723 | 2.10e-04 | 3.78e-03 | 86 |
| GO:00336731 | Colorectum | SER | negative regulation of kinase activity | 57/2897 | 237/18723 | 3.48e-04 | 5.46e-03 | 57 |
| GO:00064691 | Colorectum | SER | negative regulation of protein kinase activity | 52/2897 | 212/18723 | 3.75e-04 | 5.74e-03 | 52 |
| GO:00064701 | Colorectum | SER | protein dephosphorylation | 65/2897 | 281/18723 | 4.44e-04 | 6.51e-03 | 65 |
| GO:00163111 | Colorectum | SER | dephosphorylation | 86/2897 | 417/18723 | 2.73e-03 | 2.46e-02 | 86 |
| GO:0010563111 | Esophagus | ESCC | negative regulation of phosphorus metabolic process | 274/8552 | 442/18723 | 2.32e-12 | 9.41e-11 | 274 |
| GO:0045936111 | Esophagus | ESCC | negative regulation of phosphate metabolic process | 273/8552 | 441/18723 | 3.18e-12 | 1.25e-10 | 273 |
| Page: 1 2 |
| Pathway ID | Tissue | Disease Stage | Description | Gene Ratio | Bg Ratio | pvalue | p.adjust | qvalue | Count |
| Page: 1 |
Top |
Cell-cell communication analysis |
| Identification of potential cell-cell interactions between two cell types and their ligand-receptor pairs for different disease states |
| Ligand | Receptor | LRpair | Pathway | Tissue | Disease Stage |
| Page: 1 |
Top |
Single-cell gene regulatory network inference analysis |
| Find out the significant the regulons (TFs) and the target genes of each regulon across cell types for different disease states |
| TF | Cell Type | Tissue | Disease Stage | Target Gene | RSS | Regulon Activity |
| ∗The dot plots of a searched regulon are shown for all cell subpopulations in each disease state of each tissue based on the regulon specific score inferred using pySCENIC and by calculating the average expression. |
| Page: 1 |
Top |
Somatic mutation of malignant transformation related genes |
| Annotation of somatic variants for genes involved in malignant transformation |
| Hugo Symbol | Variant Class | Variant Classification | dbSNP RS | HGVSc | HGVSp | HGVSp Short | SWISSPROT | BIOTYPE | SIFT | PolyPhen | Tumor Sample Barcode | Tissue | Histology | Sex | Age | Stage | Therapy Types | Drugs | Outcome |
| PTPRH | SNV | Missense_Mutation | rs150929721 | c.3316N>A | p.Ala1106Thr | p.A1106T | Q9HD43 | protein_coding | deleterious(0.03) | possibly_damaging(0.905) | TCGA-AZ-6606-01 | Colorectum | colon adenocarcinoma | Male | >=65 | III/IV | Chemotherapy | folfiri | PD |
| PTPRH | SNV | Missense_Mutation | c.788N>T | p.Thr263Ile | p.T263I | Q9HD43 | protein_coding | tolerated(0.09) | benign(0.067) | TCGA-CM-4743-01 | Colorectum | colon adenocarcinoma | Male | >=65 | I/II | Chemotherapy | capecitabine | SD | |
| PTPRH | SNV | Missense_Mutation | rs769189088 | c.1139N>A | p.Arg380Gln | p.R380Q | Q9HD43 | protein_coding | tolerated(0.34) | benign(0.013) | TCGA-AG-A002-01 | Colorectum | rectum adenocarcinoma | Male | <65 | I/II | Unknown | Unknown | SD |
| PTPRH | SNV | Missense_Mutation | rs369140474 | c.1480N>T | p.Arg494Cys | p.R494C | Q9HD43 | protein_coding | tolerated(0.11) | benign(0.013) | TCGA-CI-6619-01 | Colorectum | rectum adenocarcinoma | Male | <65 | III/IV | Unknown | Unknown | SD |
| PTPRH | SNV | Missense_Mutation | rs760246867 | c.1207N>A | p.Ala403Thr | p.A403T | Q9HD43 | protein_coding | tolerated(1) | benign(0.001) | TCGA-EI-6917-01 | Colorectum | rectum adenocarcinoma | Male | <65 | III/IV | Chemotherapy | 5fluorouracil+oxaciplatina+l-folinian | SD |
| PTPRH | SNV | Missense_Mutation | rs753627783 | c.1298G>A | p.Arg433Gln | p.R433Q | Q9HD43 | protein_coding | tolerated(0.7) | benign(0.009) | TCGA-F5-6814-01 | Colorectum | rectum adenocarcinoma | Male | <65 | I/II | Unknown | Unknown | SD |
| PTPRH | SNV | Missense_Mutation | rs778712446 | c.2578C>T | p.Arg860Trp | p.R860W | Q9HD43 | protein_coding | deleterious(0) | probably_damaging(1) | TCGA-G5-6572-02 | Colorectum | NA | NA | NA | NA | NA | NA | NA |
| PTPRH | insertion | Frame_Shift_Ins | novel | c.1379dupA | p.Asn460LysfsTer60 | p.N460Kfs*60 | Q9HD43 | protein_coding | TCGA-AA-3949-01 | Colorectum | colon adenocarcinoma | Female | >=65 | III/IV | Unknown | Unknown | SD | ||
| PTPRH | SNV | Missense_Mutation | novel | c.1708G>A | p.Asp570Asn | p.D570N | Q9HD43 | protein_coding | tolerated(0.51) | benign(0.03) | TCGA-A5-A0G1-01 | Endometrium | uterine corpus endometrioid carcinoma | Female | >=65 | I/II | Unknown | Unknown | SD |
| PTPRH | SNV | Missense_Mutation | rs565640893 | c.2164G>A | p.Gly722Arg | p.G722R | Q9HD43 | protein_coding | tolerated(0.59) | benign(0.028) | TCGA-A5-A0G2-01 | Endometrium | uterine corpus endometrioid carcinoma | Female | <65 | III/IV | Unknown | Unknown | SD |
| Page: 1 2 3 4 5 6 7 8 9 10 11 12 13 14 15 |
Top |
Related drugs of malignant transformation related genes |
| Identification of chemicals and drugs interact with genes involved in malignant transfromation |
| (DGIdb 4.0) |
| Entrez ID | Symbol | Category | Interaction Types | Drug Claim Name | Drug Name | PMIDs |
| Page: 1 |

Copyright 2023-Present -The University of Texas Health Science Center at Houston |