
|
|||||
|
 | |
| |
| |
| |
| |
| |
|
Gene: MSRB2 |
Gene summary for MSRB2 |
| Gene information | Species | Human | Gene symbol | MSRB2 | Gene ID | 22921 |
| Gene name | methionine sulfoxide reductase B2 | |
| Gene Alias | CBS-1 | |
| Cytomap | 10p12.2 | |
| Gene Type | protein-coding | GO ID | GO:0006807 | UniProtAcc | Q9Y3D2 |
Top |
Malignant transformation analysis |
| Identification of the aberrant gene expression in precancerous and cancerous lesions by comparing the gene expression of stem-like cells in diseased tissues with normal stem cells |
| Entrez ID | Symbol | Replicates | Species | Organ | Tissue | Adj P-value | Log2FC | Malignancy |
| 22921 | MSRB2 | GSM4909281 | Human | Breast | IDC | 5.46e-06 | 3.55e-01 | 0.21 |
| 22921 | MSRB2 | GSM4909285 | Human | Breast | IDC | 1.52e-11 | 4.40e-01 | 0.21 |
| 22921 | MSRB2 | GSM4909289 | Human | Breast | IDC | 3.18e-04 | 5.20e-01 | 0.1064 |
| 22921 | MSRB2 | GSM4909293 | Human | Breast | IDC | 2.85e-12 | 4.19e-01 | 0.1581 |
| 22921 | MSRB2 | GSM4909294 | Human | Breast | IDC | 6.72e-03 | 3.28e-01 | 0.2022 |
| 22921 | MSRB2 | GSM4909296 | Human | Breast | IDC | 9.00e-04 | 2.68e-01 | 0.1524 |
| 22921 | MSRB2 | GSM4909301 | Human | Breast | IDC | 4.76e-11 | 4.72e-01 | 0.1577 |
| 22921 | MSRB2 | GSM4909304 | Human | Breast | IDC | 4.19e-07 | 4.29e-01 | 0.1636 |
| 22921 | MSRB2 | GSM4909306 | Human | Breast | IDC | 1.17e-02 | 3.49e-01 | 0.1564 |
| 22921 | MSRB2 | GSM4909308 | Human | Breast | IDC | 1.29e-07 | 2.86e-01 | 0.158 |
| 22921 | MSRB2 | GSM4909311 | Human | Breast | IDC | 8.76e-13 | -6.77e-02 | 0.1534 |
| 22921 | MSRB2 | GSM4909315 | Human | Breast | IDC | 1.07e-17 | 7.08e-01 | 0.21 |
| 22921 | MSRB2 | GSM4909316 | Human | Breast | IDC | 1.92e-09 | 6.47e-01 | 0.21 |
| 22921 | MSRB2 | GSM4909319 | Human | Breast | IDC | 9.80e-21 | 9.84e-02 | 0.1563 |
| 22921 | MSRB2 | GSM4909321 | Human | Breast | IDC | 1.01e-02 | 7.41e-02 | 0.1559 |
| 22921 | MSRB2 | M1 | Human | Breast | IDC | 5.43e-04 | 2.84e-01 | 0.1577 |
| 22921 | MSRB2 | DCIS2 | Human | Breast | DCIS | 1.33e-51 | 2.29e-01 | 0.0085 |
| 22921 | MSRB2 | HTA11_1938_2000001011 | Human | Colorectum | AD | 1.25e-03 | 2.90e-01 | -0.0811 |
| 22921 | MSRB2 | HTA11_347_2000001011 | Human | Colorectum | AD | 2.48e-08 | 2.68e-01 | -0.1954 |
| 22921 | MSRB2 | HTA11_3361_2000001011 | Human | Colorectum | AD | 4.78e-03 | 2.48e-01 | -0.1207 |
| Page: 1 2 3 4 5 6 7 8 |
| Tissue | Expression Dynamics | Abbreviation |
| Breast | 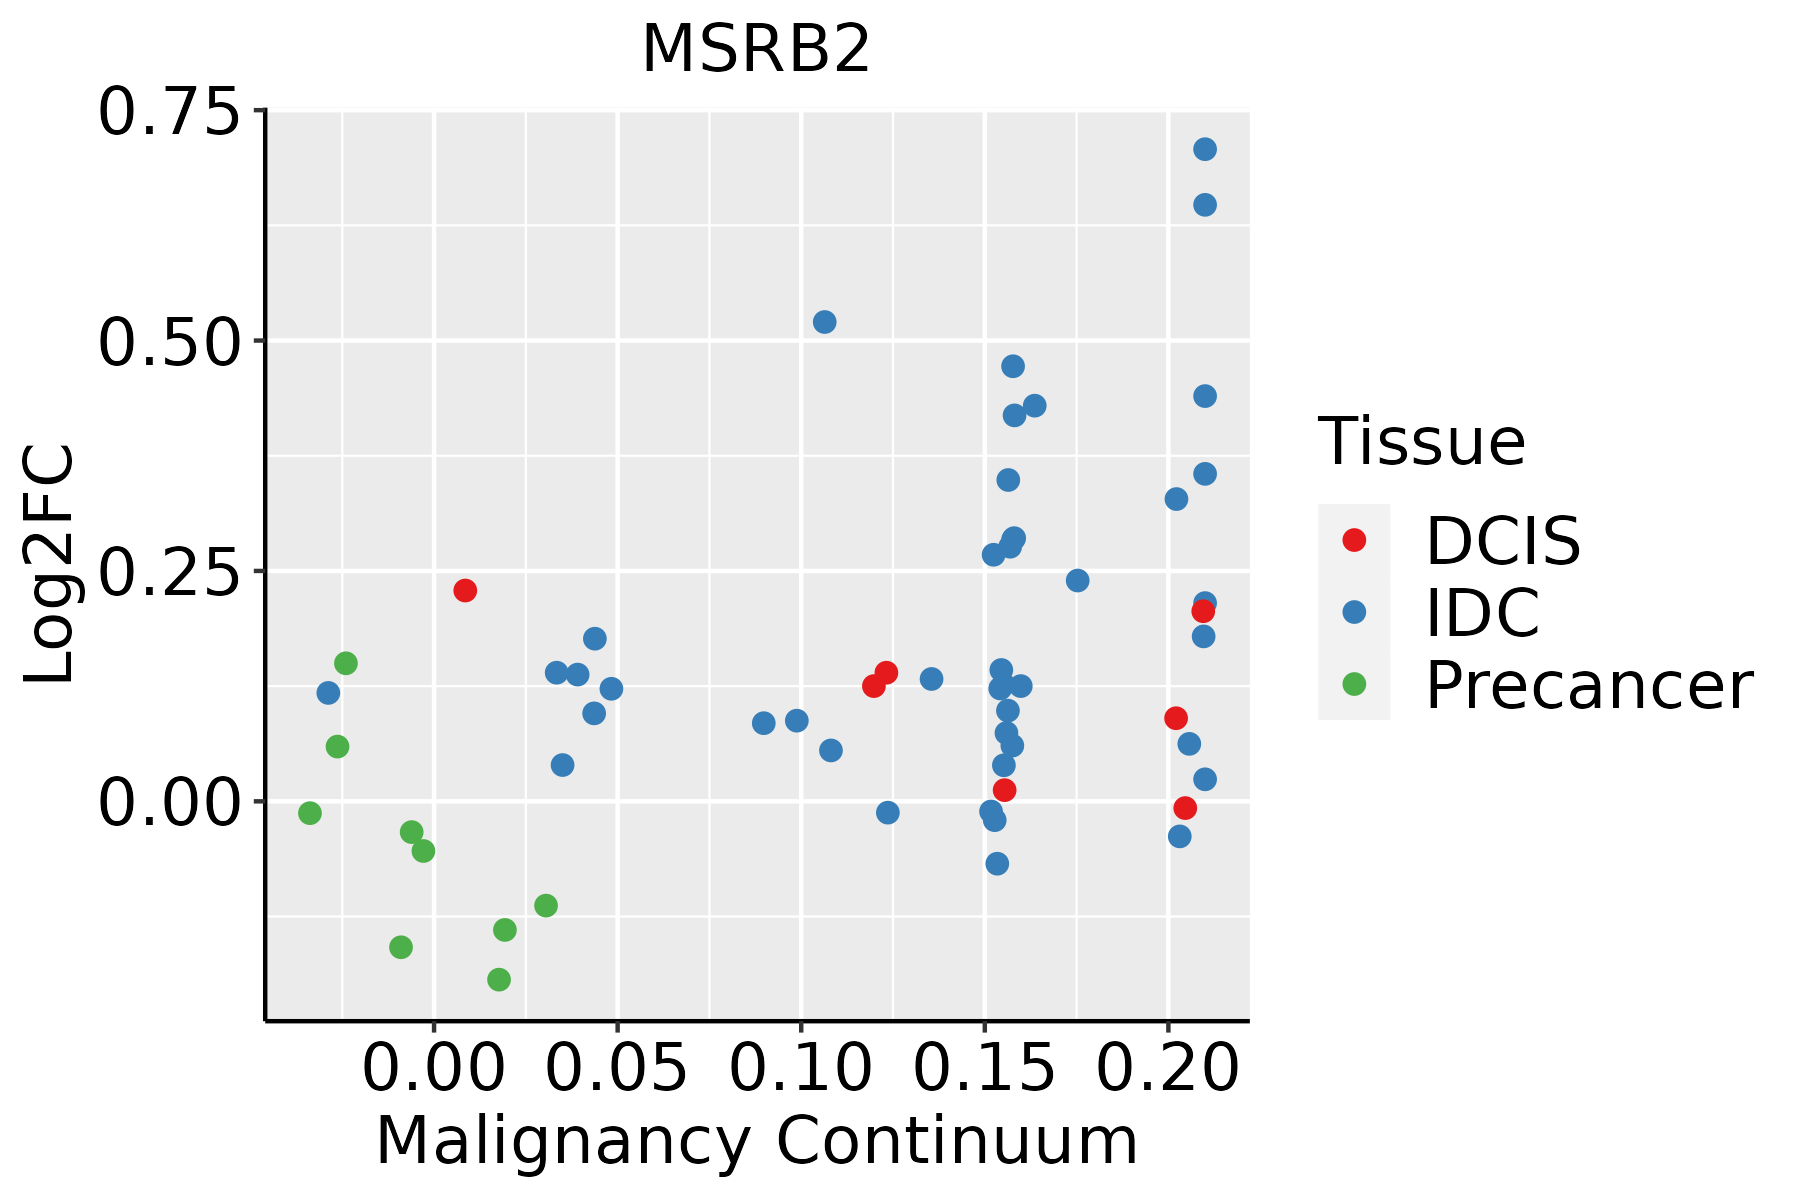 | IDC: Invasive ductal carcinoma |
| DCIS: Ductal carcinoma in situ | ||
| Precancer(BRCA1-mut): Precancerous lesion from BRCA1 mutation carriers | ||
| Colorectum (GSE201348) |  | FAP: Familial adenomatous polyposis |
| CRC: Colorectal cancer | ||
| Colorectum (HTA11) |  | AD: Adenomas |
| SER: Sessile serrated lesions | ||
| MSI-H: Microsatellite-high colorectal cancer | ||
| MSS: Microsatellite stable colorectal cancer | ||
| Esophagus | 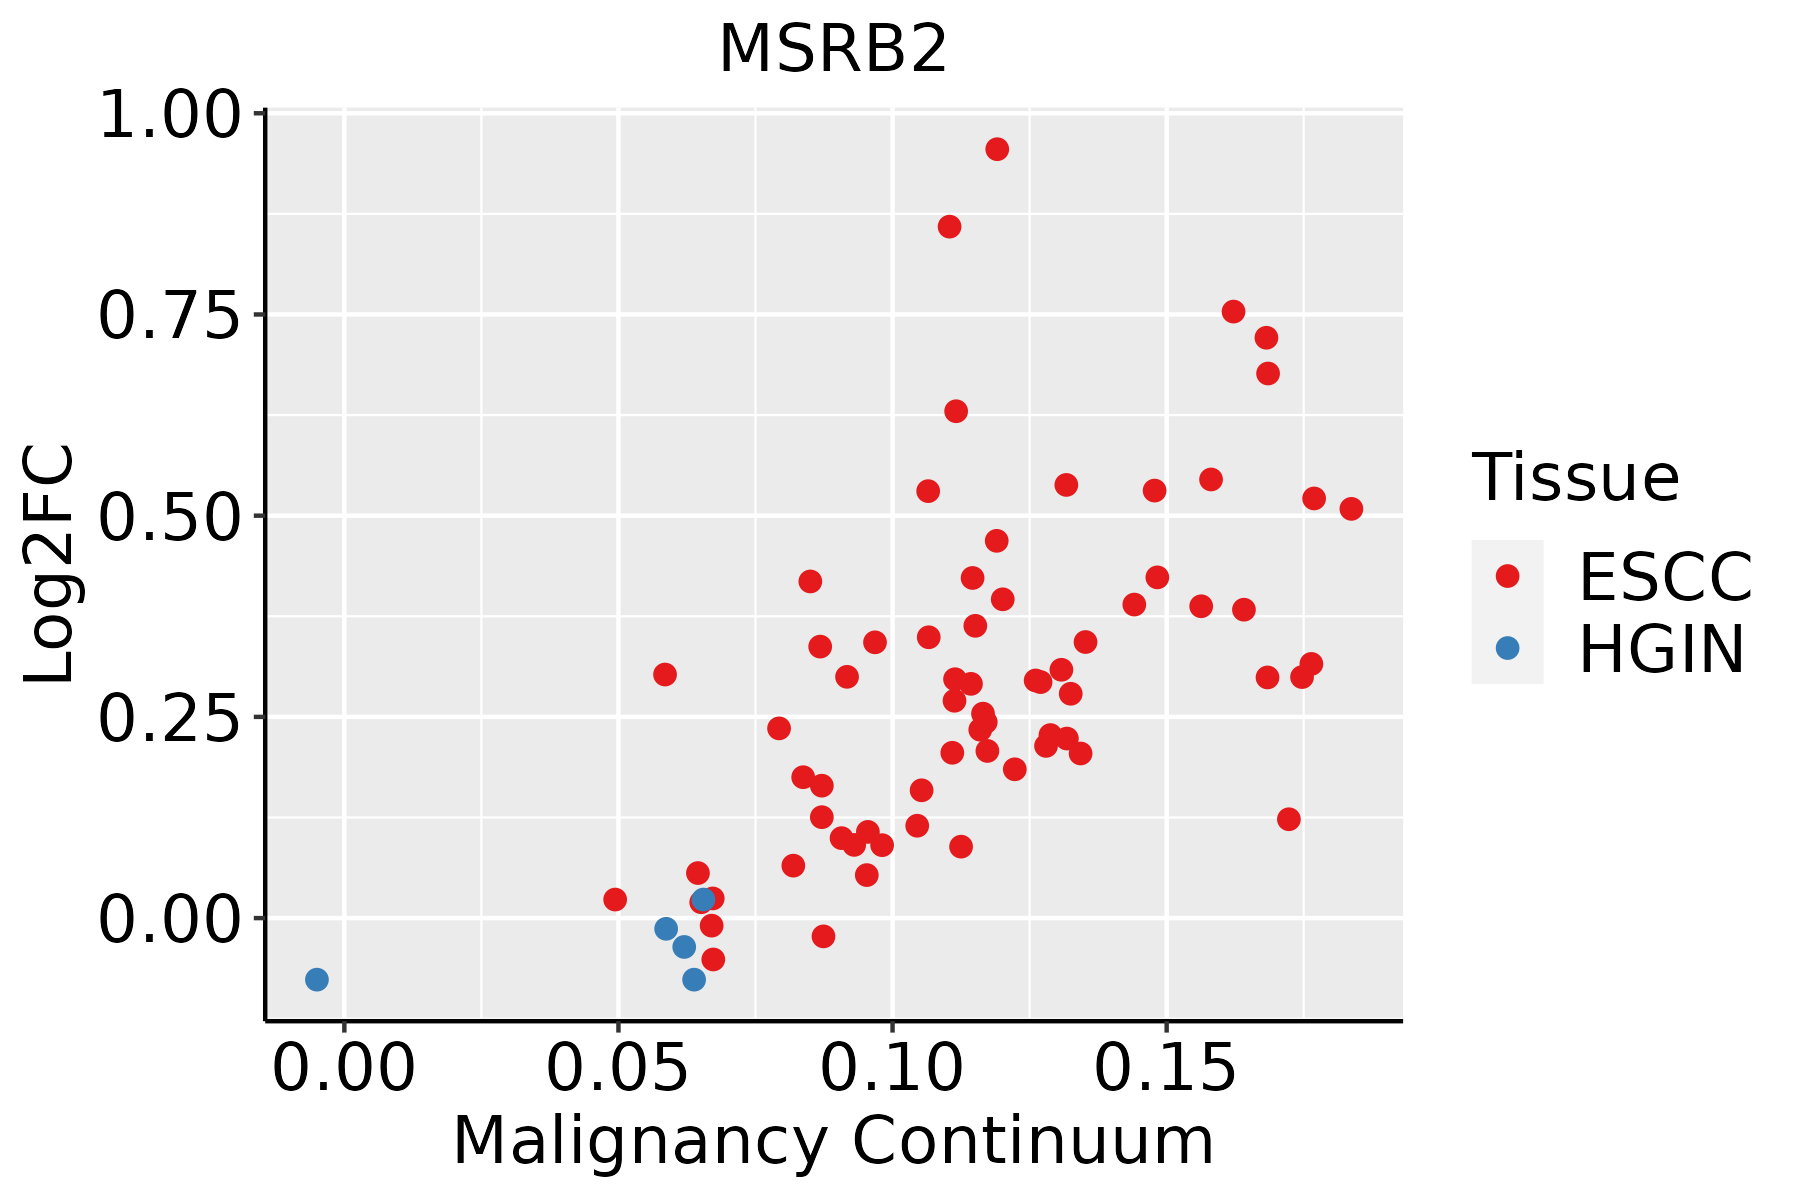 | ESCC: Esophageal squamous cell carcinoma |
| HGIN: High-grade intraepithelial neoplasias | ||
| LGIN: Low-grade intraepithelial neoplasias | ||
| Liver | 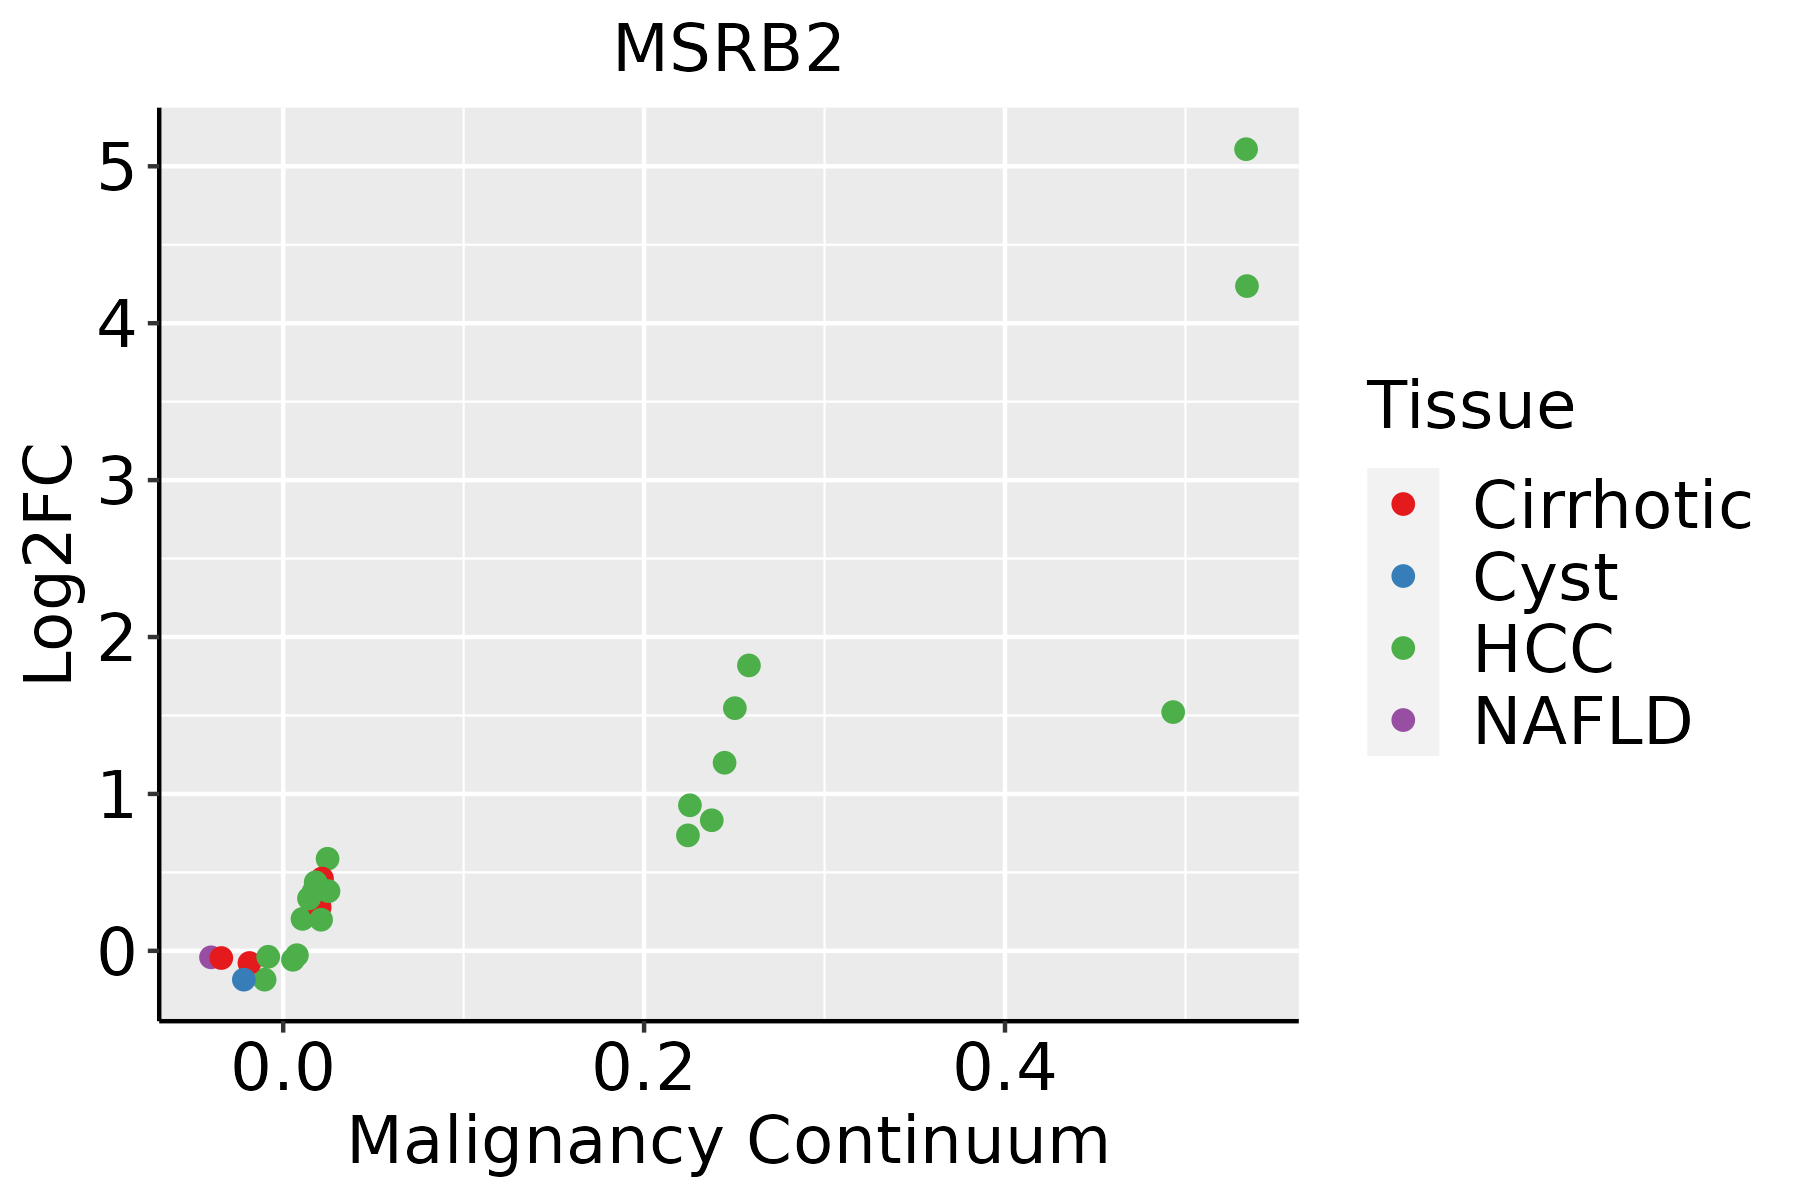 | HCC: Hepatocellular carcinoma |
| NAFLD: Non-alcoholic fatty liver disease | ||
| Oral Cavity |  | EOLP: Erosive Oral lichen planus |
| LP: leukoplakia | ||
| NEOLP: Non-erosive oral lichen planus | ||
| OSCC: Oral squamous cell carcinoma | ||
| Prostate | 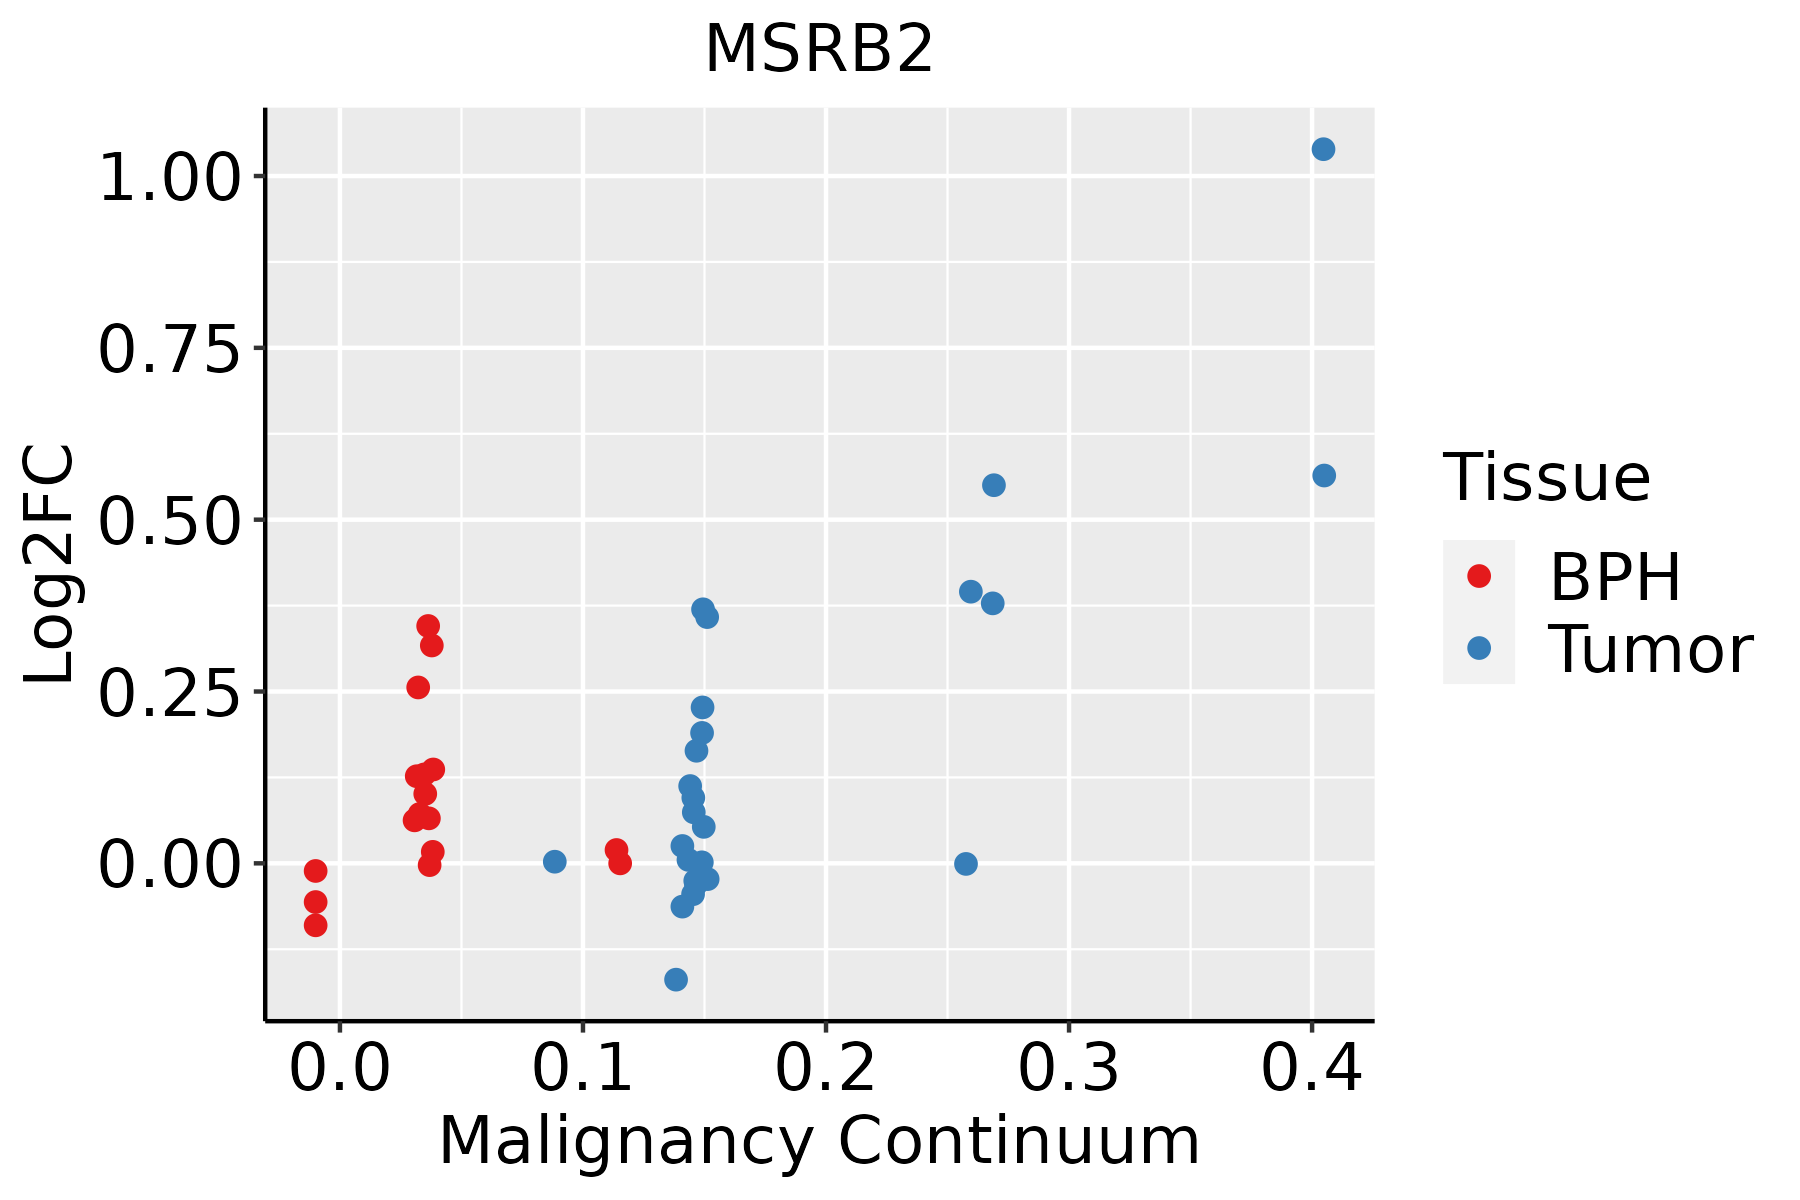 | BPH: Benign Prostatic Hyperplasia |
| Skin | 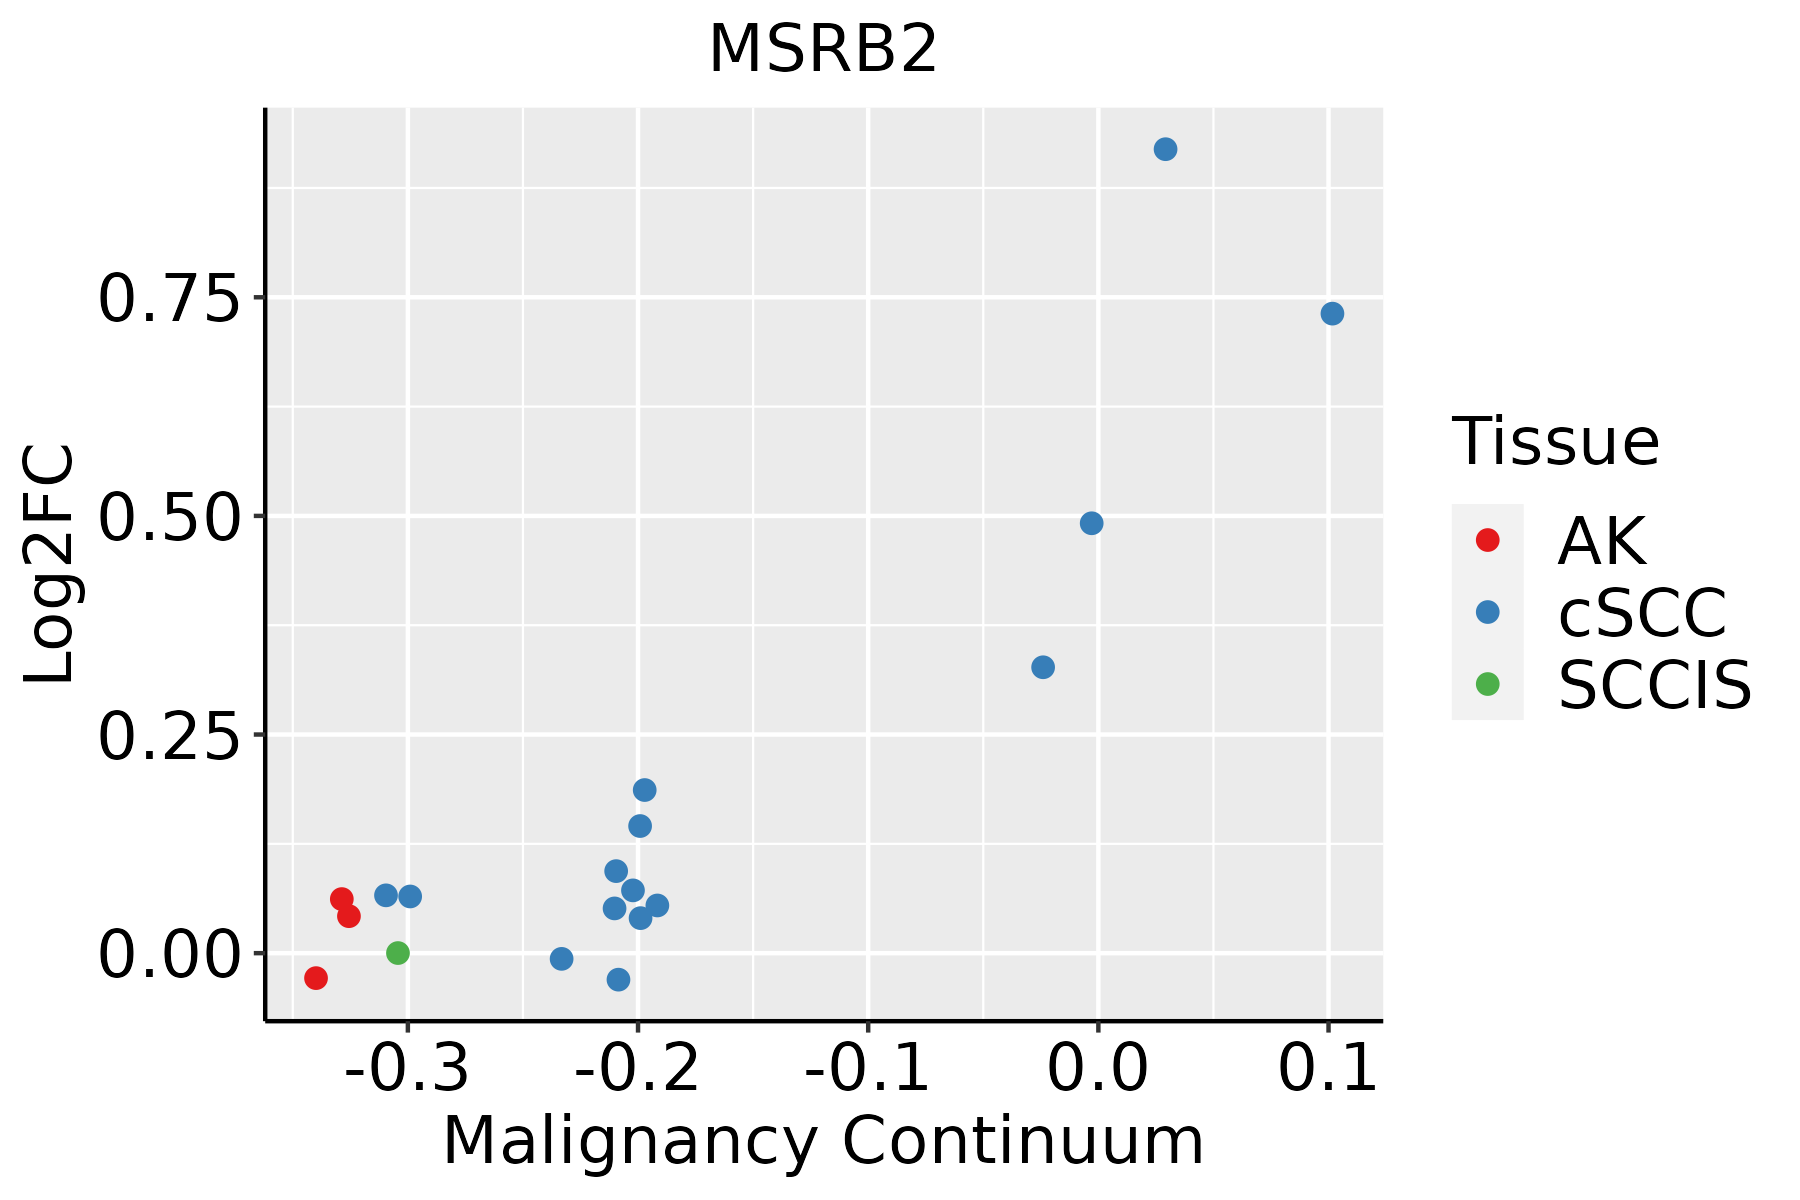 | AK: Actinic keratosis |
| cSCC: Cutaneous squamous cell carcinoma | ||
| SCCIS:squamous cell carcinoma in situ | ||
| Thyroid |  | ATC: Anaplastic thyroid cancer |
| HT: Hashimoto's thyroiditis | ||
| PTC: Papillary thyroid cancer |
| ∗log2FC in expression of this searched gene in stem-like cells from each diseased tissue sample relative to stem-like cells in normal samples in each tissue plotted against the malignancy continuum. Samples are colored based on if they are from different disease stage. |
Top |
Malignant transformation related pathway analysis |
| Find out the enriched GO biological processes and KEGG pathways involved in transition from healthy to precancer to cancer |
| Tissue | Disease Stage | Enriched GO biological Processes |
| Colorectum | AD |  |
| Colorectum | SER |  |
| Colorectum | MSS |  |
| Colorectum | MSI-H |  |
| Colorectum | FAP |  |
| ∗Top 15 enriched GO BP terms are showed in the bar plot of each disease state in each tissue. Each row represents a significant GO biological process which is colored according to the -log10(p.adjust). |
| Page: 1 2 3 4 5 6 7 8 9 |
| GO ID | Tissue | Disease Stage | Description | Gene Ratio | Bg Ratio | pvalue | p.adjust | Count |
| GO:000697914 | Breast | IDC | response to oxidative stress | 83/1434 | 446/18723 | 2.36e-14 | 7.06e-12 | 83 |
| GO:000701514 | Breast | IDC | actin filament organization | 55/1434 | 442/18723 | 2.45e-04 | 3.84e-03 | 55 |
| GO:00512589 | Breast | IDC | protein polymerization | 38/1434 | 297/18723 | 1.26e-03 | 1.34e-02 | 38 |
| GO:000697924 | Breast | DCIS | response to oxidative stress | 82/1390 | 446/18723 | 1.22e-14 | 3.85e-12 | 82 |
| GO:000701524 | Breast | DCIS | actin filament organization | 56/1390 | 442/18723 | 5.90e-05 | 1.19e-03 | 56 |
| GO:005125814 | Breast | DCIS | protein polymerization | 39/1390 | 297/18723 | 3.64e-04 | 5.15e-03 | 39 |
| GO:0007015 | Colorectum | AD | actin filament organization | 167/3918 | 442/18723 | 1.65e-16 | 7.94e-14 | 167 |
| GO:0008154 | Colorectum | AD | actin polymerization or depolymerization | 90/3918 | 218/18723 | 6.14e-12 | 8.23e-10 | 90 |
| GO:0030041 | Colorectum | AD | actin filament polymerization | 81/3918 | 191/18723 | 1.35e-11 | 1.69e-09 | 81 |
| GO:0051258 | Colorectum | AD | protein polymerization | 112/3918 | 297/18723 | 1.85e-11 | 2.27e-09 | 112 |
| GO:0006979 | Colorectum | AD | response to oxidative stress | 145/3918 | 446/18723 | 5.16e-09 | 3.23e-07 | 145 |
| GO:00070152 | Colorectum | MSS | actin filament organization | 146/3467 | 442/18723 | 1.16e-13 | 2.67e-11 | 146 |
| GO:00081542 | Colorectum | MSS | actin polymerization or depolymerization | 79/3467 | 218/18723 | 4.14e-10 | 3.49e-08 | 79 |
| GO:00300412 | Colorectum | MSS | actin filament polymerization | 71/3467 | 191/18723 | 8.77e-10 | 6.92e-08 | 71 |
| GO:00512582 | Colorectum | MSS | protein polymerization | 97/3467 | 297/18723 | 2.98e-09 | 2.07e-07 | 97 |
| GO:00069792 | Colorectum | MSS | response to oxidative stress | 128/3467 | 446/18723 | 7.65e-08 | 3.81e-06 | 128 |
| GO:0006979111 | Esophagus | ESCC | response to oxidative stress | 303/8552 | 446/18723 | 7.15e-22 | 1.30e-19 | 303 |
| GO:0051258111 | Esophagus | ESCC | protein polymerization | 183/8552 | 297/18723 | 1.94e-08 | 3.75e-07 | 183 |
| GO:000701527 | Esophagus | ESCC | actin filament organization | 259/8552 | 442/18723 | 2.37e-08 | 4.50e-07 | 259 |
| GO:000815420 | Esophagus | ESCC | actin polymerization or depolymerization | 130/8552 | 218/18723 | 2.19e-05 | 1.88e-04 | 130 |
| Page: 1 2 3 4 |
| Pathway ID | Tissue | Disease Stage | Description | Gene Ratio | Bg Ratio | pvalue | p.adjust | qvalue | Count |
| Page: 1 |
Top |
Cell-cell communication analysis |
| Identification of potential cell-cell interactions between two cell types and their ligand-receptor pairs for different disease states |
| Ligand | Receptor | LRpair | Pathway | Tissue | Disease Stage |
| Page: 1 |
Top |
Single-cell gene regulatory network inference analysis |
| Find out the significant the regulons (TFs) and the target genes of each regulon across cell types for different disease states |
| TF | Cell Type | Tissue | Disease Stage | Target Gene | RSS | Regulon Activity |
| ∗The dot plots of a searched regulon are shown for all cell subpopulations in each disease state of each tissue based on the regulon specific score inferred using pySCENIC and by calculating the average expression. |
| Page: 1 |
Top |
Somatic mutation of malignant transformation related genes |
| Annotation of somatic variants for genes involved in malignant transformation |
| Hugo Symbol | Variant Class | Variant Classification | dbSNP RS | HGVSc | HGVSp | HGVSp Short | SWISSPROT | BIOTYPE | SIFT | PolyPhen | Tumor Sample Barcode | Tissue | Histology | Sex | Age | Stage | Therapy Types | Drugs | Outcome |
| MSRB2 | SNV | Missense_Mutation | rs750260291 | c.407N>T | p.Ser136Leu | p.S136L | Q9Y3D2 | protein_coding | deleterious(0.01) | probably_damaging(0.974) | TCGA-CV-7568-01 | Oral cavity | head & neck squamous cell carcinoma | Female | <65 | I/II | Unknown | Unknown | SD |
| MSRB2 | deletion | Frame_Shift_Del | novel | c.169delN | p.Lys57AsnfsTer2 | p.K57Nfs*2 | Q9Y3D2 | protein_coding | TCGA-CG-4460-01 | Stomach | stomach adenocarcinoma | Female | >=65 | III/IV | Chemotherapy | capecitabine | PD |
| Page: 1 2 3 |
Top |
Related drugs of malignant transformation related genes |
| Identification of chemicals and drugs interact with genes involved in malignant transfromation |
| (DGIdb 4.0) |
| Entrez ID | Symbol | Category | Interaction Types | Drug Claim Name | Drug Name | PMIDs |
| Page: 1 |

Copyright 2023-Present -The University of Texas Health Science Center at Houston |