
|
|||||
|
 | |
| |
| |
| |
| |
| |
|
Gene: JAM2 |
Gene summary for JAM2 |
| Gene information | Species | Human | Gene symbol | JAM2 | Gene ID | 58494 |
| Gene name | junctional adhesion molecule 2 | |
| Gene Alias | C21orf43 | |
| Cytomap | 21q21.3 | |
| Gene Type | protein-coding | GO ID | GO:0000003 | UniProtAcc | P57087 |
Top |
Malignant transformation analysis |
| Identification of the aberrant gene expression in precancerous and cancerous lesions by comparing the gene expression of stem-like cells in diseased tissues with normal stem cells |
| Entrez ID | Symbol | Replicates | Species | Organ | Tissue | Adj P-value | Log2FC | Malignancy |
| 58494 | JAM2 | HCC1 | Human | Liver | HCC | 7.89e-03 | 1.37e+00 | 0.5336 |
| 58494 | JAM2 | HCC2 | Human | Liver | HCC | 1.66e-05 | 9.31e-01 | 0.5341 |
| 58494 | JAM2 | ATC09 | Human | Thyroid | ATC | 2.26e-06 | 2.63e-01 | 0.2871 |
| 58494 | JAM2 | ATC12 | Human | Thyroid | ATC | 1.36e-12 | 2.71e-01 | 0.34 |
| 58494 | JAM2 | ATC13 | Human | Thyroid | ATC | 9.79e-34 | 8.87e-01 | 0.34 |
| 58494 | JAM2 | ATC1 | Human | Thyroid | ATC | 4.49e-08 | 3.37e-01 | 0.2878 |
| 58494 | JAM2 | ATC4 | Human | Thyroid | ATC | 3.34e-18 | 3.88e-01 | 0.34 |
| 58494 | JAM2 | ATC5 | Human | Thyroid | ATC | 1.23e-44 | 9.57e-01 | 0.34 |
| Page: 1 |
| Tissue | Expression Dynamics | Abbreviation |
| Liver |  | HCC: Hepatocellular carcinoma |
| NAFLD: Non-alcoholic fatty liver disease | ||
| Thyroid | 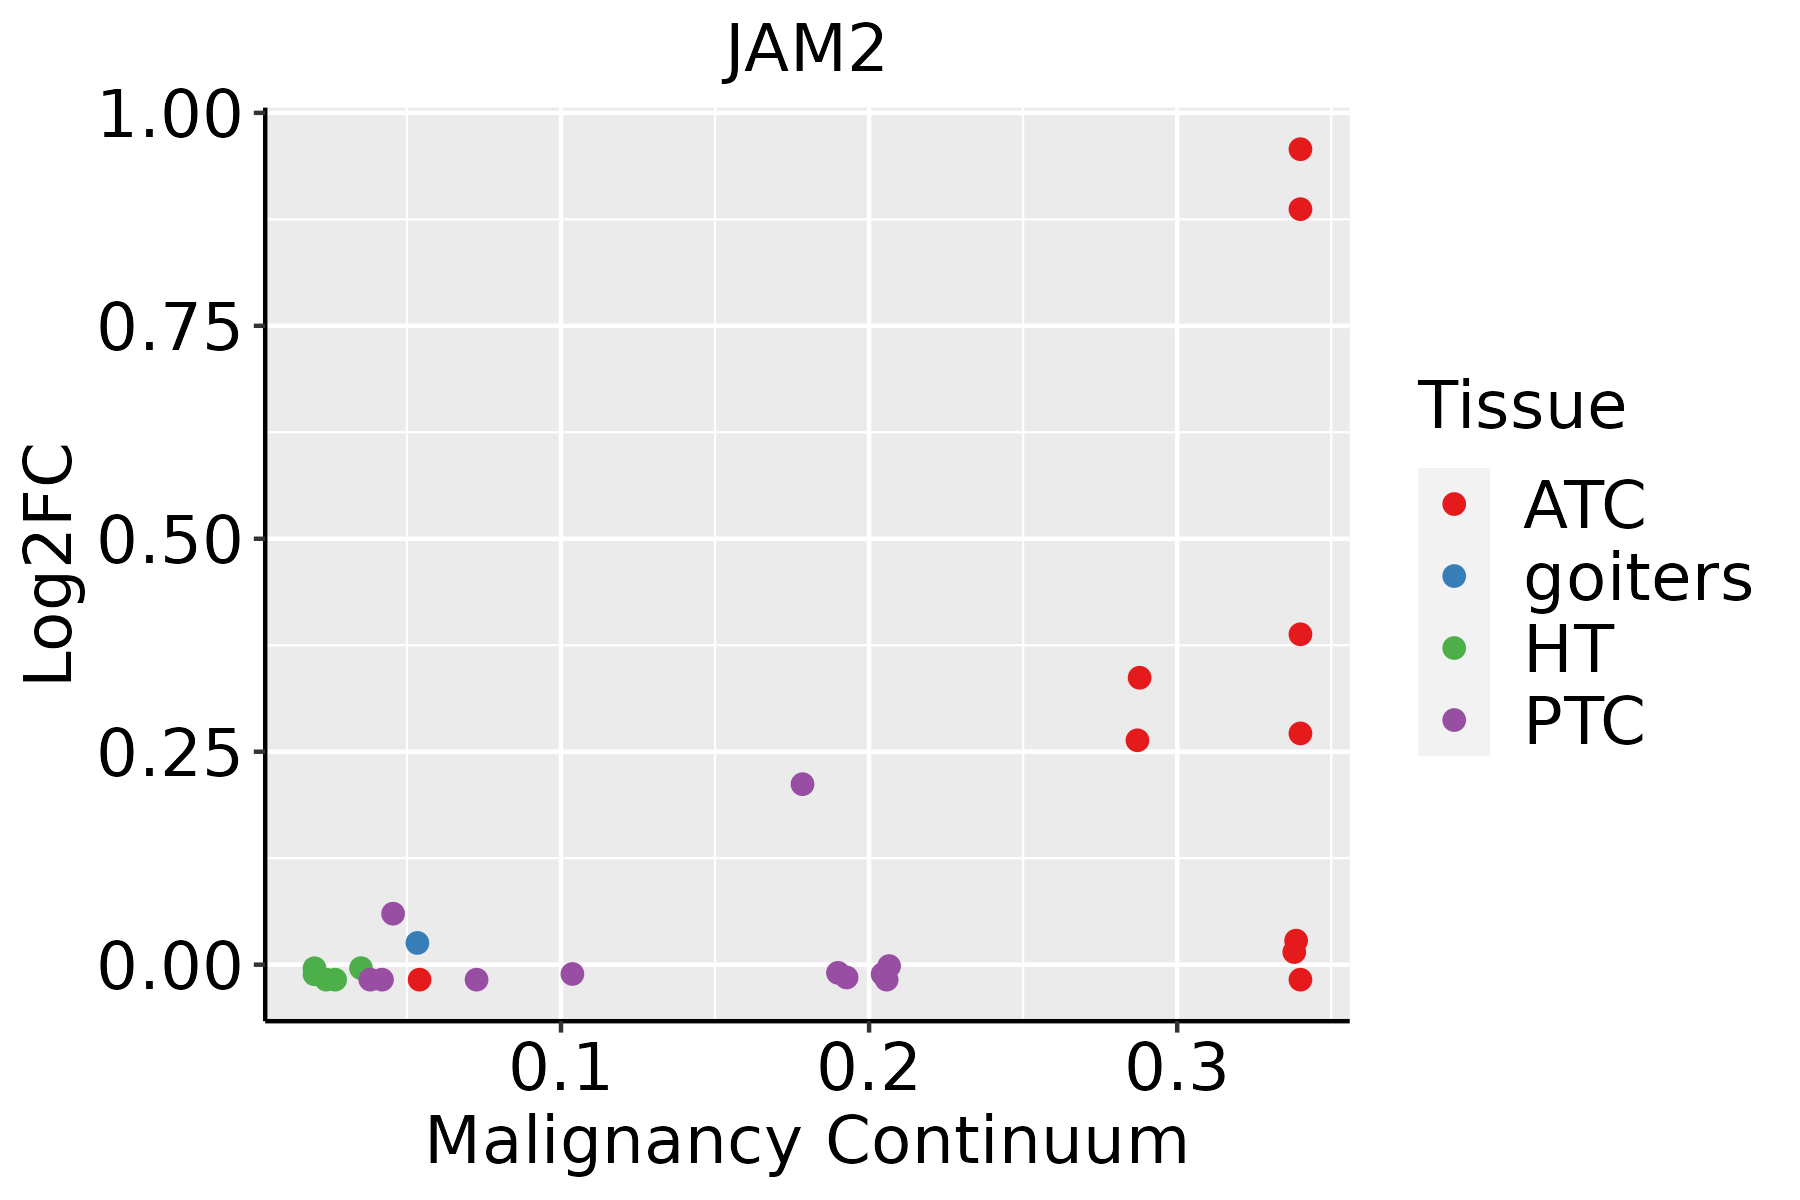 | ATC: Anaplastic thyroid cancer |
| HT: Hashimoto's thyroiditis | ||
| PTC: Papillary thyroid cancer |
| ∗log2FC in expression of this searched gene in stem-like cells from each diseased tissue sample relative to stem-like cells in normal samples in each tissue plotted against the malignancy continuum. Samples are colored based on if they are from different disease stage. |
Top |
Malignant transformation related pathway analysis |
| Find out the enriched GO biological processes and KEGG pathways involved in transition from healthy to precancer to cancer |
| Tissue | Disease Stage | Enriched GO biological Processes |
| Colorectum | AD |  |
| Colorectum | SER |  |
| Colorectum | MSS |  |
| Colorectum | MSI-H |  |
| Colorectum | FAP |  |
| ∗Top 15 enriched GO BP terms are showed in the bar plot of each disease state in each tissue. Each row represents a significant GO biological process which is colored according to the -log10(p.adjust). |
| Page: 1 2 3 4 5 6 7 8 9 |
| GO ID | Tissue | Disease Stage | Description | Gene Ratio | Bg Ratio | pvalue | p.adjust | Count |
| GO:00072721 | Liver | HCC | ensheathment of neurons | 72/7958 | 136/18723 | 8.87e-03 | 3.44e-02 | 72 |
| GO:00083661 | Liver | HCC | axon ensheathment | 72/7958 | 136/18723 | 8.87e-03 | 3.44e-02 | 72 |
| GO:00425521 | Liver | HCC | myelination | 71/7958 | 134/18723 | 9.08e-03 | 3.49e-02 | 71 |
| GO:005196014 | Thyroid | ATC | regulation of nervous system development | 195/6293 | 443/18723 | 2.62e-06 | 3.06e-05 | 195 |
| GO:004269216 | Thyroid | ATC | muscle cell differentiation | 165/6293 | 384/18723 | 7.17e-05 | 5.46e-04 | 165 |
| GO:000268719 | Thyroid | ATC | positive regulation of leukocyte migration | 65/6293 | 135/18723 | 3.18e-04 | 1.99e-03 | 65 |
| GO:003563322 | Thyroid | ATC | maintenance of blood-brain barrier | 22/6293 | 35/18723 | 3.74e-04 | 2.28e-03 | 22 |
| GO:00425526 | Thyroid | ATC | myelination | 62/6293 | 134/18723 | 1.54e-03 | 7.84e-03 | 62 |
| GO:005114617 | Thyroid | ATC | striated muscle cell differentiation | 119/6293 | 283/18723 | 1.74e-03 | 8.70e-03 | 119 |
| GO:00072726 | Thyroid | ATC | ensheathment of neurons | 62/6293 | 136/18723 | 2.39e-03 | 1.11e-02 | 62 |
| GO:00083666 | Thyroid | ATC | axon ensheathment | 62/6293 | 136/18723 | 2.39e-03 | 1.11e-02 | 62 |
| GO:000268519 | Thyroid | ATC | regulation of leukocyte migration | 90/6293 | 210/18723 | 3.11e-03 | 1.40e-02 | 90 |
| GO:007167516 | Thyroid | ATC | regulation of mononuclear cell migration | 52/6293 | 115/18723 | 6.24e-03 | 2.50e-02 | 52 |
| GO:20004035 | Thyroid | ATC | positive regulation of lymphocyte migration | 19/6293 | 35/18723 | 9.36e-03 | 3.44e-02 | 19 |
| GO:00716778 | Thyroid | ATC | positive regulation of mononuclear cell migration | 31/6293 | 65/18723 | 1.28e-02 | 4.50e-02 | 31 |
| Page: 1 |
| Pathway ID | Tissue | Disease Stage | Description | Gene Ratio | Bg Ratio | pvalue | p.adjust | qvalue | Count |
| hsa0453042 | Liver | HCC | Tight junction | 110/4020 | 169/8465 | 2.45e-06 | 2.28e-05 | 1.27e-05 | 110 |
| hsa051202 | Liver | HCC | Epithelial cell signaling in Helicobacter pylori infection | 50/4020 | 70/8465 | 3.96e-05 | 2.16e-04 | 1.20e-04 | 50 |
| hsa0467042 | Liver | HCC | Leukocyte transendothelial migration | 68/4020 | 114/8465 | 5.79e-03 | 1.64e-02 | 9.15e-03 | 68 |
| hsa0453052 | Liver | HCC | Tight junction | 110/4020 | 169/8465 | 2.45e-06 | 2.28e-05 | 1.27e-05 | 110 |
| hsa051203 | Liver | HCC | Epithelial cell signaling in Helicobacter pylori infection | 50/4020 | 70/8465 | 3.96e-05 | 2.16e-04 | 1.20e-04 | 50 |
| hsa0467052 | Liver | HCC | Leukocyte transendothelial migration | 68/4020 | 114/8465 | 5.79e-03 | 1.64e-02 | 9.15e-03 | 68 |
| Page: 1 |
Top |
Cell-cell communication analysis |
| Identification of potential cell-cell interactions between two cell types and their ligand-receptor pairs for different disease states |
| Ligand | Receptor | LRpair | Pathway | Tissue | Disease Stage |
| JAM2 | JAM3 | JAM2_JAM3 | JAM | Breast | ADJ |
| F11R | JAM2 | F11R_JAM2 | JAM | Breast | ADJ |
| JAM2 | F11R | JAM2_F11R | JAM | Breast | ADJ |
| JAM2 | JAM2 | JAM2_JAM2 | JAM | Breast | ADJ |
| JAM3 | JAM2 | JAM3_JAM2 | JAM | Breast | ADJ |
| JAM2 | ITGAV_ITGB1 | JAM2_ITGAV_ITGB1 | JAM | Breast | DCIS |
| JAM2 | JAM3 | JAM2_JAM3 | JAM | Breast | DCIS |
| F11R | JAM2 | F11R_JAM2 | JAM | Breast | DCIS |
| JAM2 | F11R | JAM2_F11R | JAM | Breast | DCIS |
| JAM2 | JAM2 | JAM2_JAM2 | JAM | Breast | DCIS |
| JAM3 | JAM2 | JAM3_JAM2 | JAM | Breast | DCIS |
| JAM2 | ITGAV_ITGB1 | JAM2_ITGAV_ITGB1 | JAM | Breast | Healthy |
| JAM2 | JAM3 | JAM2_JAM3 | JAM | Breast | Healthy |
| JAM2 | JAM2 | JAM2_JAM2 | JAM | Breast | Healthy |
| JAM3 | JAM2 | JAM3_JAM2 | JAM | Breast | Healthy |
| JAM2 | ITGA3_ITGB1 | JAM2_ITGA3_ITGB1 | JAM | Cervix | ADJ |
| JAM2 | ITGAV_ITGB1 | JAM2_ITGAV_ITGB1 | JAM | Cervix | ADJ |
| F11R | JAM2 | F11R_JAM2 | JAM | Cervix | ADJ |
| JAM2 | F11R | JAM2_F11R | JAM | Cervix | ADJ |
| JAM2 | JAM2 | JAM2_JAM2 | JAM | Cervix | ADJ |
| Page: 1 2 3 4 5 6 7 8 |
Top |
Single-cell gene regulatory network inference analysis |
| Find out the significant the regulons (TFs) and the target genes of each regulon across cell types for different disease states |
| TF | Cell Type | Tissue | Disease Stage | Target Gene | RSS | Regulon Activity |
| ∗The dot plots of a searched regulon are shown for all cell subpopulations in each disease state of each tissue based on the regulon specific score inferred using pySCENIC and by calculating the average expression. |
| Page: 1 |
Top |
Somatic mutation of malignant transformation related genes |
| Annotation of somatic variants for genes involved in malignant transformation |
| Hugo Symbol | Variant Class | Variant Classification | dbSNP RS | HGVSc | HGVSp | HGVSp Short | SWISSPROT | BIOTYPE | SIFT | PolyPhen | Tumor Sample Barcode | Tissue | Histology | Sex | Age | Stage | Therapy Types | Drugs | Outcome |
| JAM2 | SNV | Missense_Mutation | novel | c.833C>A | p.Ser278Tyr | p.S278Y | P57087 | protein_coding | tolerated(0.11) | possibly_damaging(0.891) | TCGA-E6-A1M0-01 | Endometrium | uterine corpus endometrioid carcinoma | Female | <65 | III/IV | Chemotherapy | carboplatin | SD |
| JAM2 | SNV | Missense_Mutation | novel | c.53T>C | p.Val18Ala | p.V18A | P57087 | protein_coding | tolerated(0.24) | possibly_damaging(0.641) | TCGA-EO-A22R-01 | Endometrium | uterine corpus endometrioid carcinoma | Female | <65 | I/II | Unknown | Unknown | SD |
| JAM2 | SNV | Missense_Mutation | novel | c.101A>G | p.Asp34Gly | p.D34G | P57087 | protein_coding | tolerated(0.15) | benign(0.041) | TCGA-EO-A22R-01 | Endometrium | uterine corpus endometrioid carcinoma | Female | <65 | I/II | Unknown | Unknown | SD |
| JAM2 | SNV | Missense_Mutation | novel | c.162G>T | p.Lys54Asn | p.K54N | P57087 | protein_coding | deleterious(0.02) | possibly_damaging(0.733) | TCGA-EO-A22X-01 | Endometrium | uterine corpus endometrioid carcinoma | Female | <65 | III/IV | Unspecific | Carboplatin | Complete Response |
| JAM2 | SNV | Missense_Mutation | rs766898080 | c.667C>T | p.Arg223Cys | p.R223C | P57087 | protein_coding | deleterious(0) | possibly_damaging(0.888) | TCGA-EO-A22X-01 | Endometrium | uterine corpus endometrioid carcinoma | Female | <65 | III/IV | Unspecific | Carboplatin | Complete Response |
| JAM2 | SNV | Missense_Mutation | novel | c.855G>T | p.Met285Ile | p.M285I | P57087 | protein_coding | tolerated(0.37) | benign(0.005) | TCGA-EY-A1G8-01 | Endometrium | uterine corpus endometrioid carcinoma | Female | >=65 | I/II | Unknown | Unknown | SD |
| JAM2 | SNV | Missense_Mutation | c.262G>A | p.Glu88Lys | p.E88K | P57087 | protein_coding | tolerated(0.09) | probably_damaging(0.953) | TCGA-EY-A1GS-01 | Endometrium | uterine corpus endometrioid carcinoma | Female | >=65 | III/IV | Chemotherapy | taxol | PD | |
| JAM2 | insertion | Frame_Shift_Ins | novel | c.91_92insC | p.Asp34ArgfsTer49 | p.D34Rfs*49 | P57087 | protein_coding | TCGA-DF-A2KY-01 | Endometrium | uterine corpus endometrioid carcinoma | Female | <65 | III/IV | Chemotherapy | carboplatin | SD | ||
| JAM2 | SNV | Missense_Mutation | rs201705901 | c.712A>G | p.Ser238Gly | p.S238G | P57087 | protein_coding | tolerated(0.11) | benign(0.026) | TCGA-DD-A118-01 | Liver | liver hepatocellular carcinoma | Female | >=65 | I/II | Unknown | Unknown | PD |
| JAM2 | SNV | Missense_Mutation | c.218N>A | p.Val73Asp | p.V73D | P57087 | protein_coding | deleterious(0) | probably_damaging(0.998) | TCGA-UB-A7MB-01 | Liver | liver hepatocellular carcinoma | Male | <65 | I/II | Targeted Molecular therapy | sorafenib | PD |
| Page: 1 2 3 4 5 |
Top |
Related drugs of malignant transformation related genes |
| Identification of chemicals and drugs interact with genes involved in malignant transfromation |
| (DGIdb 4.0) |
| Entrez ID | Symbol | Category | Interaction Types | Drug Claim Name | Drug Name | PMIDs |
| Page: 1 |

Copyright 2023-Present -The University of Texas Health Science Center at Houston |