| Tissue | Expression Dynamics | Abbreviation |
| Breast |  | IDC: Invasive ductal carcinoma |
| DCIS: Ductal carcinoma in situ |
| Precancer(BRCA1-mut): Precancerous lesion from BRCA1 mutation carriers |
| Endometrium |  | AEH: Atypical endometrial hyperplasia |
| EEC: Endometrioid Cancer |
| Esophagus | 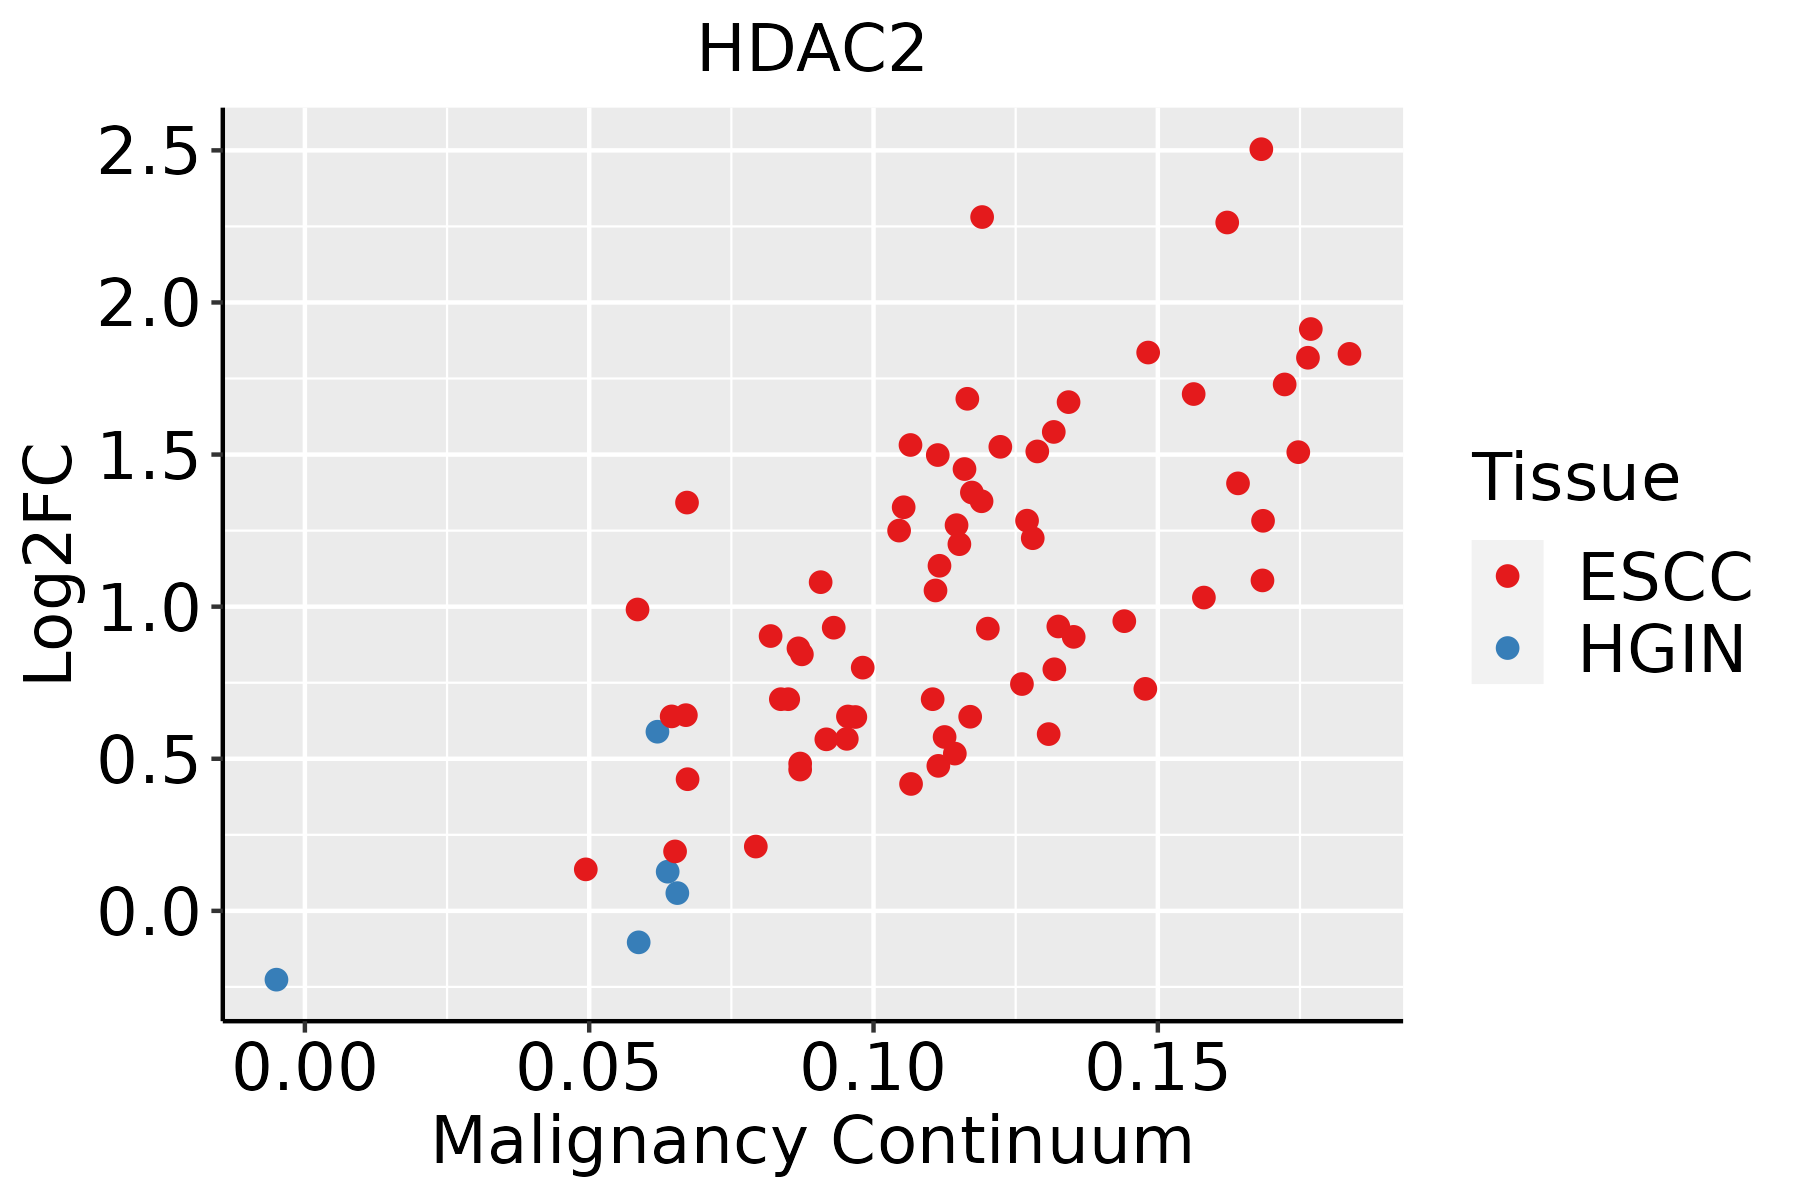 | ESCC: Esophageal squamous cell carcinoma |
| HGIN: High-grade intraepithelial neoplasias |
| LGIN: Low-grade intraepithelial neoplasias |
| Liver | 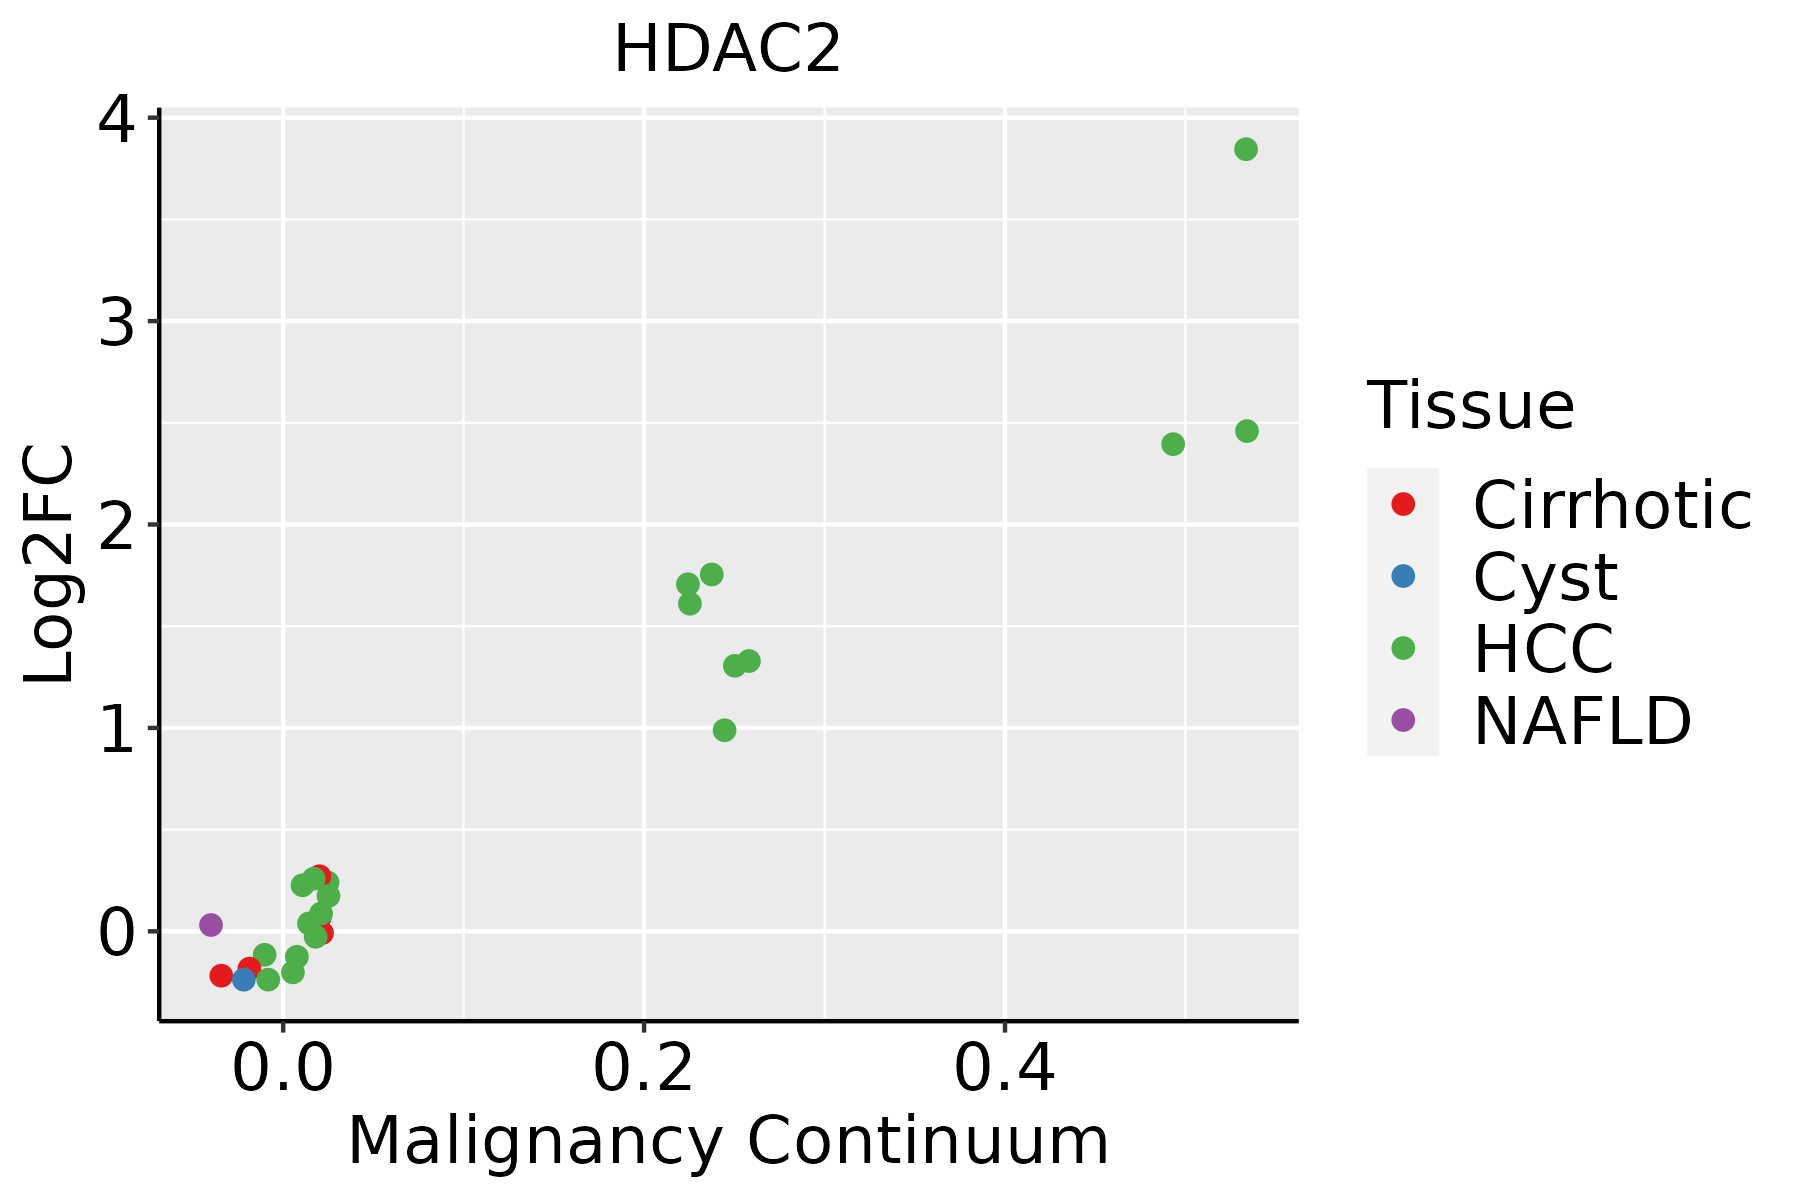 | HCC: Hepatocellular carcinoma |
| NAFLD: Non-alcoholic fatty liver disease |
| Oral Cavity | 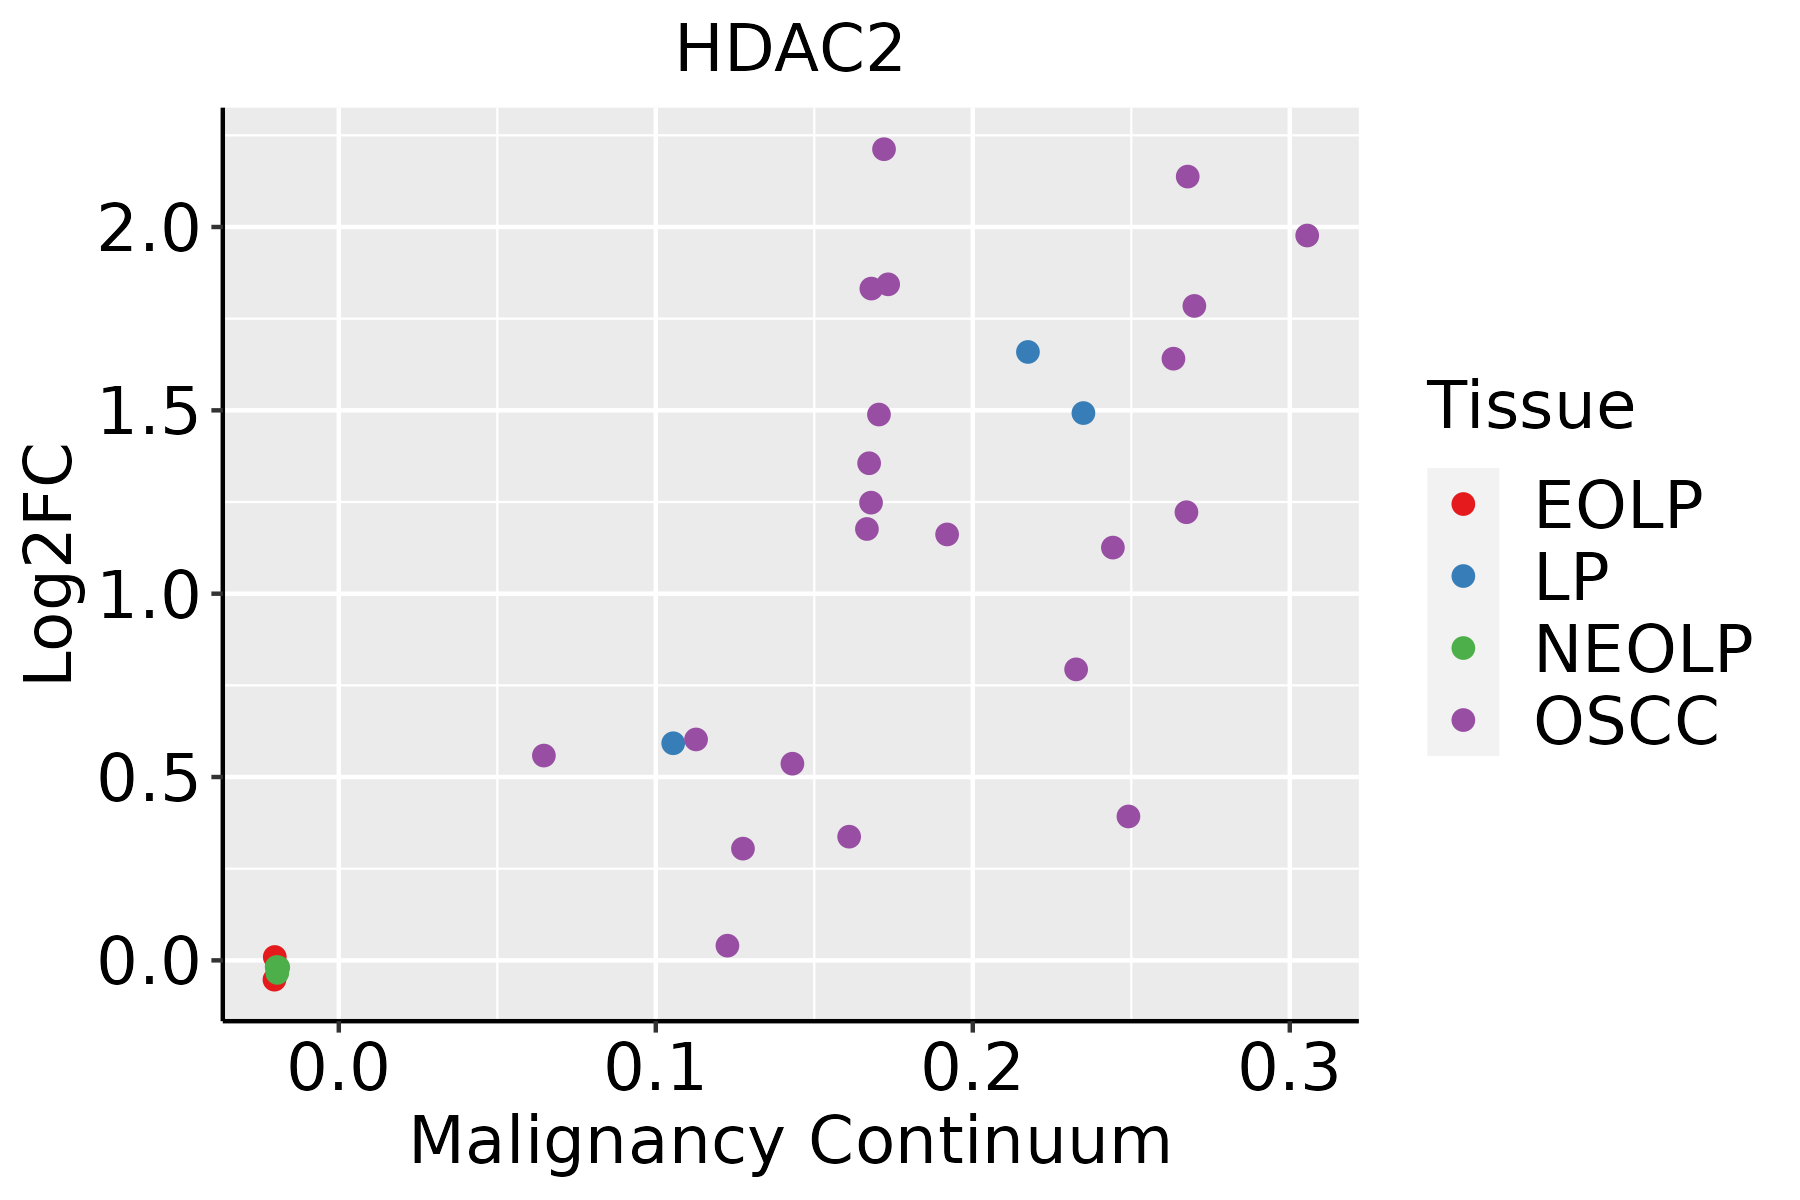 | EOLP: Erosive Oral lichen planus |
| LP: leukoplakia |
| NEOLP: Non-erosive oral lichen planus |
| OSCC: Oral squamous cell carcinoma |
| Prostate | 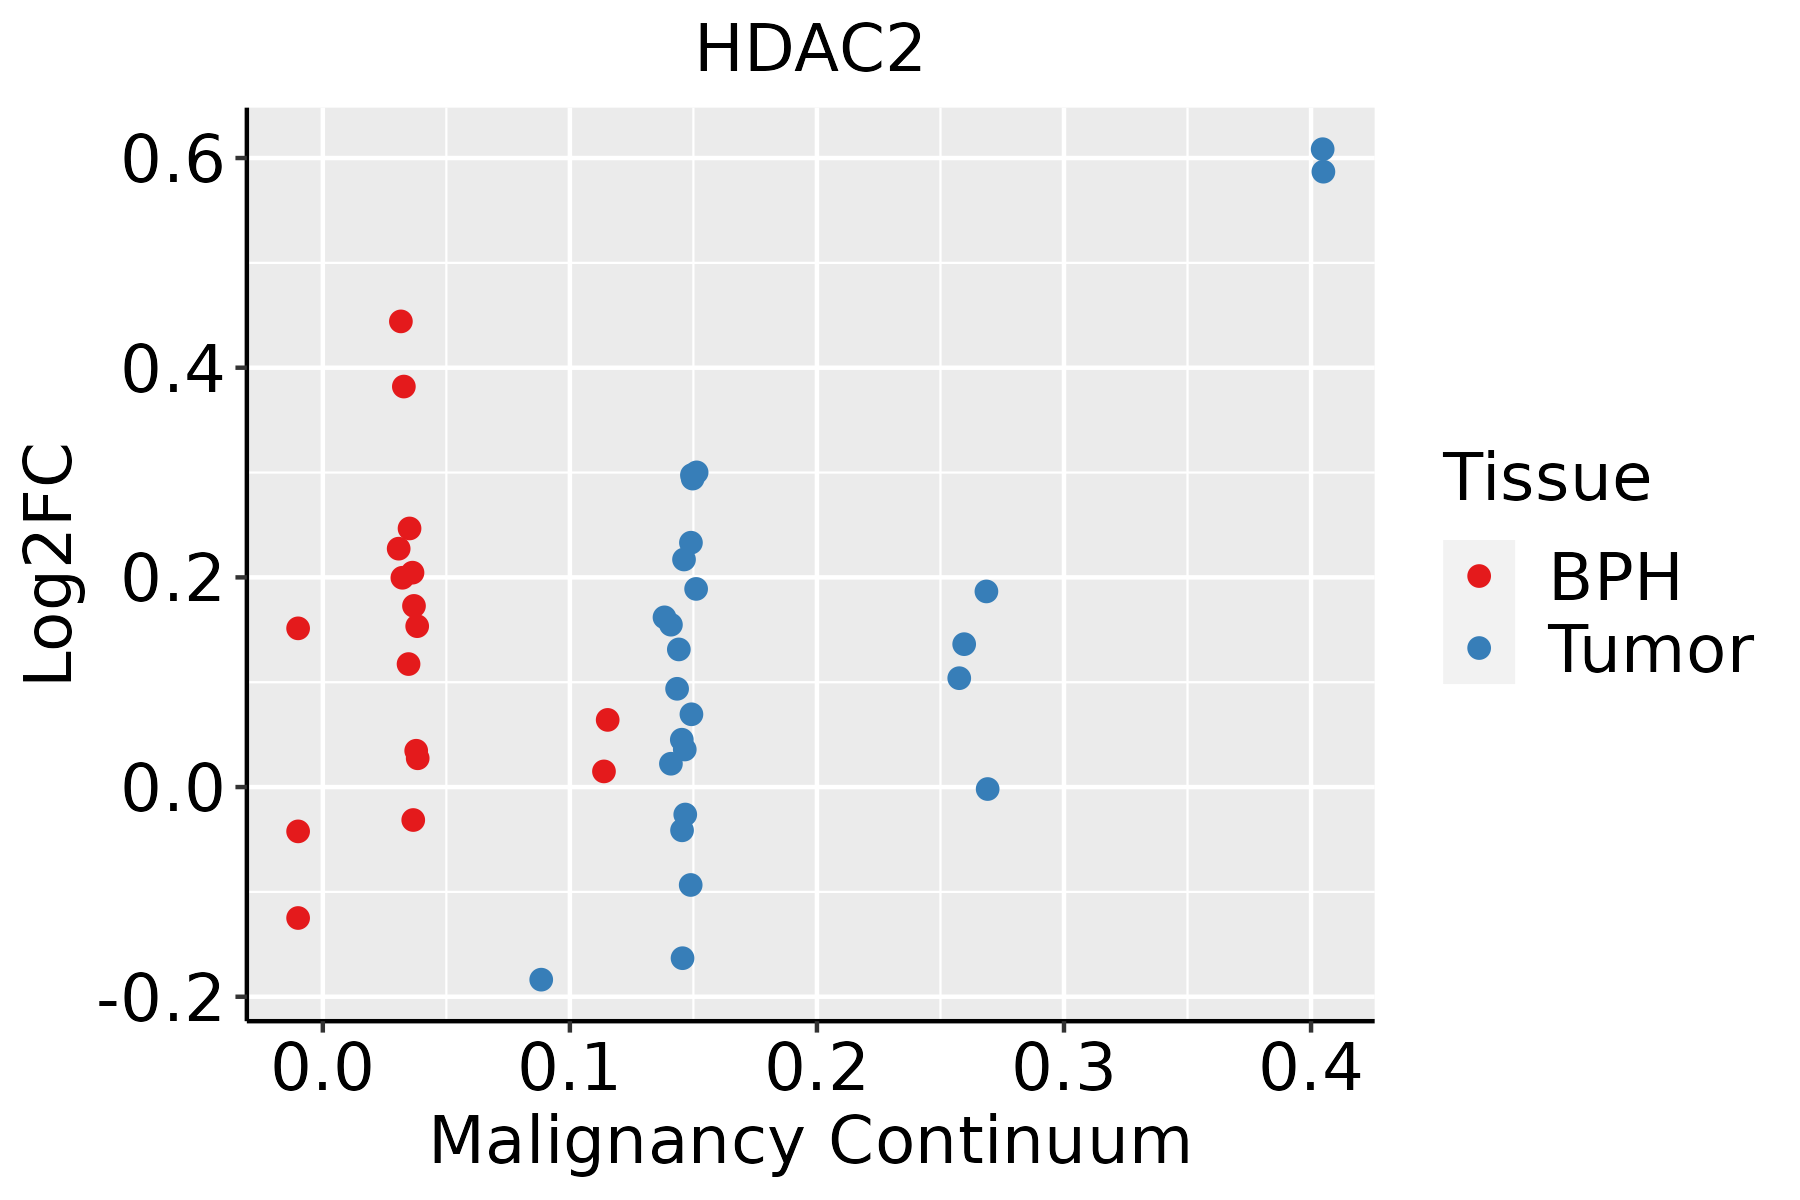 | BPH: Benign Prostatic Hyperplasia |
| Skin | 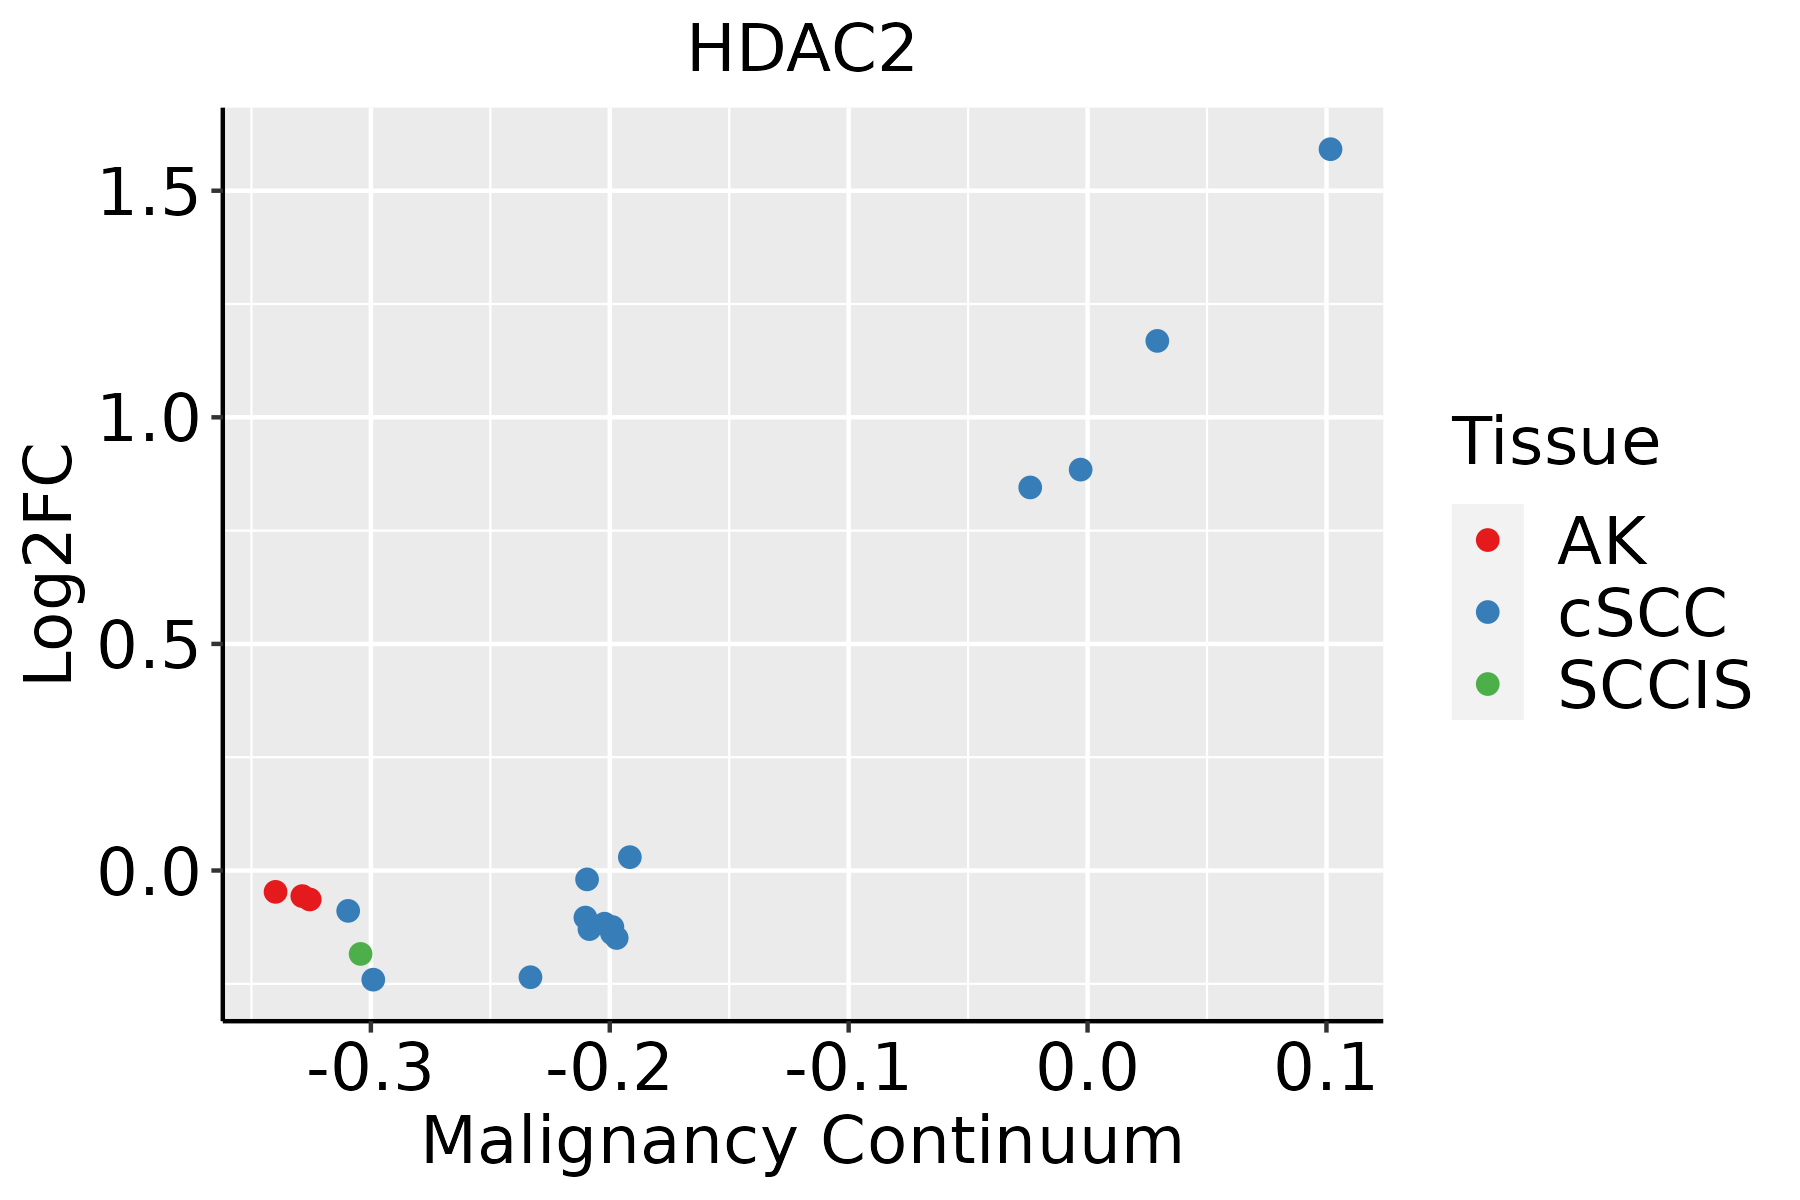 | AK: Actinic keratosis |
| cSCC: Cutaneous squamous cell carcinoma |
| SCCIS:squamous cell carcinoma in situ |
| Thyroid | 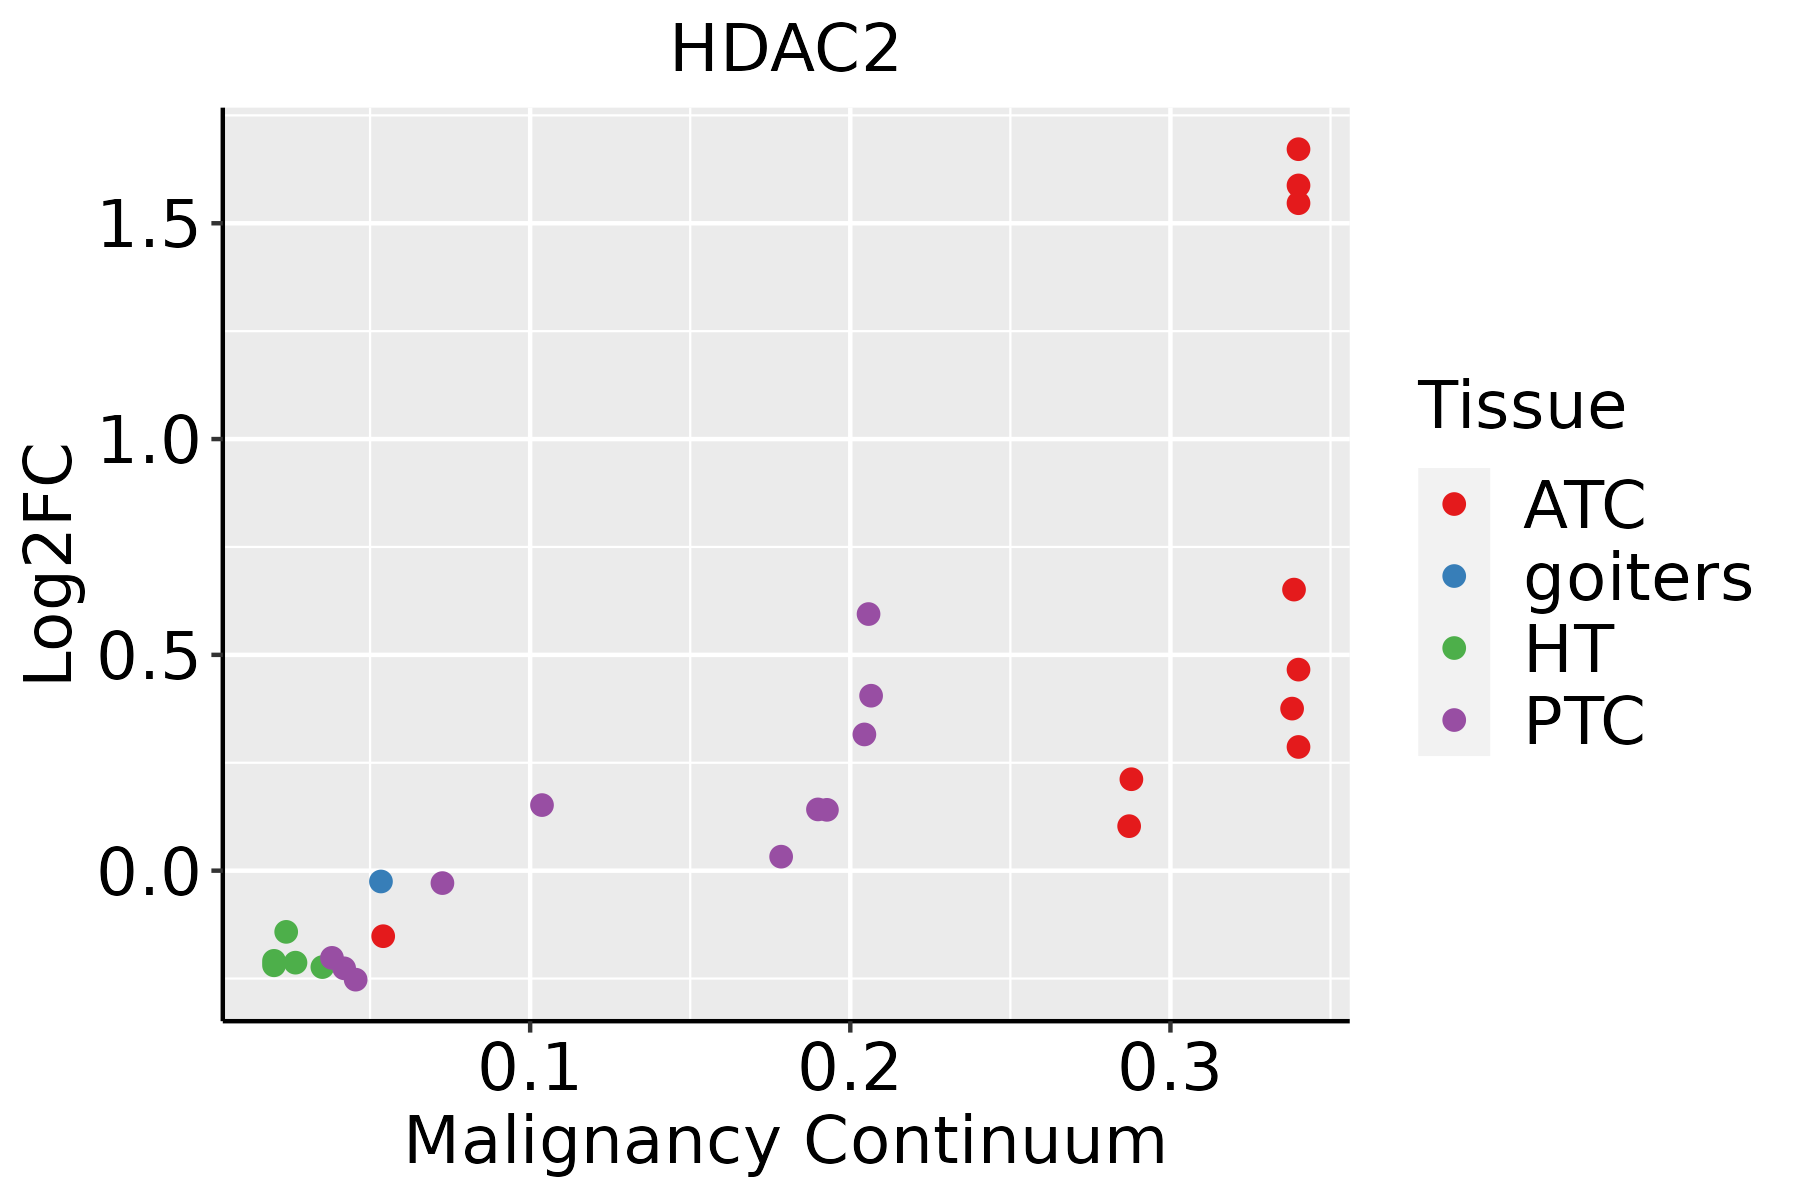 | ATC: Anaplastic thyroid cancer |
| HT: Hashimoto's thyroiditis |
| PTC: Papillary thyroid cancer |
| GO ID | Tissue | Disease Stage | Description | Gene Ratio | Bg Ratio | pvalue | p.adjust | Count |
| GO:00069799 | Breast | Precancer | response to oxidative stress | 70/1080 | 446/18723 | 1.59e-14 | 4.26e-12 | 70 |
| GO:00704829 | Breast | Precancer | response to oxygen levels | 55/1080 | 347/18723 | 7.47e-12 | 1.11e-09 | 55 |
| GO:00621979 | Breast | Precancer | cellular response to chemical stress | 51/1080 | 337/18723 | 2.40e-10 | 2.34e-08 | 51 |
| GO:00003029 | Breast | Precancer | response to reactive oxygen species | 38/1080 | 222/18723 | 1.47e-09 | 1.23e-07 | 38 |
| GO:00458629 | Breast | Precancer | positive regulation of proteolysis | 51/1080 | 372/18723 | 7.77e-09 | 5.70e-07 | 51 |
| GO:00345999 | Breast | Precancer | cellular response to oxidative stress | 42/1080 | 288/18723 | 2.78e-08 | 1.79e-06 | 42 |
| GO:00425429 | Breast | Precancer | response to hydrogen peroxide | 26/1080 | 146/18723 | 2.52e-07 | 1.26e-05 | 26 |
| GO:00511019 | Breast | Precancer | regulation of DNA binding | 22/1080 | 118/18723 | 9.28e-07 | 3.71e-05 | 22 |
| GO:00510989 | Breast | Precancer | regulation of binding | 44/1080 | 363/18723 | 2.59e-06 | 8.65e-05 | 44 |
| GO:00092667 | Breast | Precancer | response to temperature stimulus | 27/1080 | 178/18723 | 3.85e-06 | 1.21e-04 | 27 |
| GO:00018196 | Breast | Precancer | positive regulation of cytokine production | 52/1080 | 467/18723 | 4.18e-06 | 1.29e-04 | 52 |
| GO:00022378 | Breast | Precancer | response to molecule of bacterial origin | 43/1080 | 363/18723 | 6.05e-06 | 1.72e-04 | 43 |
| GO:00346059 | Breast | Precancer | cellular response to heat | 15/1080 | 69/18723 | 7.08e-06 | 1.95e-04 | 15 |
| GO:00324968 | Breast | Precancer | response to lipopolysaccharide | 41/1080 | 343/18723 | 7.94e-06 | 2.17e-04 | 41 |
| GO:00346149 | Breast | Precancer | cellular response to reactive oxygen species | 23/1080 | 155/18723 | 2.82e-05 | 6.31e-04 | 23 |
| GO:00094088 | Breast | Precancer | response to heat | 18/1080 | 110/18723 | 5.57e-05 | 1.15e-03 | 18 |
| GO:00085445 | Breast | Precancer | epidermis development | 35/1080 | 324/18723 | 2.71e-04 | 3.96e-03 | 35 |
| GO:00420633 | Breast | Precancer | gliogenesis | 33/1080 | 301/18723 | 3.06e-04 | 4.40e-03 | 33 |
| GO:00094108 | Breast | Precancer | response to xenobiotic stimulus | 45/1080 | 462/18723 | 4.17e-04 | 5.56e-03 | 45 |
| GO:00100013 | Breast | Precancer | glial cell differentiation | 25/1080 | 225/18723 | 1.29e-03 | 1.37e-02 | 25 |
| TF | Cell Type | Tissue | Disease Stage | Target Gene | RSS | Regulon Activity |
| HDAC2 | STM | Colorectum | CRC | LINC01594,FMNL3,GRM8, etc. | 3.25e-01 |  |
| HDAC2 | ASC | Colorectum | CRC | LINC01594,FMNL3,GRM8, etc. | 3.29e-01 | |
| HDAC2 | ASC | Colorectum | FAP | LINC01594,FMNL3,GRM8, etc. | 2.90e-01 |  |
| HDAC2 | ASC | Colorectum | SER | ESD,MT-ND3,RPL39, etc. | 1.19e-01 |  |
| HDAC2 | AT2L | Lung | IAC | CD24,DBN1,SPINT2, etc. | 4.95e-01 |  |
| HDAC2 | STM | Prostate | Healthy | PHF10,ITGB1BP1,NSDHL, etc. | 4.66e-01 |  |
| HDAC2 | MESC | Stomach | SIM | RPARP-AS1,SLC38A11,SOX4, etc. | 1.20e-01 |  |
| Hugo Symbol | Variant Class | Variant Classification | dbSNP RS | HGVSc | HGVSp | HGVSp Short | SWISSPROT | BIOTYPE | SIFT | PolyPhen | Tumor Sample Barcode | Tissue | Histology | Sex | Age | Stage | Therapy Types | Drugs | Outcome |
| HDAC2 | SNV | Missense_Mutation | rs865852020 | c.110N>A | p.Arg37His | p.R37H | Q92769 | protein_coding | deleterious(0.01) | benign(0.222) | TCGA-AX-A2HD-01 | Endometrium | uterine corpus endometrioid carcinoma | Female | >=65 | III/IV | Unknown | Unknown | SD |
| HDAC2 | SNV | Missense_Mutation | novel | c.1406N>G | p.Asp469Gly | p.D469G | Q92769 | protein_coding | tolerated(0.15) | possibly_damaging(0.516) | TCGA-B5-A1MR-01 | Endometrium | uterine corpus endometrioid carcinoma | Female | >=65 | III/IV | Unknown | Unknown | SD |
| HDAC2 | SNV | Missense_Mutation | novel | c.307N>A | p.Val103Met | p.V103M | Q92769 | protein_coding | deleterious(0.01) | probably_damaging(1) | TCGA-B5-A3FC-01 | Endometrium | uterine corpus endometrioid carcinoma | Female | <65 | I/II | Unknown | Unknown | SD |
| HDAC2 | SNV | Missense_Mutation | novel | c.471N>G | p.Ile157Met | p.I157M | Q92769 | protein_coding | deleterious(0) | possibly_damaging(0.606) | TCGA-D1-A16X-01 | Endometrium | uterine corpus endometrioid carcinoma | Female | <65 | I/II | Unknown | Unknown | SD |
| HDAC2 | SNV | Missense_Mutation | novel | c.1096C>T | p.Arg366Cys | p.R366C | Q92769 | protein_coding | deleterious(0.01) | probably_damaging(0.998) | TCGA-FI-A2D5-01 | Endometrium | uterine corpus endometrioid carcinoma | Female | <65 | III/IV | Chemotherapy | carboplatinum | PD |
| HDAC2 | deletion | Frame_Shift_Del | novel | c.657delN | p.Gly220AlafsTer10 | p.G220Afs*10 | Q92769 | protein_coding | | | TCGA-DF-A2KN-01 | Endometrium | uterine corpus endometrioid carcinoma | Female | Unknown | I/II | Unknown | Unknown | SD |
| HDAC2 | SNV | Missense_Mutation | | c.1311N>A | p.Asp437Glu | p.D437E | Q92769 | protein_coding | tolerated(0.23) | benign(0.021) | TCGA-CC-A123-01 | Liver | liver hepatocellular carcinoma | Female | <65 | III/IV | Unknown | Unknown | PD |
| HDAC2 | SNV | Missense_Mutation | | c.1311N>A | p.Asp437Glu | p.D437E | Q92769 | protein_coding | tolerated(0.23) | benign(0.021) | TCGA-DD-A1EE-01 | Liver | liver hepatocellular carcinoma | Male | >=65 | III/IV | Unknown | Unknown | PD |
| HDAC2 | SNV | Missense_Mutation | novel | c.396N>T | p.Met132Ile | p.M132I | Q92769 | protein_coding | tolerated(1) | benign(0) | TCGA-DD-AAVP-01 | Liver | liver hepatocellular carcinoma | Male | <65 | I/II | Unknown | Unknown | PD |
| HDAC2 | SNV | Missense_Mutation | | c.82N>C | p.Gly28Arg | p.G28R | Q92769 | protein_coding | deleterious(0) | probably_damaging(1) | TCGA-05-4432-01 | Lung | lung adenocarcinoma | Male | >=65 | I/II | Chemotherapy | cisplatin | CR |
| Entrez ID | Symbol | Category | Interaction Types | Drug Claim Name | Drug Name | PMIDs |
| 3066 | HDAC2 | DRUGGABLE GENOME, CLINICALLY ACTIONABLE, ENZYME, TRANSCRIPTION FACTOR | | 2-ENE-VALPROATE | CHEMBL117487 | 17566732 |
| 3066 | HDAC2 | DRUGGABLE GENOME, CLINICALLY ACTIONABLE, ENZYME, TRANSCRIPTION FACTOR | inhibitor | 187051807 | SCRIPTAID | |
| 3066 | HDAC2 | DRUGGABLE GENOME, CLINICALLY ACTIONABLE, ENZYME, TRANSCRIPTION FACTOR | inhibitor | BELINOSTAT | BELINOSTAT | |
| 3066 | HDAC2 | DRUGGABLE GENOME, CLINICALLY ACTIONABLE, ENZYME, TRANSCRIPTION FACTOR | inhibitor | 187051797 | APICIDIN | |
| 3066 | HDAC2 | DRUGGABLE GENOME, CLINICALLY ACTIONABLE, ENZYME, TRANSCRIPTION FACTOR | | PAZOPANIB | PAZOPANIB | 28221861 |
| 3066 | HDAC2 | DRUGGABLE GENOME, CLINICALLY ACTIONABLE, ENZYME, TRANSCRIPTION FACTOR | | PRACINOSTAT | PRACINOSTAT | |
| 3066 | HDAC2 | DRUGGABLE GENOME, CLINICALLY ACTIONABLE, ENZYME, TRANSCRIPTION FACTOR | inhibitor | 187051798 | BELINOSTAT | |
| 3066 | HDAC2 | DRUGGABLE GENOME, CLINICALLY ACTIONABLE, ENZYME, TRANSCRIPTION FACTOR | inhibitor | SODIUM PHENYLBUTYRATE | | |
| 3066 | HDAC2 | DRUGGABLE GENOME, CLINICALLY ACTIONABLE, ENZYME, TRANSCRIPTION FACTOR | | VORINOSTAT | VORINOSTAT | 24694055,19344175,19966789,26211462,23622981,22260166,17447750,20491440,21548582,24074025,23672185,19084294 |
| 3066 | HDAC2 | DRUGGABLE GENOME, CLINICALLY ACTIONABLE, ENZYME, TRANSCRIPTION FACTOR | | PANOBINOSTAT | PANOBINOSTAT | |


