
|
|||||
|
 | |
| |
| |
| |
| |
| |
|
Gene: GPX3 |
Gene summary for GPX3 |
| Gene information | Species | Human | Gene symbol | GPX3 | Gene ID | 2878 |
| Gene name | glutathione peroxidase 3 | |
| Gene Alias | GPx-P | |
| Cytomap | 5q33.1 | |
| Gene Type | protein-coding | GO ID | GO:0006950 | UniProtAcc | P22352 |
Top |
Malignant transformation analysis |
| Identification of the aberrant gene expression in precancerous and cancerous lesions by comparing the gene expression of stem-like cells in diseased tissues with normal stem cells |
| Entrez ID | Symbol | Replicates | Species | Organ | Tissue | Adj P-value | Log2FC | Malignancy |
| 2878 | GPX3 | LZE2T | Human | Esophagus | ESCC | 3.78e-17 | 1.56e-01 | 0.082 |
| 2878 | GPX3 | LZE4T | Human | Esophagus | ESCC | 2.64e-04 | 3.85e-01 | 0.0811 |
| 2878 | GPX3 | LZE7T | Human | Esophagus | ESCC | 9.73e-03 | -3.71e-01 | 0.0667 |
| 2878 | GPX3 | LZE8T | Human | Esophagus | ESCC | 3.05e-04 | -4.52e-01 | 0.067 |
| 2878 | GPX3 | LZE20T | Human | Esophagus | ESCC | 1.15e-02 | -4.03e-01 | 0.0662 |
| 2878 | GPX3 | LZE24T | Human | Esophagus | ESCC | 4.06e-05 | -3.98e-01 | 0.0596 |
| 2878 | GPX3 | LZE6T | Human | Esophagus | ESCC | 3.11e-02 | -4.52e-01 | 0.0845 |
| 2878 | GPX3 | P2T-E | Human | Esophagus | ESCC | 1.56e-10 | -2.20e-01 | 0.1177 |
| 2878 | GPX3 | P5T-E | Human | Esophagus | ESCC | 7.72e-07 | 1.46e-01 | 0.1327 |
| 2878 | GPX3 | P9T-E | Human | Esophagus | ESCC | 3.09e-02 | 3.78e-02 | 0.1131 |
| 2878 | GPX3 | P10T-E | Human | Esophagus | ESCC | 1.37e-08 | -3.97e-01 | 0.116 |
| 2878 | GPX3 | P16T-E | Human | Esophagus | ESCC | 6.95e-12 | -3.69e-01 | 0.1153 |
| 2878 | GPX3 | P20T-E | Human | Esophagus | ESCC | 1.13e-02 | -2.56e-01 | 0.1124 |
| 2878 | GPX3 | P22T-E | Human | Esophagus | ESCC | 1.12e-05 | -4.06e-01 | 0.1236 |
| 2878 | GPX3 | P26T-E | Human | Esophagus | ESCC | 1.02e-03 | -1.65e-01 | 0.1276 |
| 2878 | GPX3 | P32T-E | Human | Esophagus | ESCC | 8.35e-13 | 4.32e-01 | 0.1666 |
| 2878 | GPX3 | P36T-E | Human | Esophagus | ESCC | 1.69e-02 | -3.86e-01 | 0.1187 |
| 2878 | GPX3 | P37T-E | Human | Esophagus | ESCC | 8.94e-03 | 8.94e-02 | 0.1371 |
| 2878 | GPX3 | P39T-E | Human | Esophagus | ESCC | 1.61e-08 | -4.22e-01 | 0.0894 |
| 2878 | GPX3 | P42T-E | Human | Esophagus | ESCC | 1.96e-03 | -8.72e-02 | 0.1175 |
| Page: 1 2 3 4 |
| Tissue | Expression Dynamics | Abbreviation |
| Esophagus | 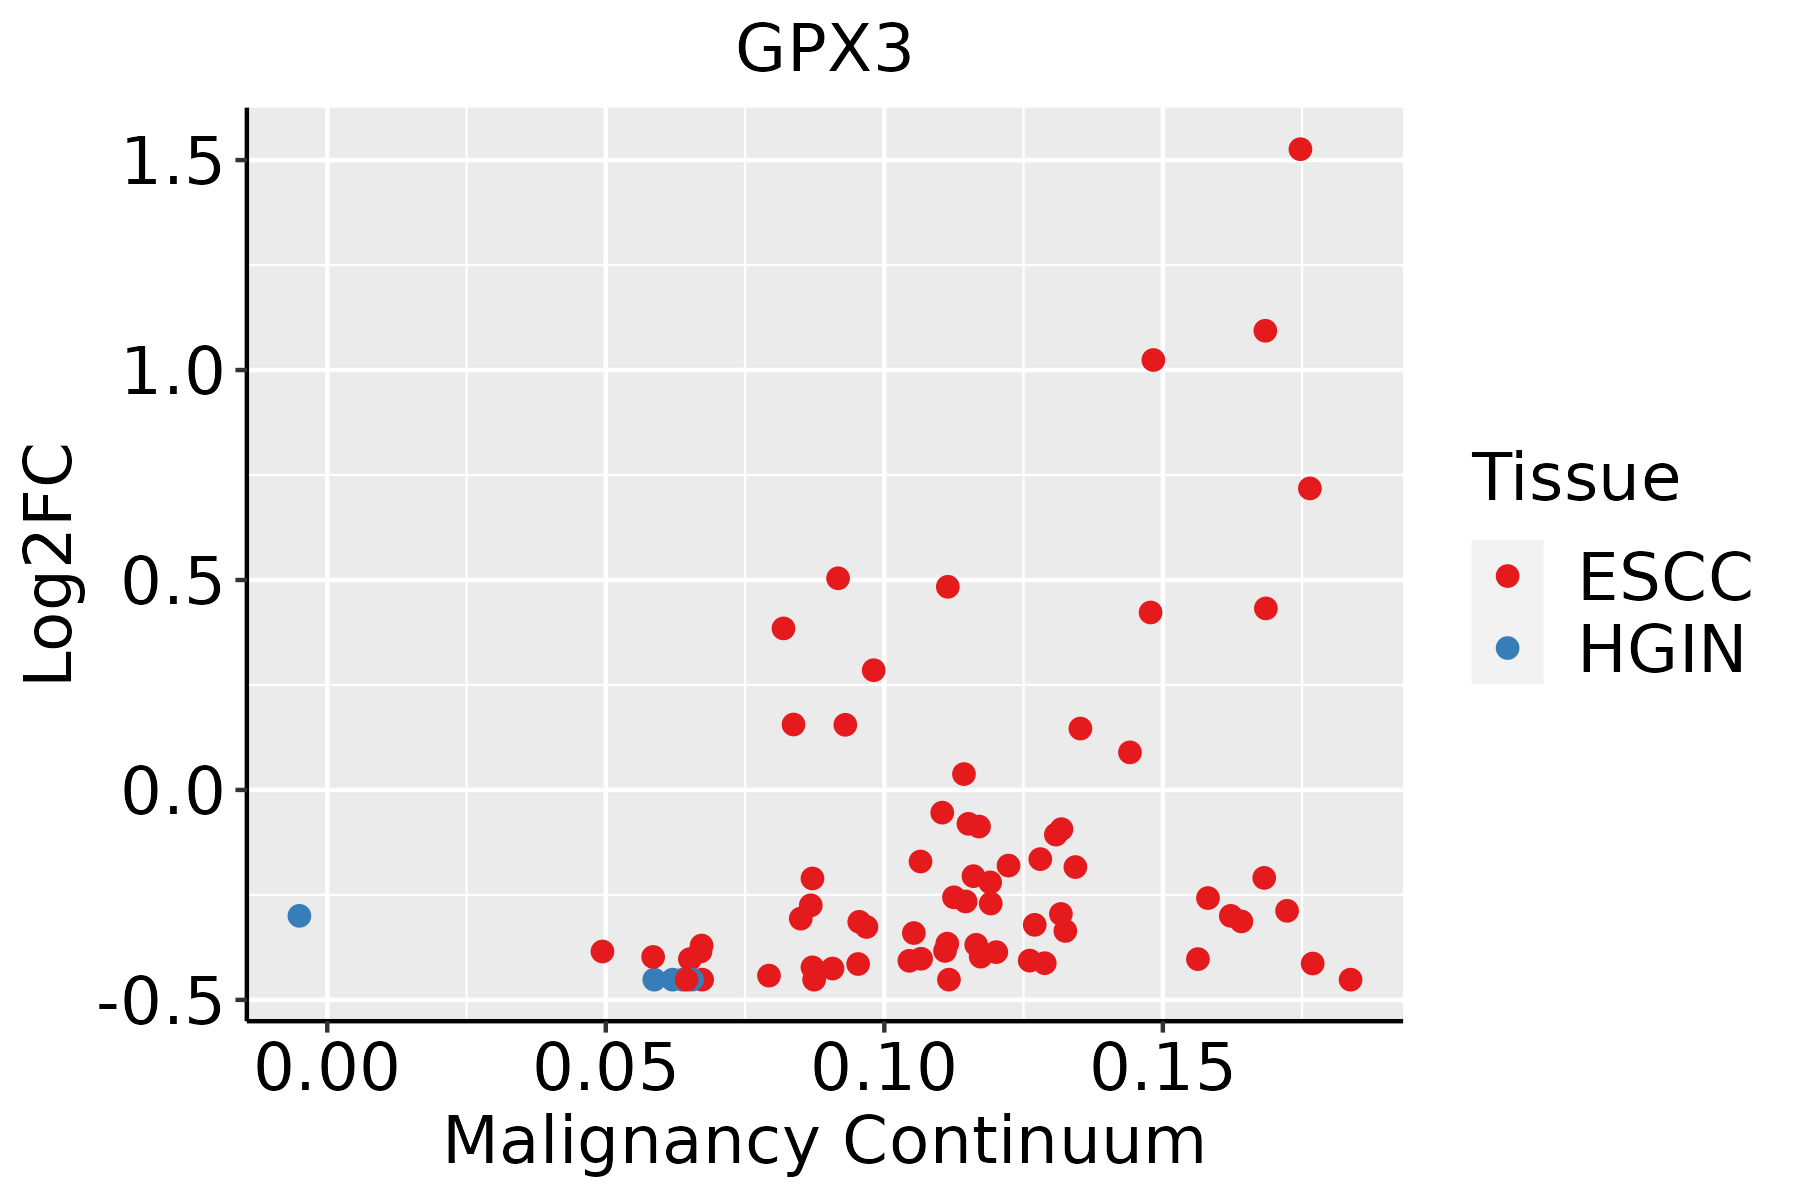 | ESCC: Esophageal squamous cell carcinoma |
| HGIN: High-grade intraepithelial neoplasias | ||
| LGIN: Low-grade intraepithelial neoplasias | ||
| Liver |  | HCC: Hepatocellular carcinoma |
| NAFLD: Non-alcoholic fatty liver disease | ||
| Oral Cavity | 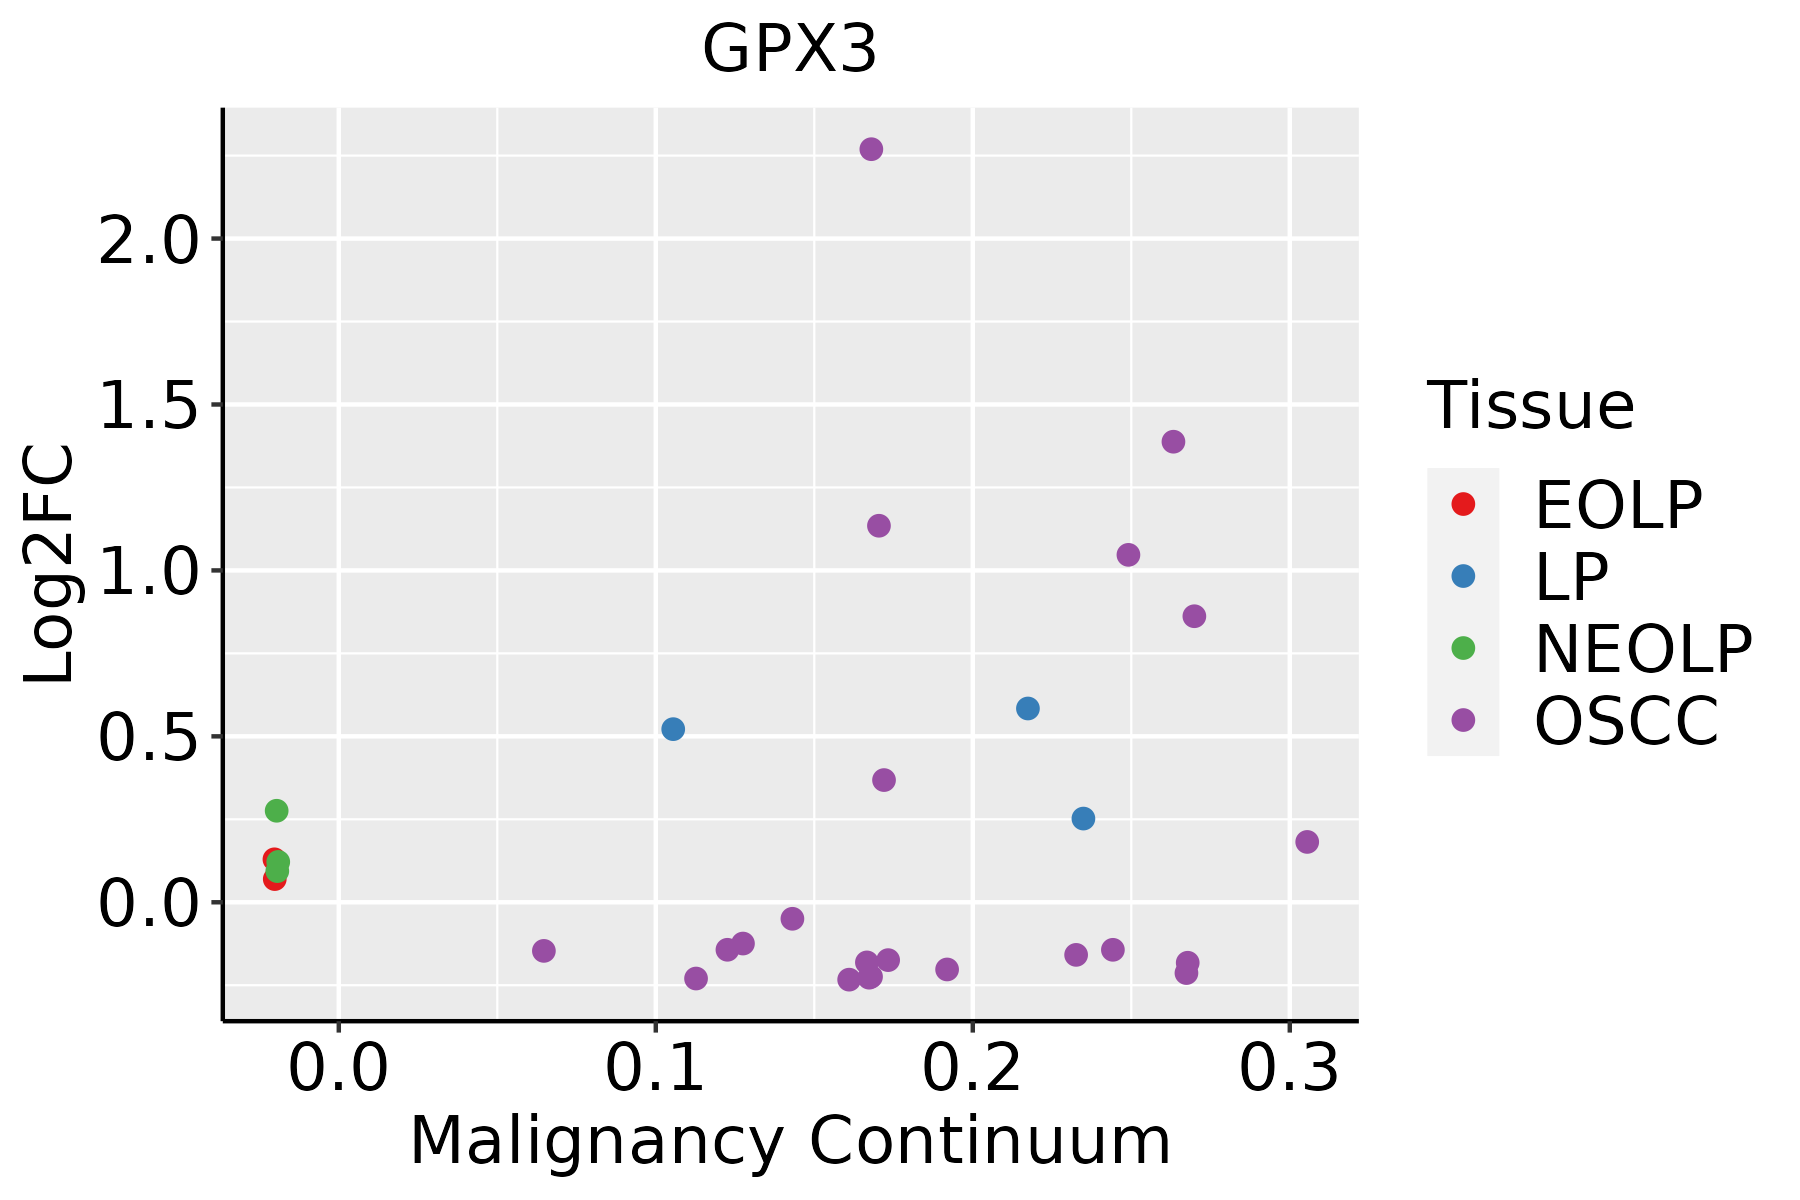 | EOLP: Erosive Oral lichen planus |
| LP: leukoplakia | ||
| NEOLP: Non-erosive oral lichen planus | ||
| OSCC: Oral squamous cell carcinoma | ||
| Thyroid |  | ATC: Anaplastic thyroid cancer |
| HT: Hashimoto's thyroiditis | ||
| PTC: Papillary thyroid cancer |
| ∗log2FC in expression of this searched gene in stem-like cells from each diseased tissue sample relative to stem-like cells in normal samples in each tissue plotted against the malignancy continuum. Samples are colored based on if they are from different disease stage. |
Top |
Malignant transformation related pathway analysis |
| Find out the enriched GO biological processes and KEGG pathways involved in transition from healthy to precancer to cancer |
| Tissue | Disease Stage | Enriched GO biological Processes |
| Colorectum | AD |  |
| Colorectum | SER |  |
| Colorectum | MSS |  |
| Colorectum | MSI-H |  |
| Colorectum | FAP |  |
| ∗Top 15 enriched GO BP terms are showed in the bar plot of each disease state in each tissue. Each row represents a significant GO biological process which is colored according to the -log10(p.adjust). |
| Page: 1 2 3 4 5 6 7 8 9 |
| GO ID | Tissue | Disease Stage | Description | Gene Ratio | Bg Ratio | pvalue | p.adjust | Count |
| GO:0006979111 | Esophagus | ESCC | response to oxidative stress | 303/8552 | 446/18723 | 7.15e-22 | 1.30e-19 | 303 |
| GO:000963620 | Esophagus | ESCC | response to toxic substance | 150/8552 | 262/18723 | 1.00e-04 | 7.12e-04 | 150 |
| GO:007259318 | Esophagus | ESCC | reactive oxygen species metabolic process | 137/8552 | 239/18723 | 1.82e-04 | 1.16e-03 | 137 |
| GO:1990748110 | Esophagus | ESCC | cellular detoxification | 70/8552 | 116/18723 | 1.02e-03 | 5.17e-03 | 70 |
| GO:0097237110 | Esophagus | ESCC | cellular response to toxic substance | 72/8552 | 124/18723 | 3.65e-03 | 1.49e-02 | 72 |
| GO:0098869110 | Esophagus | ESCC | cellular oxidant detoxification | 60/8552 | 101/18723 | 3.76e-03 | 1.53e-02 | 60 |
| GO:000697912 | Liver | Cirrhotic | response to oxidative stress | 196/4634 | 446/18723 | 2.80e-19 | 5.86e-17 | 196 |
| GO:000963612 | Liver | Cirrhotic | response to toxic substance | 104/4634 | 262/18723 | 5.63e-08 | 1.74e-06 | 104 |
| GO:00725937 | Liver | Cirrhotic | reactive oxygen species metabolic process | 92/4634 | 239/18723 | 1.57e-06 | 3.03e-05 | 92 |
| GO:00987547 | Liver | Cirrhotic | detoxification | 60/4634 | 152/18723 | 4.09e-05 | 4.86e-04 | 60 |
| GO:00972377 | Liver | Cirrhotic | cellular response to toxic substance | 50/4634 | 124/18723 | 9.20e-05 | 9.79e-04 | 50 |
| GO:19907487 | Liver | Cirrhotic | cellular detoxification | 47/4634 | 116/18723 | 1.28e-04 | 1.26e-03 | 47 |
| GO:00988697 | Liver | Cirrhotic | cellular oxidant detoxification | 38/4634 | 101/18723 | 2.72e-03 | 1.59e-02 | 38 |
| GO:000697922 | Liver | HCC | response to oxidative stress | 281/7958 | 446/18723 | 9.75e-19 | 1.24e-16 | 281 |
| GO:000963622 | Liver | HCC | response to toxic substance | 153/7958 | 262/18723 | 1.37e-07 | 2.58e-06 | 153 |
| GO:199074812 | Liver | HCC | cellular detoxification | 70/7958 | 116/18723 | 7.87e-05 | 7.02e-04 | 70 |
| GO:009723712 | Liver | HCC | cellular response to toxic substance | 74/7958 | 124/18723 | 8.36e-05 | 7.36e-04 | 74 |
| GO:009875412 | Liver | HCC | detoxification | 87/7958 | 152/18723 | 1.70e-04 | 1.35e-03 | 87 |
| GO:009886912 | Liver | HCC | cellular oxidant detoxification | 59/7958 | 101/18723 | 9.00e-04 | 5.31e-03 | 59 |
| GO:007259312 | Liver | HCC | reactive oxygen species metabolic process | 124/7958 | 239/18723 | 2.05e-03 | 1.04e-02 | 124 |
| Page: 1 2 3 4 |
| Pathway ID | Tissue | Disease Stage | Description | Gene Ratio | Bg Ratio | pvalue | p.adjust | qvalue | Count |
| hsa05014210 | Esophagus | ESCC | Amyotrophic lateral sclerosis | 266/4205 | 364/8465 | 1.31e-20 | 2.20e-18 | 1.13e-18 | 266 |
| hsa05016210 | Esophagus | ESCC | Huntington disease | 226/4205 | 306/8465 | 1.38e-18 | 8.72e-17 | 4.46e-17 | 226 |
| hsa05022210 | Esophagus | ESCC | Pathways of neurodegeneration - multiple diseases | 318/4205 | 476/8465 | 6.10e-15 | 2.04e-13 | 1.05e-13 | 318 |
| hsa0048018 | Esophagus | ESCC | Glutathione metabolism | 44/4205 | 57/8465 | 1.81e-05 | 9.03e-05 | 4.63e-05 | 44 |
| hsa0501438 | Esophagus | ESCC | Amyotrophic lateral sclerosis | 266/4205 | 364/8465 | 1.31e-20 | 2.20e-18 | 1.13e-18 | 266 |
| hsa0501638 | Esophagus | ESCC | Huntington disease | 226/4205 | 306/8465 | 1.38e-18 | 8.72e-17 | 4.46e-17 | 226 |
| hsa0502238 | Esophagus | ESCC | Pathways of neurodegeneration - multiple diseases | 318/4205 | 476/8465 | 6.10e-15 | 2.04e-13 | 1.05e-13 | 318 |
| hsa0048019 | Esophagus | ESCC | Glutathione metabolism | 44/4205 | 57/8465 | 1.81e-05 | 9.03e-05 | 4.63e-05 | 44 |
| hsa0501614 | Liver | Cirrhotic | Huntington disease | 172/2530 | 306/8465 | 1.65e-22 | 1.10e-20 | 6.77e-21 | 172 |
| hsa0501414 | Liver | Cirrhotic | Amyotrophic lateral sclerosis | 187/2530 | 364/8465 | 1.56e-18 | 6.50e-17 | 4.01e-17 | 187 |
| hsa0502214 | Liver | Cirrhotic | Pathways of neurodegeneration - multiple diseases | 217/2530 | 476/8465 | 7.30e-14 | 2.03e-12 | 1.25e-12 | 217 |
| hsa004809 | Liver | Cirrhotic | Glutathione metabolism | 30/2530 | 57/8465 | 2.63e-04 | 1.72e-03 | 1.06e-03 | 30 |
| hsa0501615 | Liver | Cirrhotic | Huntington disease | 172/2530 | 306/8465 | 1.65e-22 | 1.10e-20 | 6.77e-21 | 172 |
| hsa0501415 | Liver | Cirrhotic | Amyotrophic lateral sclerosis | 187/2530 | 364/8465 | 1.56e-18 | 6.50e-17 | 4.01e-17 | 187 |
| hsa0502215 | Liver | Cirrhotic | Pathways of neurodegeneration - multiple diseases | 217/2530 | 476/8465 | 7.30e-14 | 2.03e-12 | 1.25e-12 | 217 |
| hsa0048012 | Liver | Cirrhotic | Glutathione metabolism | 30/2530 | 57/8465 | 2.63e-04 | 1.72e-03 | 1.06e-03 | 30 |
| hsa0501622 | Liver | HCC | Huntington disease | 219/4020 | 306/8465 | 3.06e-18 | 3.42e-16 | 1.90e-16 | 219 |
| hsa0501422 | Liver | HCC | Amyotrophic lateral sclerosis | 252/4020 | 364/8465 | 8.85e-18 | 7.41e-16 | 4.12e-16 | 252 |
| hsa0502222 | Liver | HCC | Pathways of neurodegeneration - multiple diseases | 298/4020 | 476/8465 | 6.59e-12 | 1.30e-10 | 7.22e-11 | 298 |
| hsa0048022 | Liver | HCC | Glutathione metabolism | 42/4020 | 57/8465 | 5.00e-05 | 2.62e-04 | 1.46e-04 | 42 |
| Page: 1 2 |
Top |
Cell-cell communication analysis |
| Identification of potential cell-cell interactions between two cell types and their ligand-receptor pairs for different disease states |
| Ligand | Receptor | LRpair | Pathway | Tissue | Disease Stage |
| Page: 1 |
Top |
Single-cell gene regulatory network inference analysis |
| Find out the significant the regulons (TFs) and the target genes of each regulon across cell types for different disease states |
| TF | Cell Type | Tissue | Disease Stage | Target Gene | RSS | Regulon Activity |
| ∗The dot plots of a searched regulon are shown for all cell subpopulations in each disease state of each tissue based on the regulon specific score inferred using pySCENIC and by calculating the average expression. |
| Page: 1 |
Top |
Somatic mutation of malignant transformation related genes |
| Annotation of somatic variants for genes involved in malignant transformation |
| Hugo Symbol | Variant Class | Variant Classification | dbSNP RS | HGVSc | HGVSp | HGVSp Short | SWISSPROT | BIOTYPE | SIFT | PolyPhen | Tumor Sample Barcode | Tissue | Histology | Sex | Age | Stage | Therapy Types | Drugs | Outcome |
| GPX3 | SNV | Missense_Mutation | novel | c.445N>C | p.Tyr149His | p.Y149H | P22352 | protein_coding | deleterious(0) | probably_damaging(0.982) | TCGA-CG-4460-01 | Stomach | stomach adenocarcinoma | Female | >=65 | III/IV | Chemotherapy | capecitabine | PD |
| GPX3 | SNV | Missense_Mutation | c.579N>G | p.Ile193Met | p.I193M | P22352 | protein_coding | tolerated(0.06) | benign(0.005) | TCGA-HU-A4GT-01 | Stomach | stomach adenocarcinoma | Female | >=65 | I/II | Chemotherapy | copolang | SD | |
| GPX3 | SNV | Missense_Mutation | novel | c.26N>A | p.Cys9Tyr | p.C9Y | P22352 | protein_coding | tolerated_low_confidence(0.71) | benign(0.169) | TCGA-KB-A93J-01 | Stomach | stomach adenocarcinoma | Male | >=65 | I/II | Chemotherapy | 5-fluorouracil | CR |
| GPX3 | SNV | Missense_Mutation | novel | c.677A>G | p.Lys226Arg | p.K226R | P22352 | protein_coding | deleterious_low_confidence(0.03) | benign(0.04) | TCGA-DJ-A3VK-01 | Thyroid | thyroid carcinoma | Male | <65 | III/IV | Unknown | Unknown | SD |
| GPX3 | insertion | In_Frame_Ins | novel | c.675_676insTGGGAGGAC | p.Arg225_Lys226insTrpGluAsp | p.R225_K226insWED | P22352 | protein_coding | TCGA-DJ-A3VK-01 | Thyroid | thyroid carcinoma | Male | <65 | III/IV | Unknown | Unknown | SD |
| Page: 1 2 3 |
Top |
Related drugs of malignant transformation related genes |
| Identification of chemicals and drugs interact with genes involved in malignant transfromation |
| (DGIdb 4.0) |
| Entrez ID | Symbol | Category | Interaction Types | Drug Claim Name | Drug Name | PMIDs |
| Page: 1 |

Copyright 2023-Present -The University of Texas Health Science Center at Houston |