
|
|||||
|
 | |
| |
| |
| |
| |
| |
|
Gene: FAIM2 |
Gene summary for FAIM2 |
| Gene information | Species | Human | Gene symbol | FAIM2 | Gene ID | 23017 |
| Gene name | Fas apoptotic inhibitory molecule 2 | |
| Gene Alias | LFG | |
| Cytomap | 12q13.12 | |
| Gene Type | protein-coding | GO ID | GO:0002931 | UniProtAcc | Q9BWQ8 |
Top |
Malignant transformation analysis |
| Identification of the aberrant gene expression in precancerous and cancerous lesions by comparing the gene expression of stem-like cells in diseased tissues with normal stem cells |
| Entrez ID | Symbol | Replicates | Species | Organ | Tissue | Adj P-value | Log2FC | Malignancy |
| 23017 | FAIM2 | ATC13 | Human | Thyroid | ATC | 2.56e-35 | 7.10e-01 | 0.34 |
| 23017 | FAIM2 | ATC5 | Human | Thyroid | ATC | 2.60e-44 | 7.60e-01 | 0.34 |
| Page: 1 |
| Tissue | Expression Dynamics | Abbreviation |
| Thyroid | 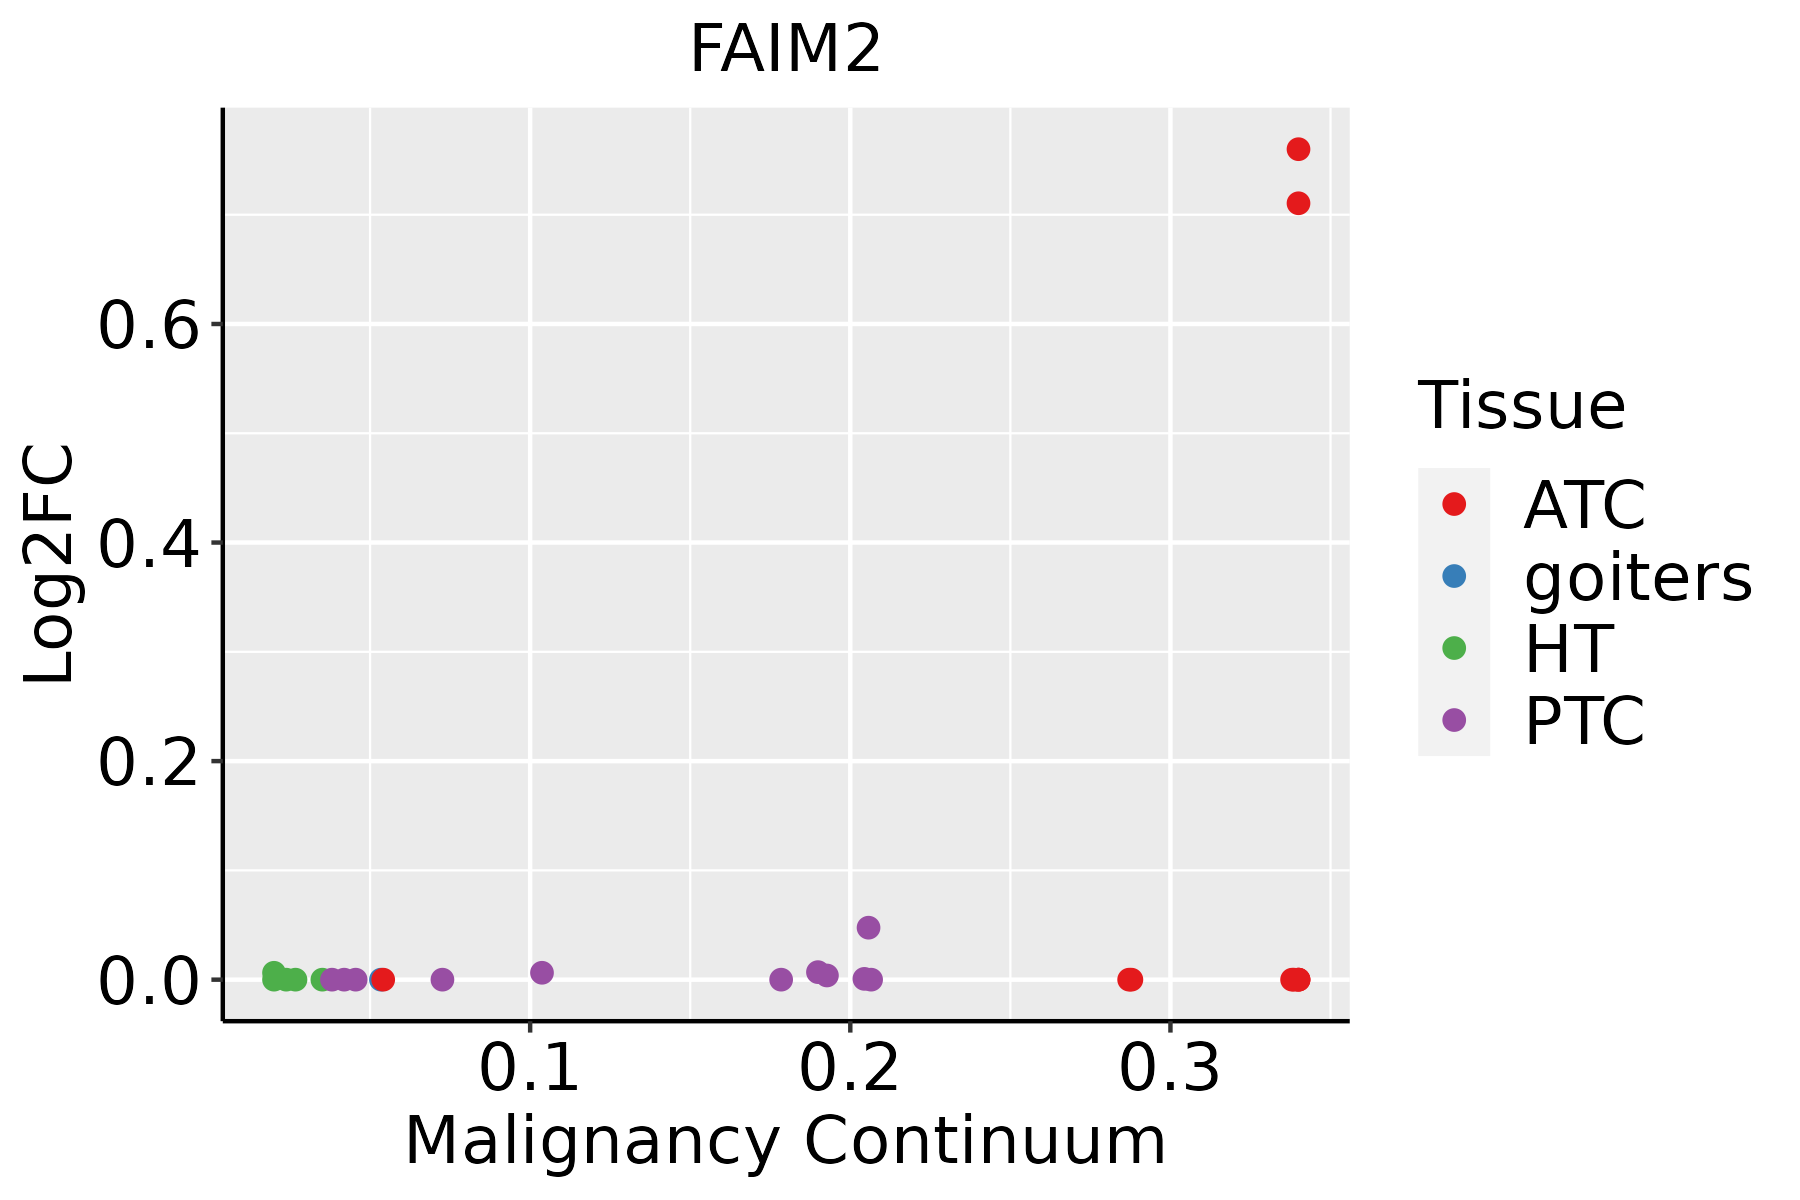 | ATC: Anaplastic thyroid cancer |
| HT: Hashimoto's thyroiditis | ||
| PTC: Papillary thyroid cancer |
| ∗log2FC in expression of this searched gene in stem-like cells from each diseased tissue sample relative to stem-like cells in normal samples in each tissue plotted against the malignancy continuum. Samples are colored based on if they are from different disease stage. |
Top |
Malignant transformation related pathway analysis |
| Find out the enriched GO biological processes and KEGG pathways involved in transition from healthy to precancer to cancer |
| Tissue | Disease Stage | Enriched GO biological Processes |
| Colorectum | AD |  |
| Colorectum | SER |  |
| Colorectum | MSS |  |
| Colorectum | MSI-H |  |
| Colorectum | FAP |  |
| ∗Top 15 enriched GO BP terms are showed in the bar plot of each disease state in each tissue. Each row represents a significant GO biological process which is colored according to the -log10(p.adjust). |
| Page: 1 2 3 4 5 6 7 8 9 |
| GO ID | Tissue | Disease Stage | Description | Gene Ratio | Bg Ratio | pvalue | p.adjust | Count |
| GO:200123335 | Thyroid | ATC | regulation of apoptotic signaling pathway | 206/6293 | 356/18723 | 2.81e-21 | 5.92e-19 | 206 |
| GO:2001234210 | Thyroid | ATC | negative regulation of apoptotic signaling pathway | 129/6293 | 224/18723 | 1.26e-13 | 6.46e-12 | 129 |
| GO:0097191210 | Thyroid | ATC | extrinsic apoptotic signaling pathway | 125/6293 | 219/18723 | 7.19e-13 | 3.16e-11 | 125 |
| GO:2001236210 | Thyroid | ATC | regulation of extrinsic apoptotic signaling pathway | 89/6293 | 151/18723 | 1.43e-10 | 4.40e-09 | 89 |
| GO:0070997210 | Thyroid | ATC | neuron death | 176/6293 | 361/18723 | 1.43e-09 | 3.57e-08 | 176 |
| GO:190121428 | Thyroid | ATC | regulation of neuron death | 156/6293 | 319/18723 | 9.30e-09 | 1.96e-07 | 156 |
| GO:0008625111 | Thyroid | ATC | extrinsic apoptotic signaling pathway via death domain receptors | 50/6293 | 82/18723 | 3.47e-07 | 5.13e-06 | 50 |
| GO:005140227 | Thyroid | ATC | neuron apoptotic process | 120/6293 | 246/18723 | 5.41e-07 | 7.75e-06 | 120 |
| GO:004352323 | Thyroid | ATC | regulation of neuron apoptotic process | 104/6293 | 212/18723 | 2.16e-06 | 2.58e-05 | 104 |
| GO:1902041110 | Thyroid | ATC | regulation of extrinsic apoptotic signaling pathway via death domain receptors | 32/6293 | 49/18723 | 5.63e-06 | 6.00e-05 | 32 |
| GO:200123729 | Thyroid | ATC | negative regulation of extrinsic apoptotic signaling pathway | 54/6293 | 97/18723 | 6.41e-06 | 6.68e-05 | 54 |
| GO:190121519 | Thyroid | ATC | negative regulation of neuron death | 97/6293 | 208/18723 | 6.19e-05 | 4.73e-04 | 97 |
| GO:000293111 | Thyroid | ATC | response to ischemia | 34/6293 | 58/18723 | 8.05e-05 | 6.03e-04 | 34 |
| GO:190204212 | Thyroid | ATC | negative regulation of extrinsic apoptotic signaling pathway via death domain receptors | 19/6293 | 31/18723 | 1.45e-03 | 7.47e-03 | 19 |
| GO:004352412 | Thyroid | ATC | negative regulation of neuron apoptotic process | 66/6293 | 145/18723 | 1.86e-03 | 9.11e-03 | 66 |
| Page: 1 |
| Pathway ID | Tissue | Disease Stage | Description | Gene Ratio | Bg Ratio | pvalue | p.adjust | qvalue | Count |
| Page: 1 |
Top |
Cell-cell communication analysis |
| Identification of potential cell-cell interactions between two cell types and their ligand-receptor pairs for different disease states |
| Ligand | Receptor | LRpair | Pathway | Tissue | Disease Stage |
| Page: 1 |
Top |
Single-cell gene regulatory network inference analysis |
| Find out the significant the regulons (TFs) and the target genes of each regulon across cell types for different disease states |
| TF | Cell Type | Tissue | Disease Stage | Target Gene | RSS | Regulon Activity |
| ∗The dot plots of a searched regulon are shown for all cell subpopulations in each disease state of each tissue based on the regulon specific score inferred using pySCENIC and by calculating the average expression. |
| Page: 1 |
Top |
Somatic mutation of malignant transformation related genes |
| Annotation of somatic variants for genes involved in malignant transformation |
| Hugo Symbol | Variant Class | Variant Classification | dbSNP RS | HGVSc | HGVSp | HGVSp Short | SWISSPROT | BIOTYPE | SIFT | PolyPhen | Tumor Sample Barcode | Tissue | Histology | Sex | Age | Stage | Therapy Types | Drugs | Outcome |
| FAIM2 | SNV | Missense_Mutation | c.388N>T | p.Val130Phe | p.V130F | Q9BWQ8 | protein_coding | deleterious(0) | possibly_damaging(0.889) | TCGA-78-7166-01 | Lung | lung adenocarcinoma | Male | >=65 | I/II | Unknown | Unknown | SD | |
| FAIM2 | SNV | Missense_Mutation | c.133N>C | p.Glu45Gln | p.E45Q | Q9BWQ8 | protein_coding | tolerated(0.45) | benign(0.287) | TCGA-91-6836-01 | Lung | lung adenocarcinoma | Female | <65 | I/II | Unknown | Unknown | SD | |
| FAIM2 | SNV | Missense_Mutation | c.856N>A | p.Pro286Thr | p.P286T | Q9BWQ8 | protein_coding | deleterious(0) | probably_damaging(0.999) | TCGA-60-2708-01 | Lung | lung squamous cell carcinoma | Female | <65 | I/II | Chemotherapy | carboplatin | SD | |
| FAIM2 | SNV | Missense_Mutation | novel | c.799T>A | p.Leu267Met | p.L267M | Q9BWQ8 | protein_coding | tolerated(0.26) | benign(0.047) | TCGA-77-8153-01 | Lung | lung squamous cell carcinoma | Female | >=65 | I/II | Unknown | Unknown | SD |
| FAIM2 | SNV | Missense_Mutation | c.917N>C | p.Phe306Ser | p.F306S | Q9BWQ8 | protein_coding | deleterious(0.02) | probably_damaging(0.999) | TCGA-ET-A2MY-01 | Thyroid | thyroid carcinoma | Female | >=65 | I/II | Unknown | Unknown | SD |
| Page: 1 2 3 |
Top |
Related drugs of malignant transformation related genes |
| Identification of chemicals and drugs interact with genes involved in malignant transfromation |
| (DGIdb 4.0) |
| Entrez ID | Symbol | Category | Interaction Types | Drug Claim Name | Drug Name | PMIDs |
| Page: 1 |

Copyright 2023-Present -The University of Texas Health Science Center at Houston |